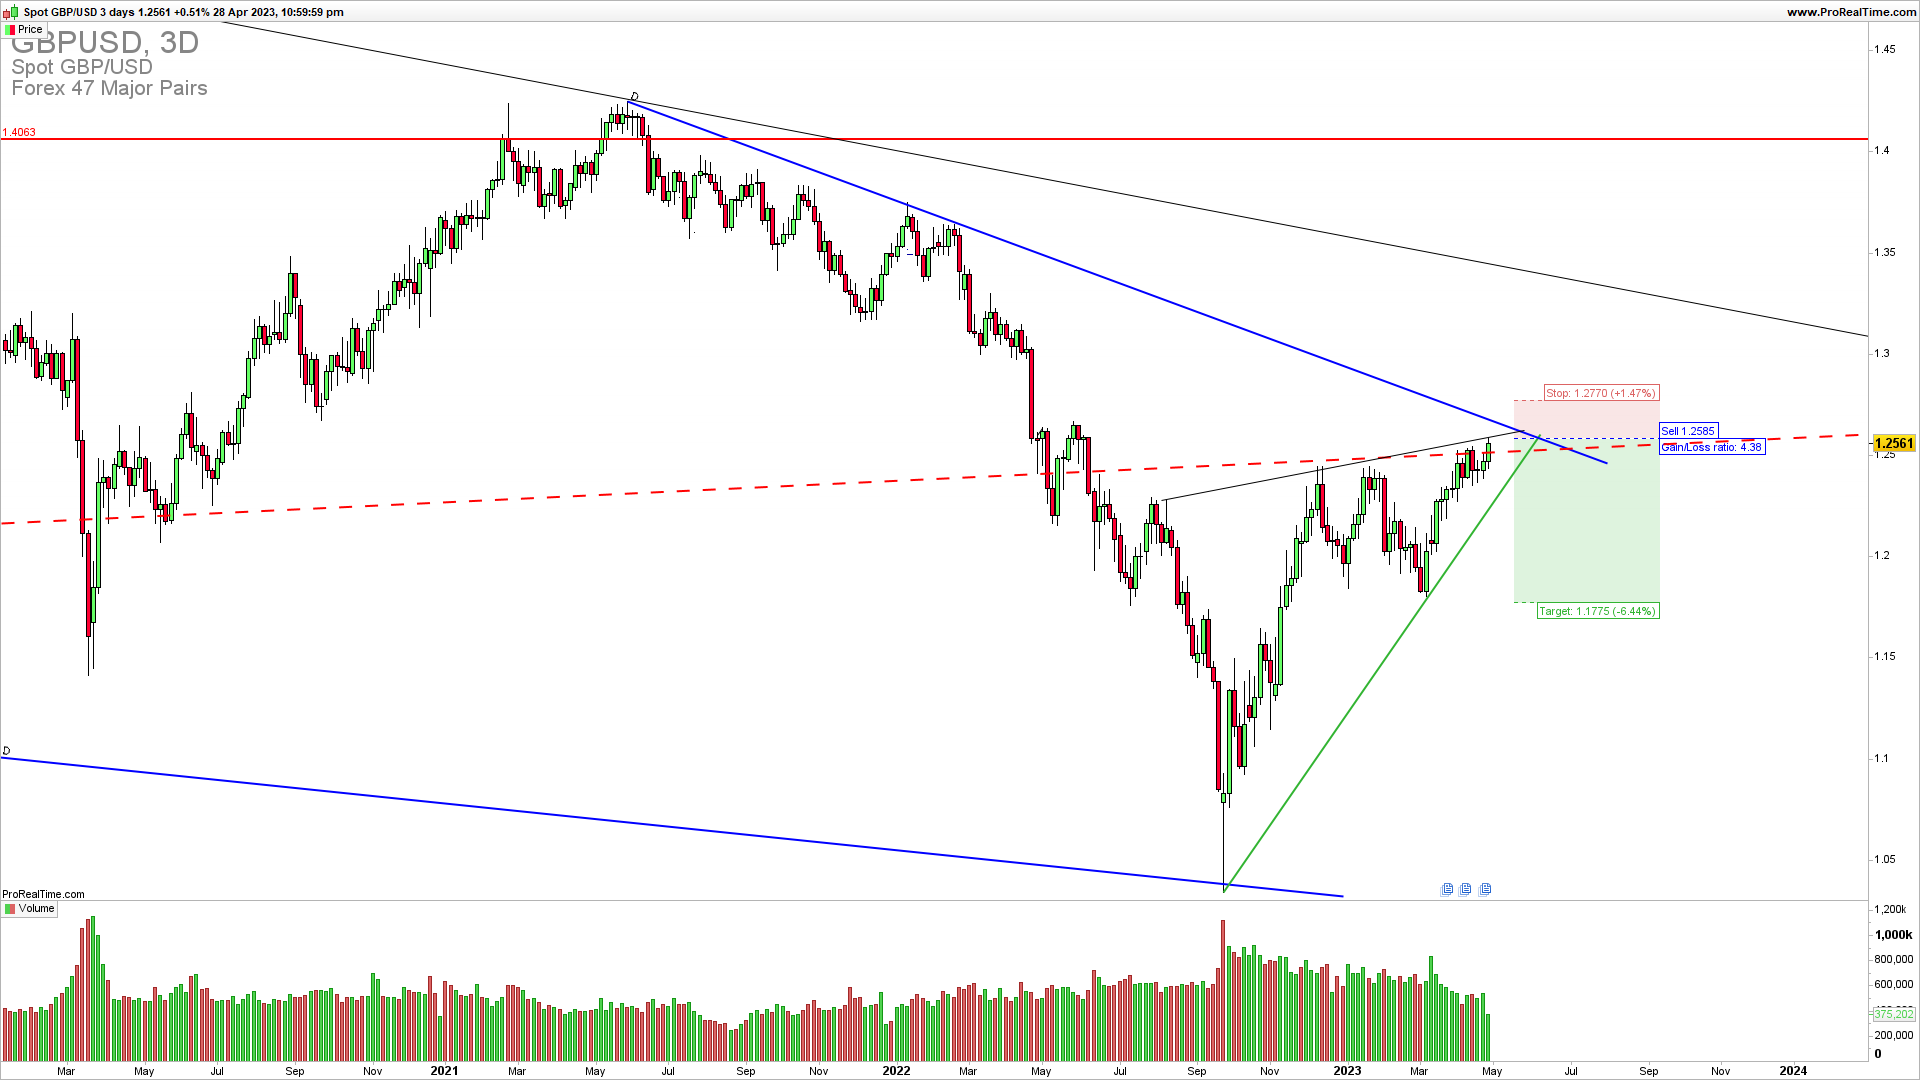
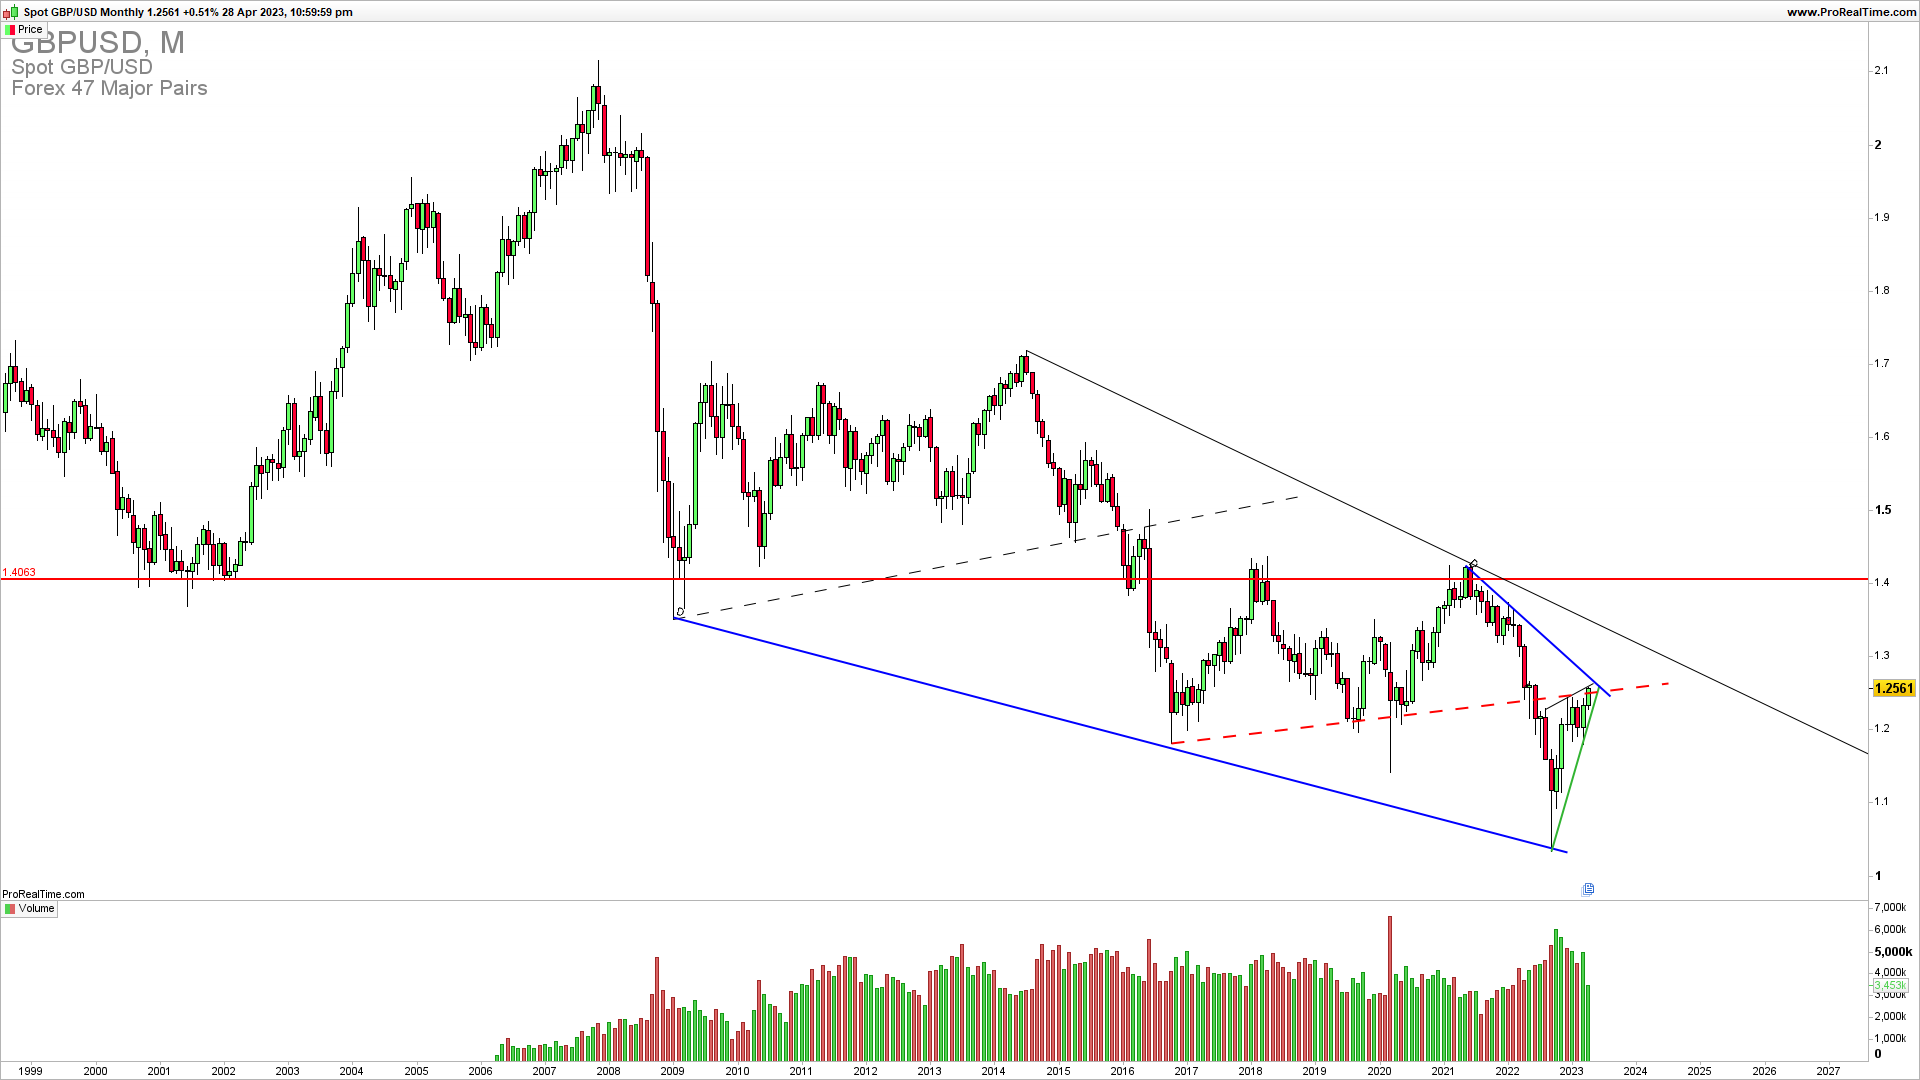
GBPUSD rallied from Sept 2022 when it reached parity to 1.2600. A confirmed break above this level is required for an upside continuation to 1.3400 which is the falling wedge resistance. A break below 1.2200 will lead to a reversal down into parity again.
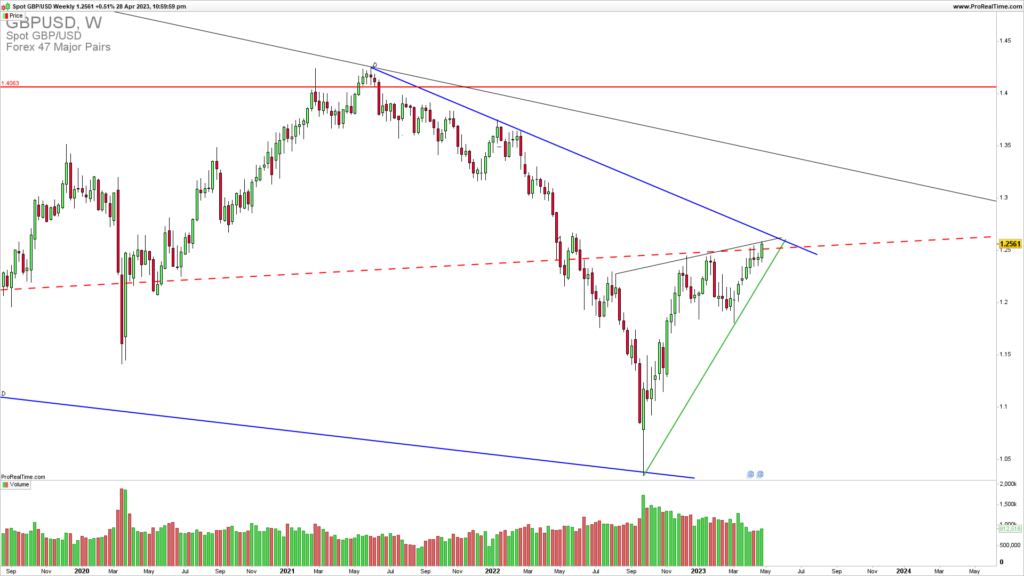
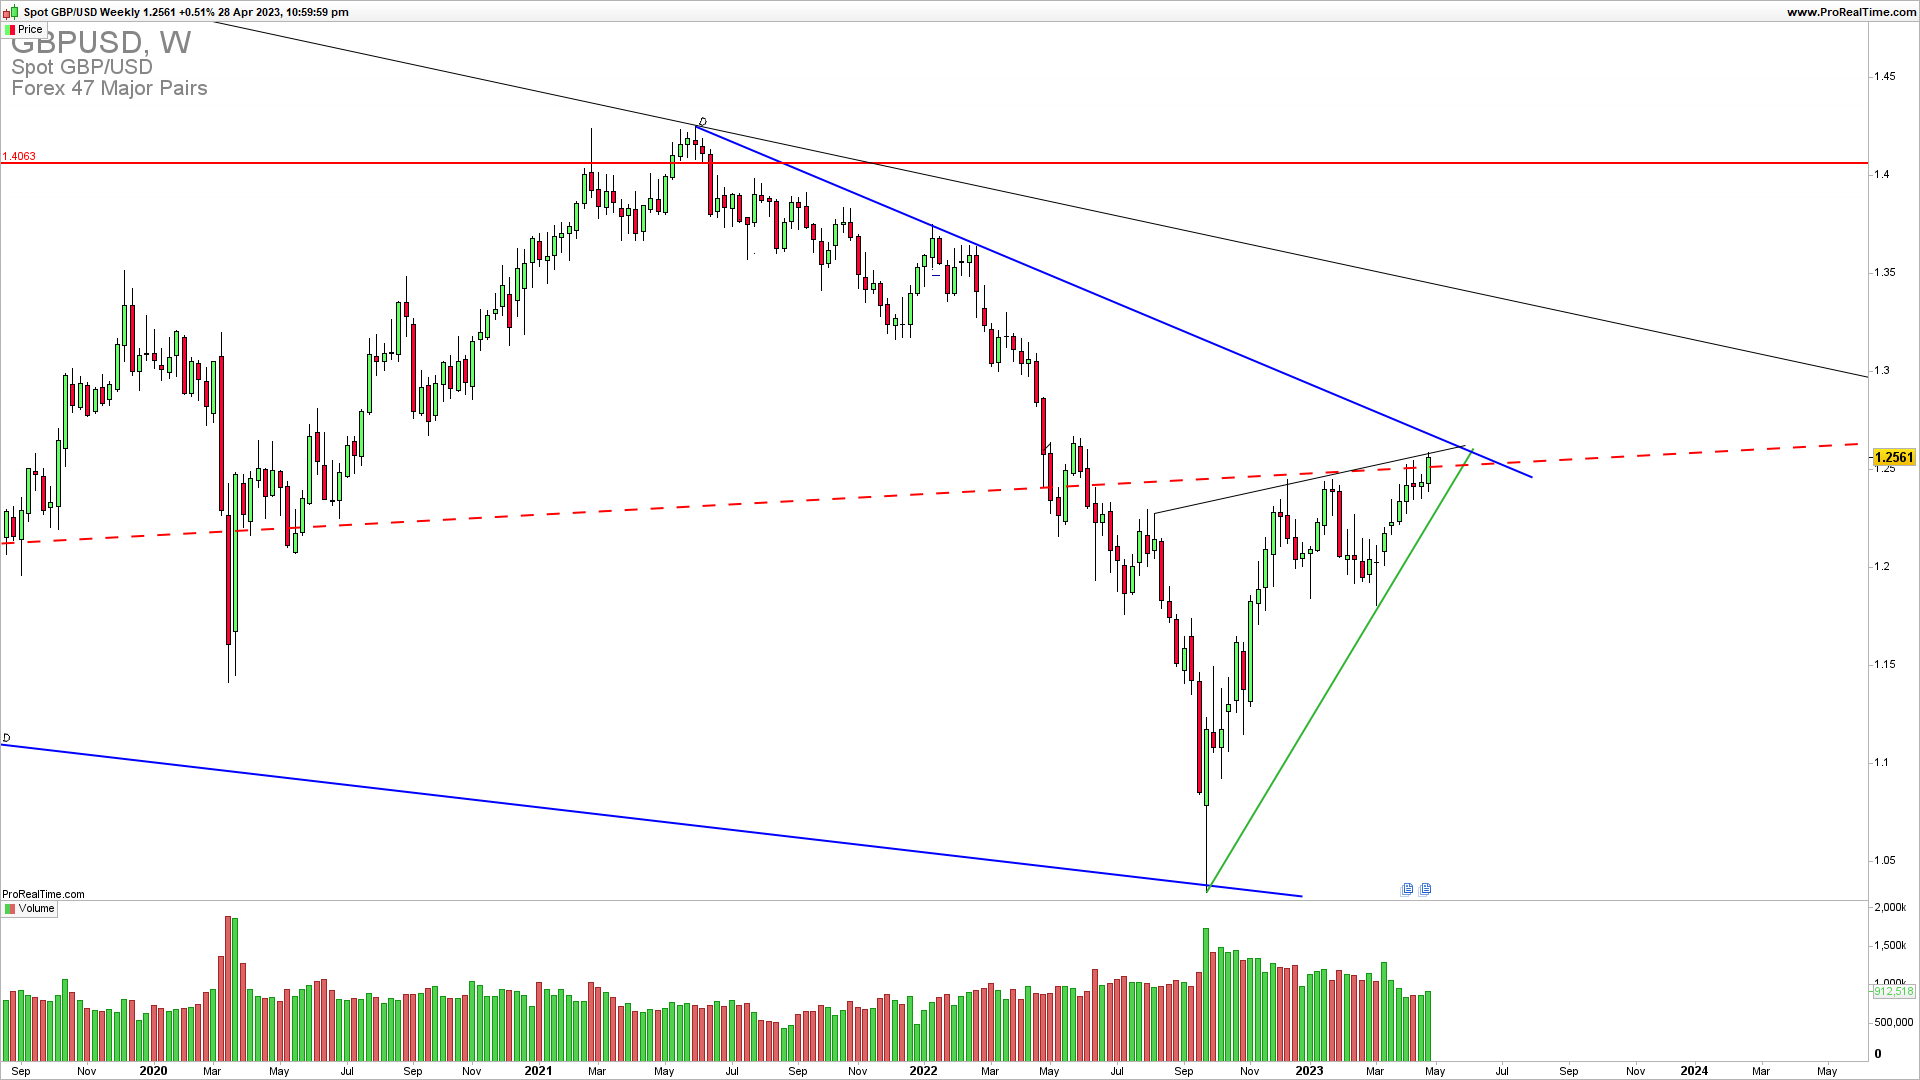
The weekly GBPUSD chart shows a rising wedge that can be defined as bearish at this stage. The lack of a significant break above 1.2700 could open the door for a downside reversal and a short trade. Now only a break above 1.2700 will invalidate the short-term downside and a break below 1.2400 is required for a nice short trade in the coming weeks.
As the famous trader says…
“Why do you think unsuccessful traders are obsessed with market analysis? They crave the sense of certainty that analysis appears to give them. Although few would admit it, the truth is that the typical trader wants to be right on every single trade. He is desperately trying to create certainty where it just doesn’t exist.”
Mark Douglas
How to trade this?
Obviously, for Q3 2023, we have this upside resistance of 1.2700 which should be broken higher for an upside continuation. This means that now short trade entries have some advantage over long trade entries as the overall long-term trend is still a downtrend. You should open a short trade here first. The risk to reward on this trade is higher than 1 and the timing of the trade could be on Monday NY session with the stop loss above 1.2740 to target the first 1.2300 and if broken 1.17500.


