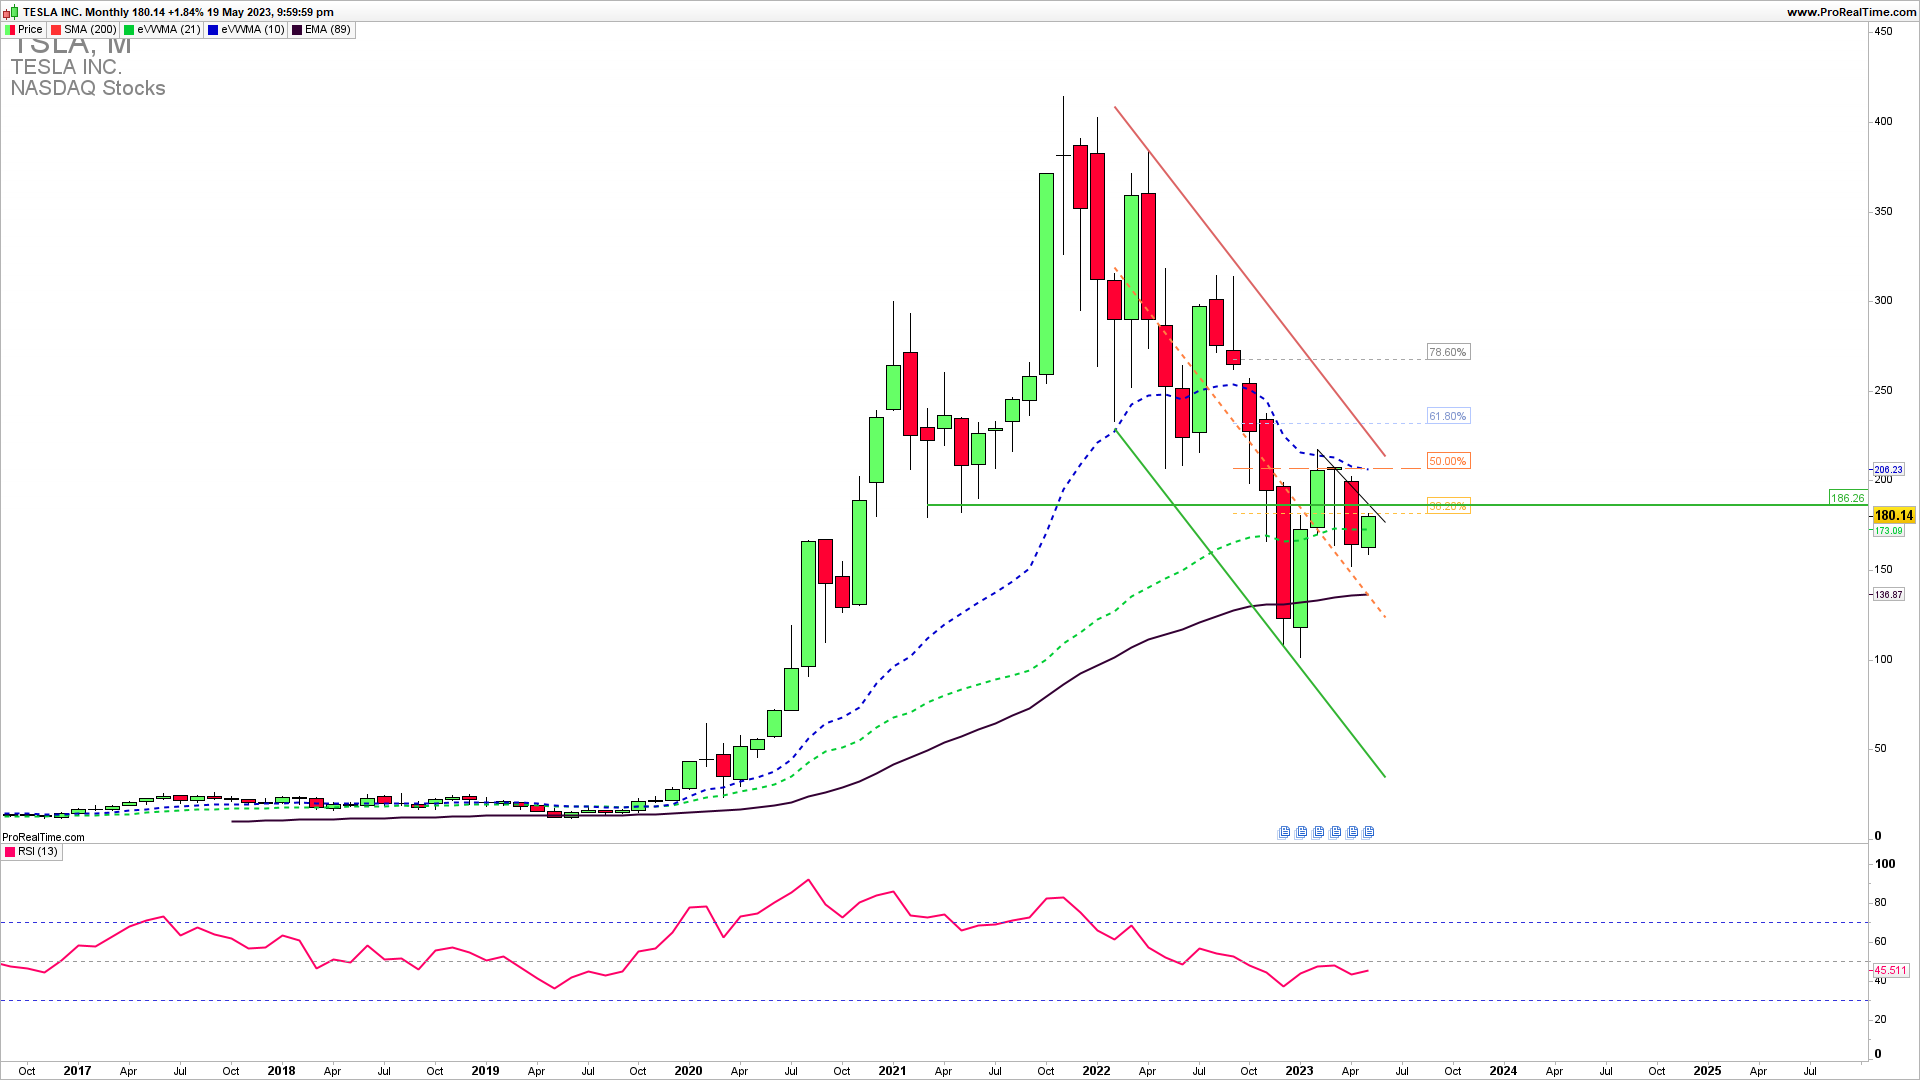
TSLA is retesting a broken strong downside resistance again. We now see a retest of a previously broken 185 downside resistance (broken twice) within a well-defined downside channel on the monthly chart. As long as the TSLA is below the 185-205 zone, we expect more downside in Q2 and Q3.
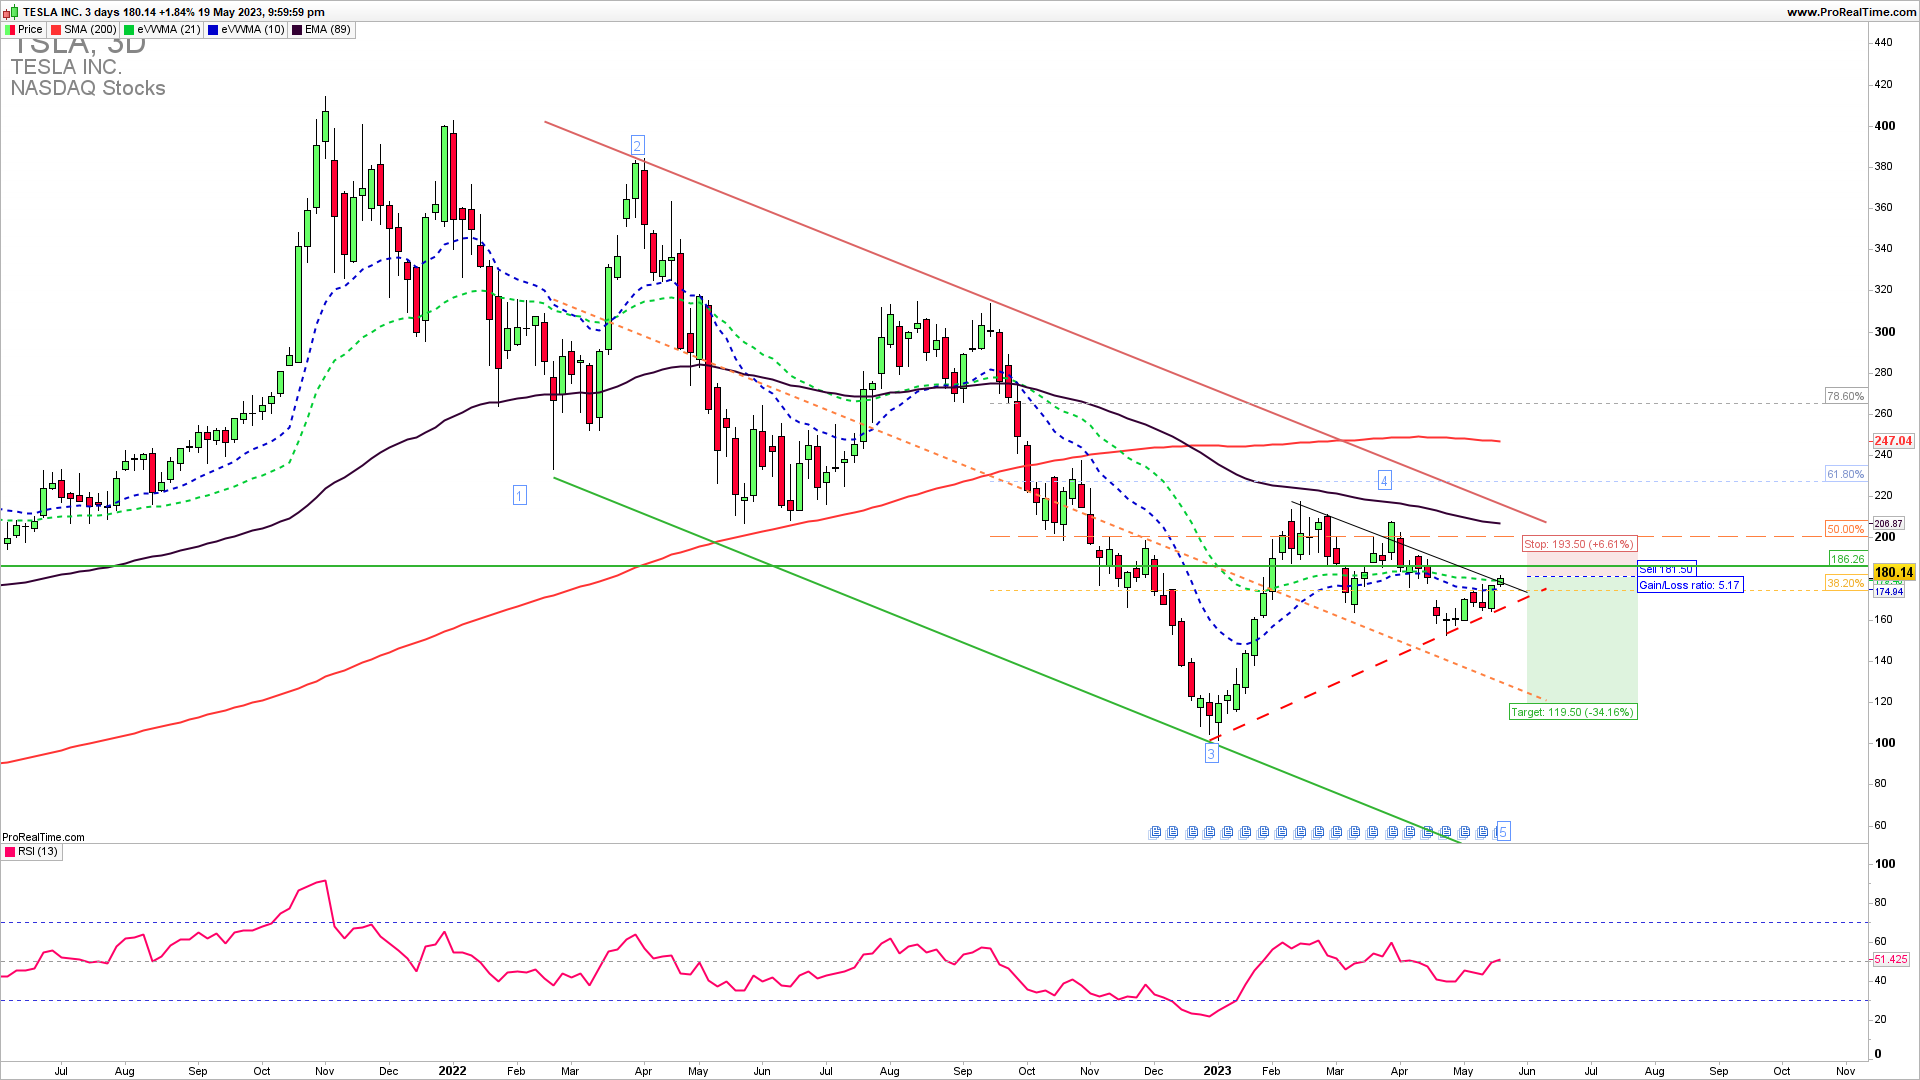
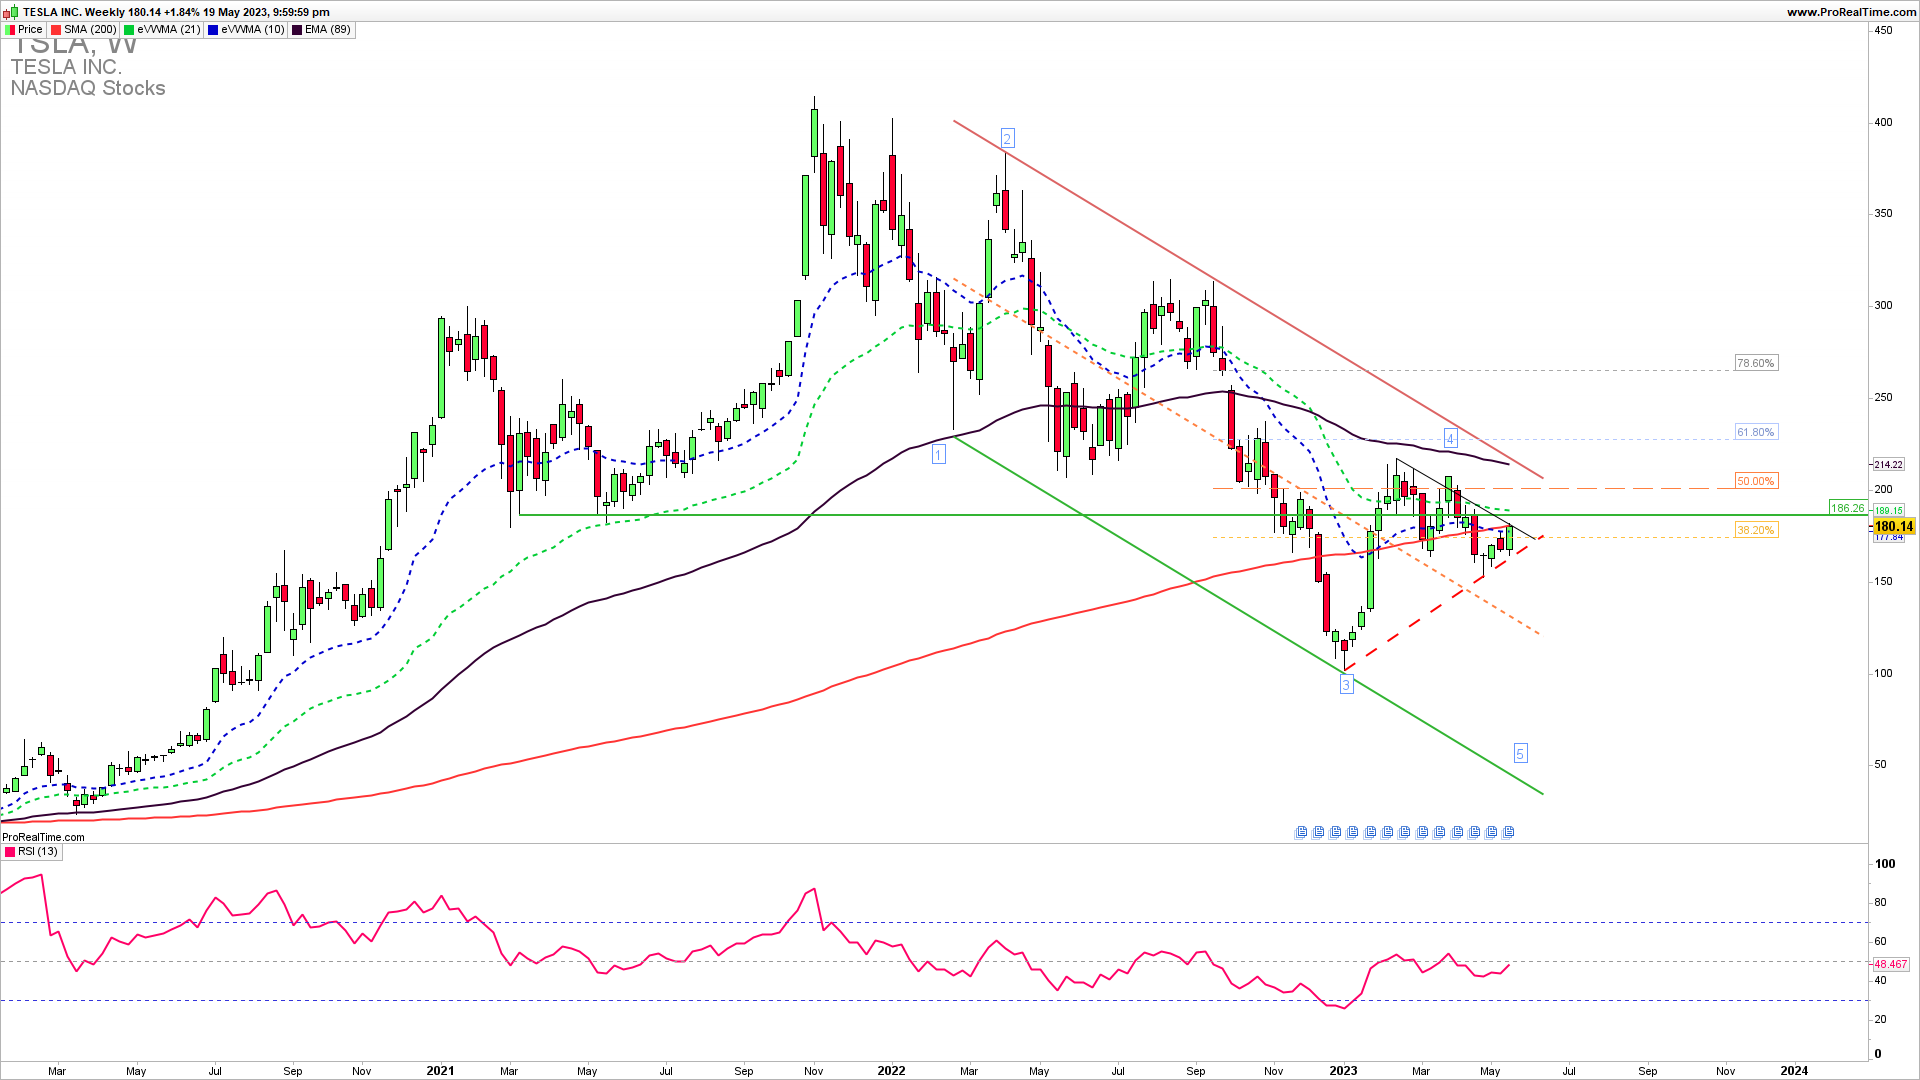
The weekly TSLA chart shows a consolidation in what is seen as a fourth wave of the unfinished downside five waves. The lack of a significant break above 185 will indicate that this fourth wave pullback is over and we can see a downside extension in the fifth wave. Only a confirmed break above 205 will invalidate the medium-term downside reversal, and a break below 162 is required for a high-probability short trade in the coming week.
As the famous trader says…
“When I get hurt in the market, I get the hell out. It doesn’t matter at all where the market is trading. I just get out, because I believe that once you’re hurt in the market, your decisions are going to be far less objective than they are when you’re doing well… If you stick around when the market is severely against you, sooner or later they are going to carry you out.”
Randy McKay
How to trade this?
Obviously, for Q2 2023, we have this upside resistance of 205 which should be broken higher for an upside continuation. This means that now short trade entries have some advantage over long trade entries as the overall long-term trend is still in a downtrend and there is a substantial upside resistance zone with an increasingly high probability of a fifth wave extension down. It would be best if you opened a short trade here first. The risk to reward on this trade is higher than 1 and the timing of the trade could be on Monday’s second hour of the NY session with the stop loss above 190 to target first 164 and if broken 100.