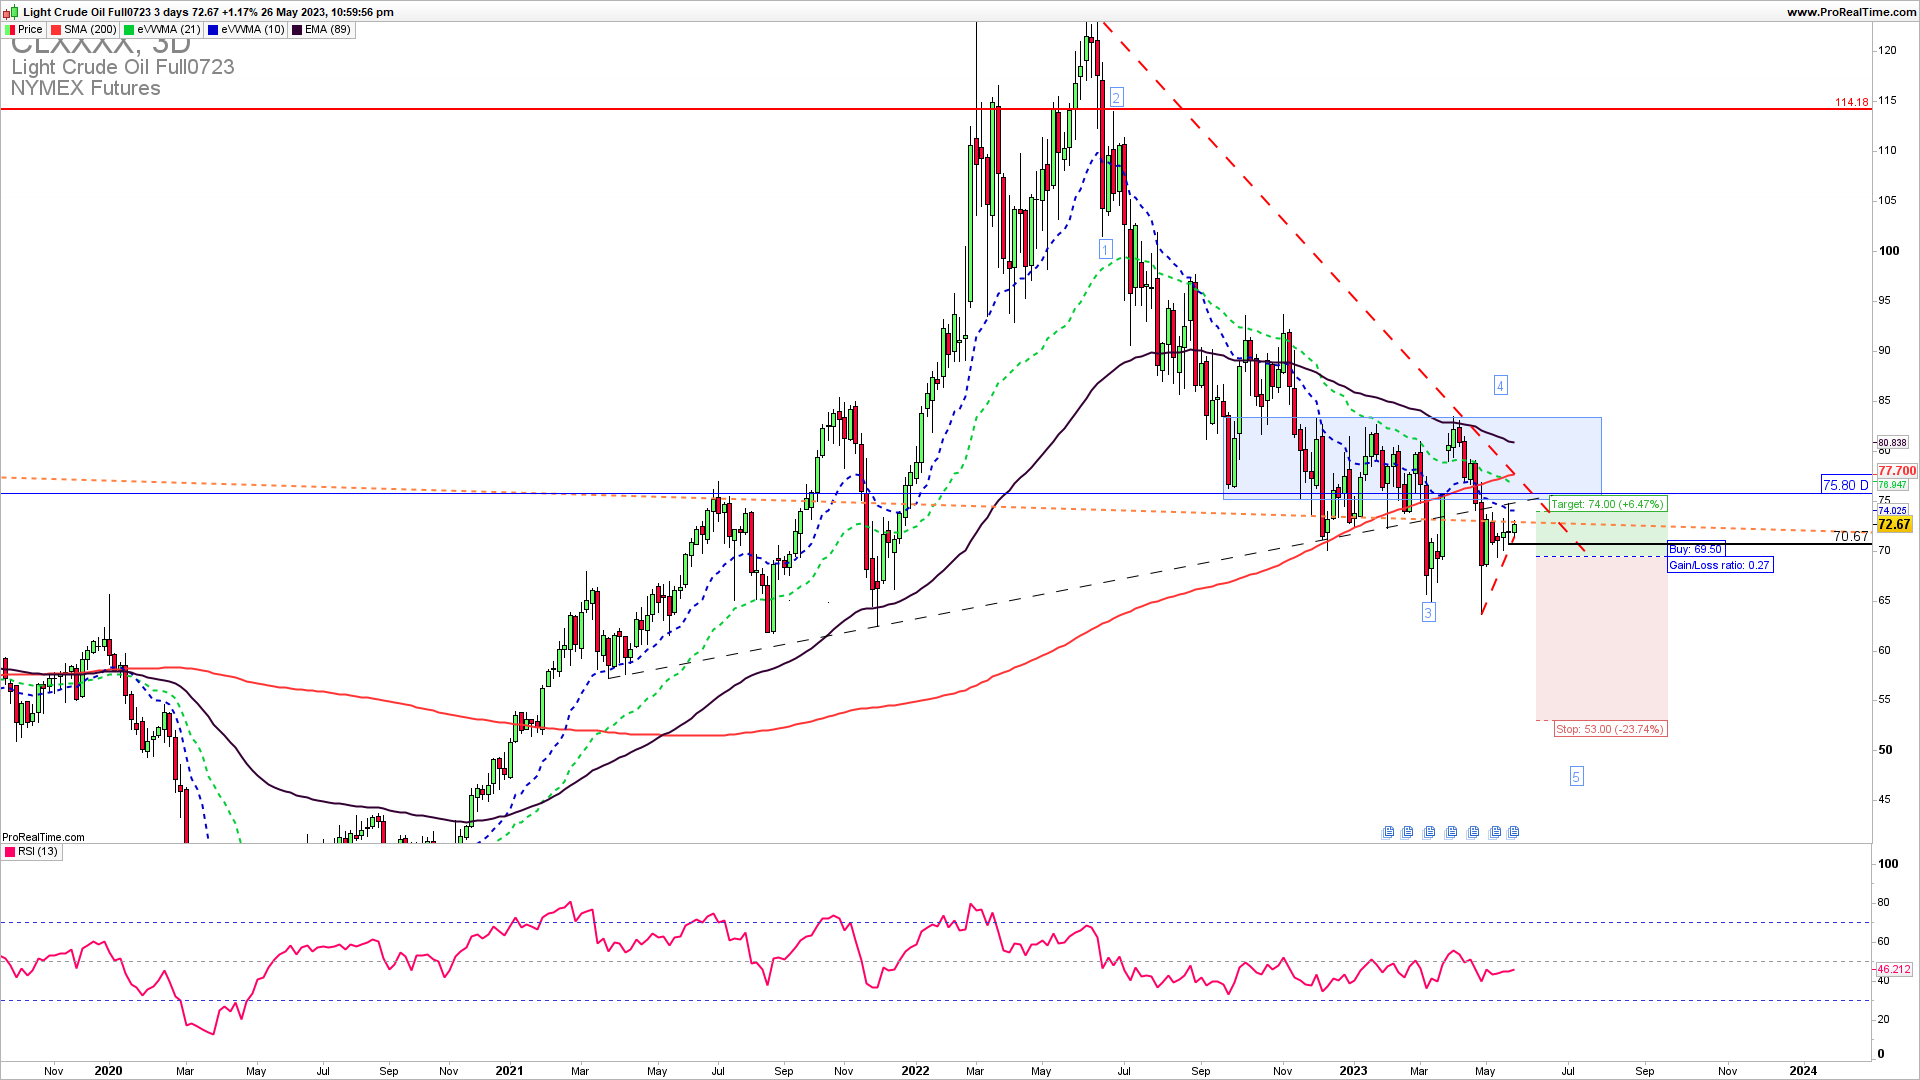
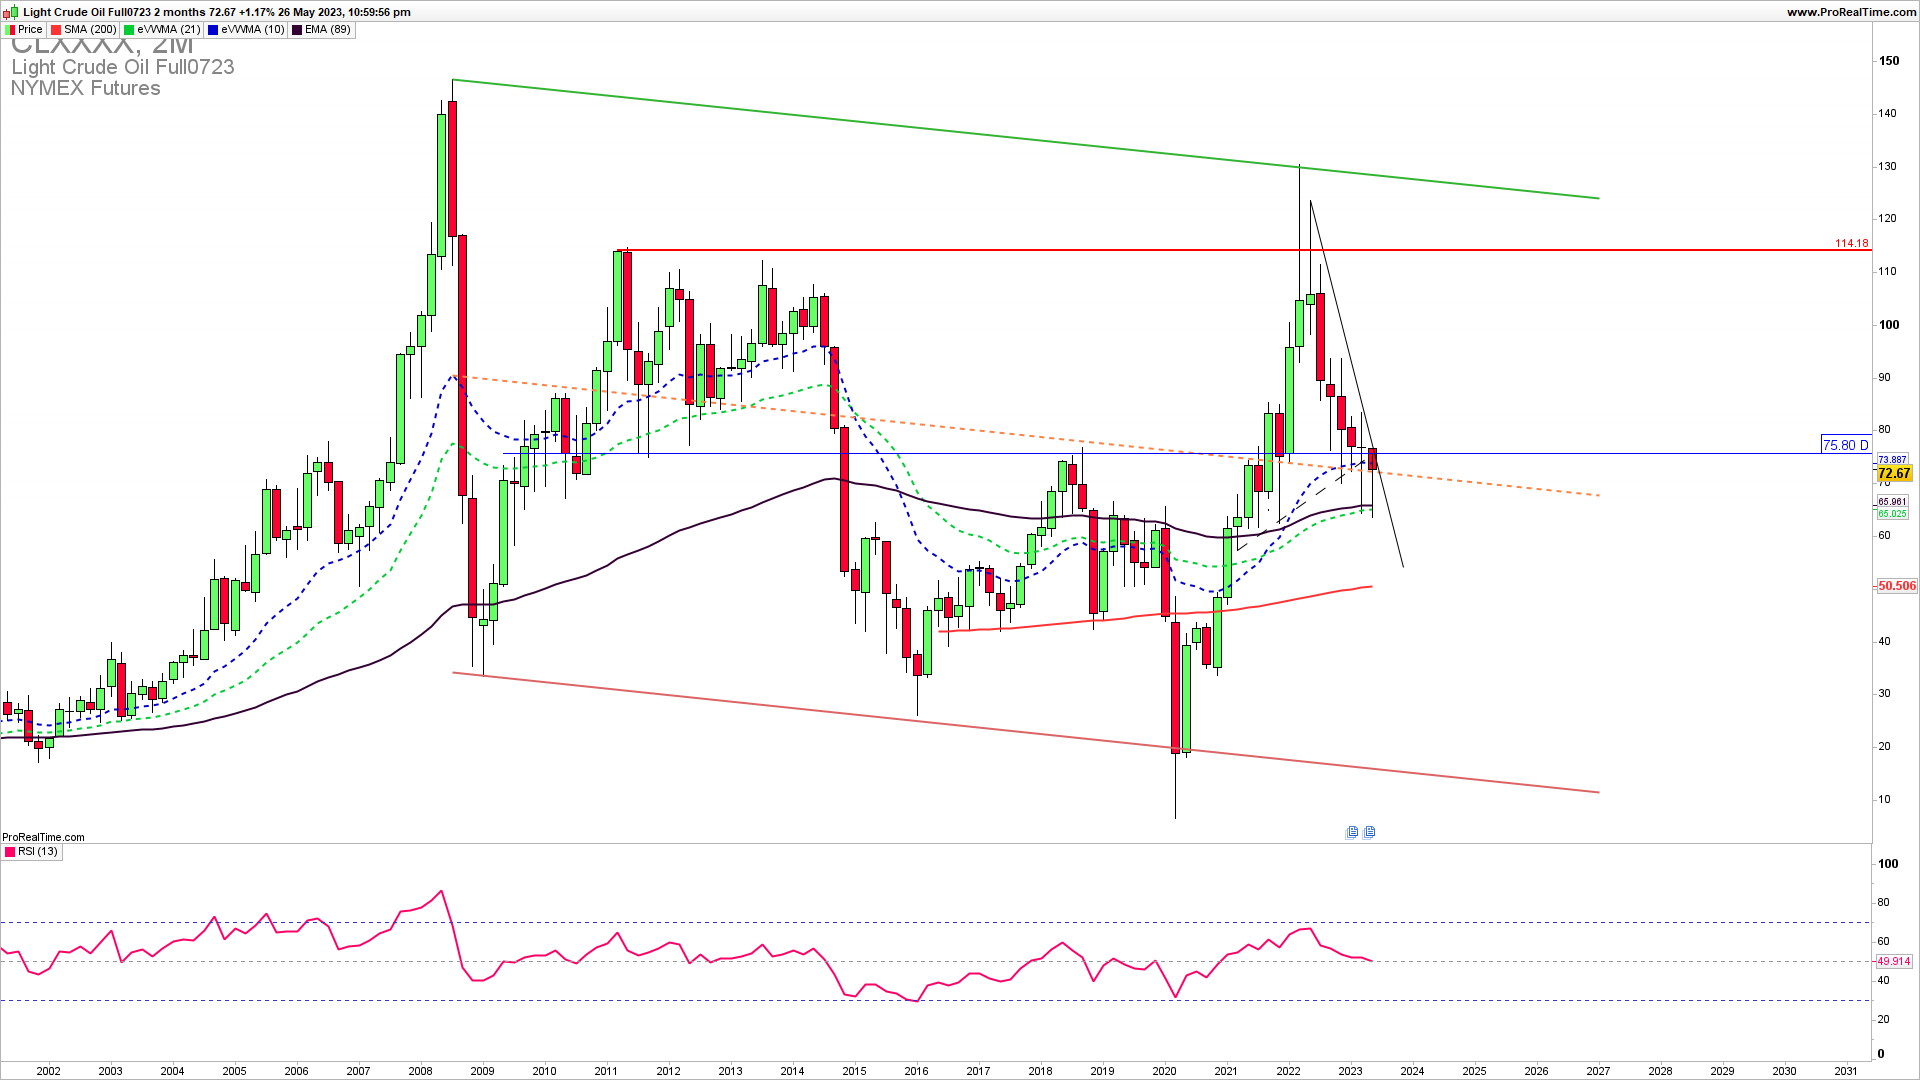
Oil broke below the long-term downside resistance 76. This downside breakout is opening the door for a further downside extension to 50. As long as the Oil is below the 78-80 zone, we expect more downside in Q2 and Q3.
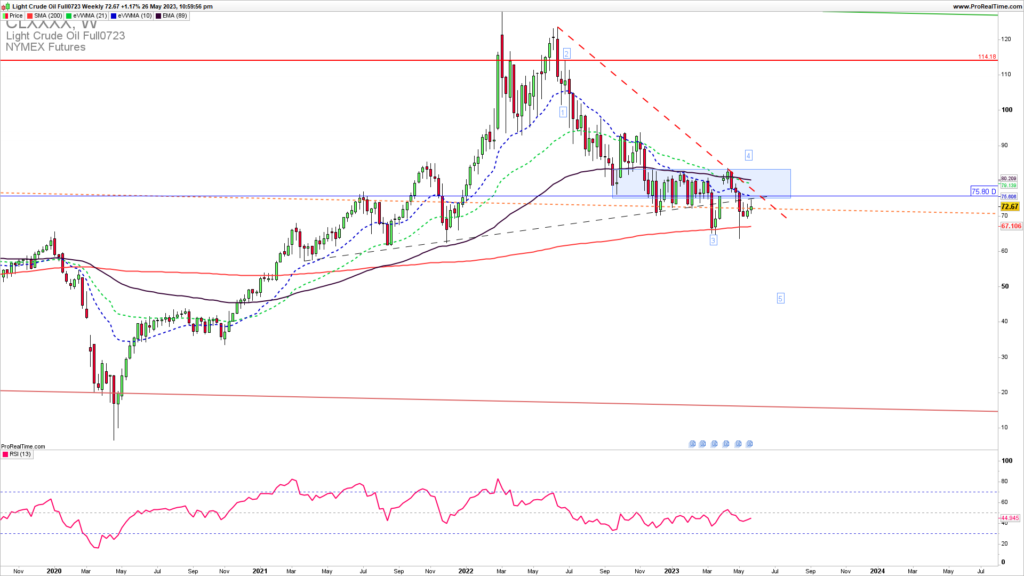
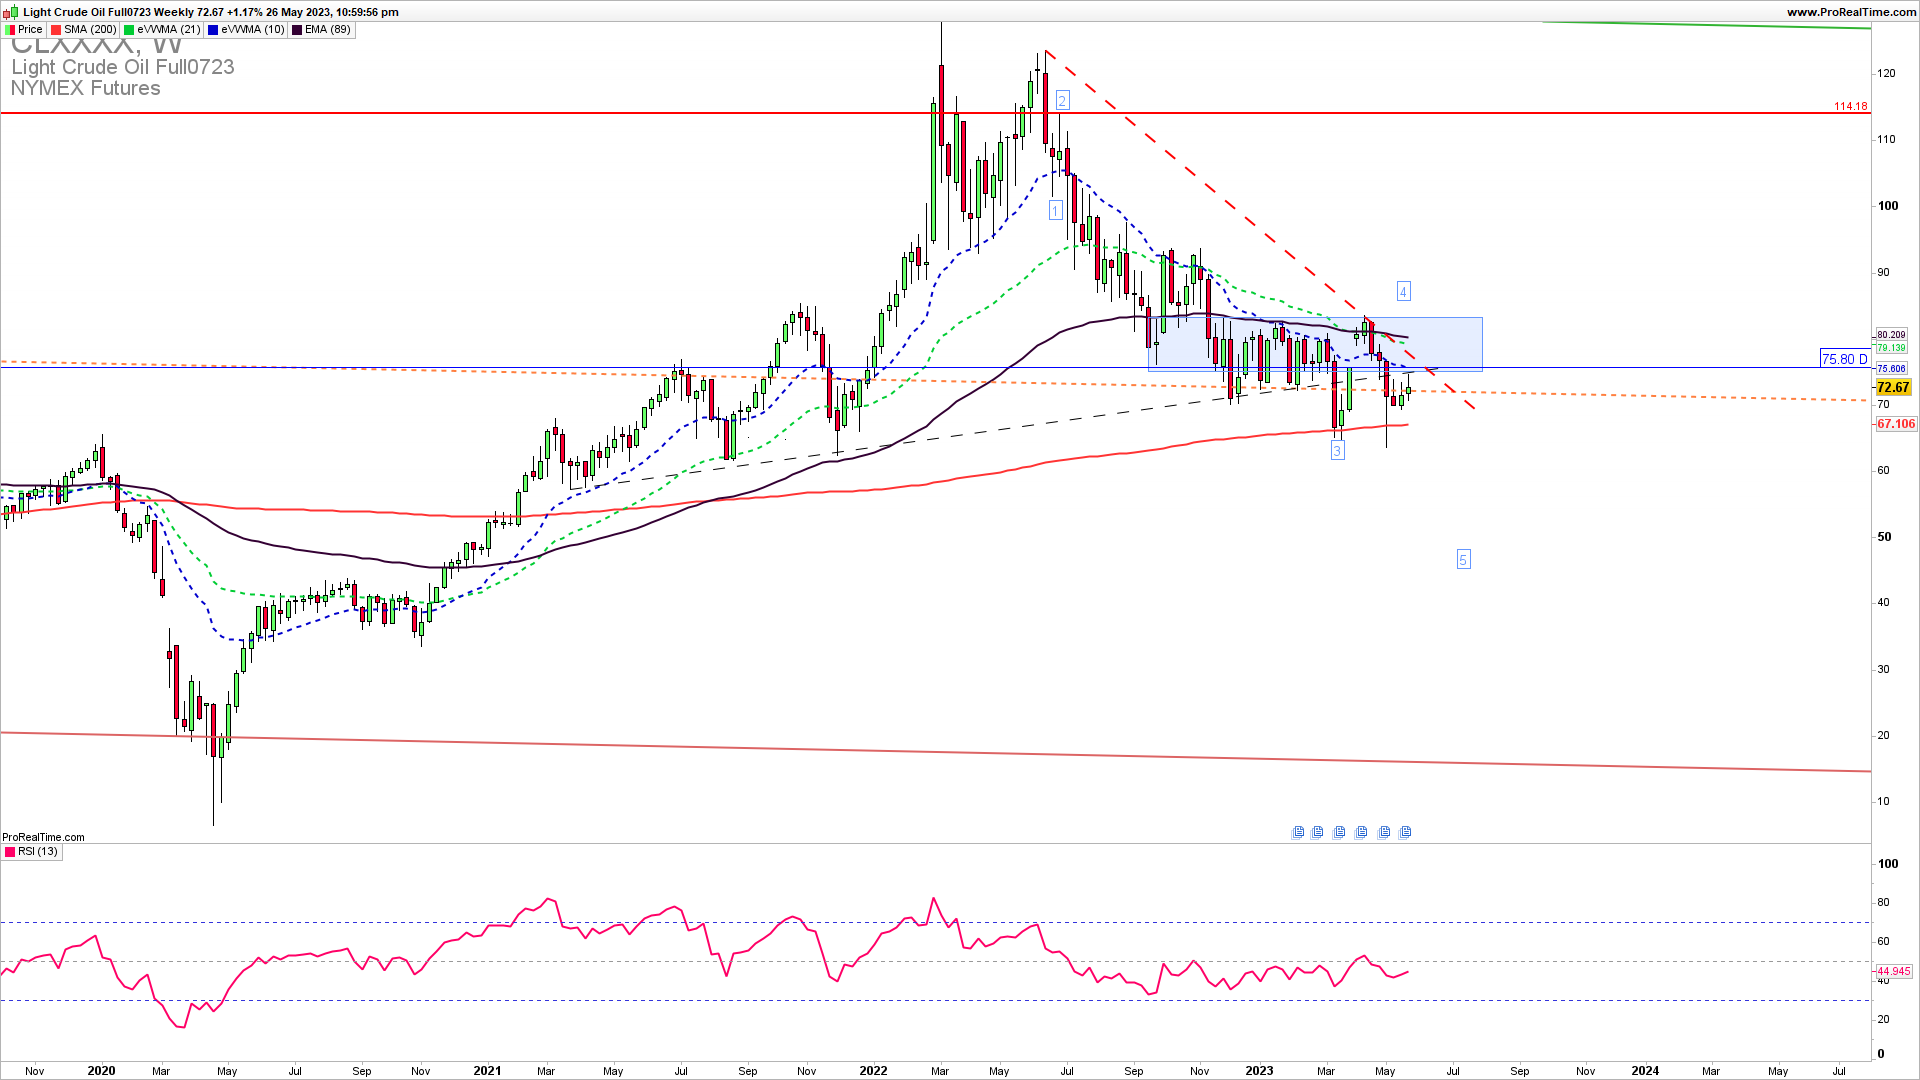
The Weekly Oil chart shows a consolidation in what is seen as a fourth wave of the unfinished downside five waves. The lack of a significant break above 76 indicates that this fourth wave pullback is over and we can see a downside extension in the fifth wave. Only a confirmed break above 78 will invalidate the medium-term downside reversal, and a break below 70 is required for a high-probability short trade in the coming week.
As the famous trader says…
“Do more of what works and less of what doesn’t.“
Steve Clark
How to trade this?
Obviously, for Q2 2023, we have this upside resistance of 78 which should be broken higher for an upside continuation. This means that now short trade entries have some advantage over long trade entries as the overall long-term trend is still in a downtrend and there is a substantial upside resistance zone with an increasingly high probability of a fifth wave extension down. It would be best if you opened a short trade here first. The risk to reward on this trade is higher than 1 and the timing of the trade could be on Monday or Tuesday of the NY session upon a break below 70.50 with the stop loss above 73 to target first 60 and if broken 50.