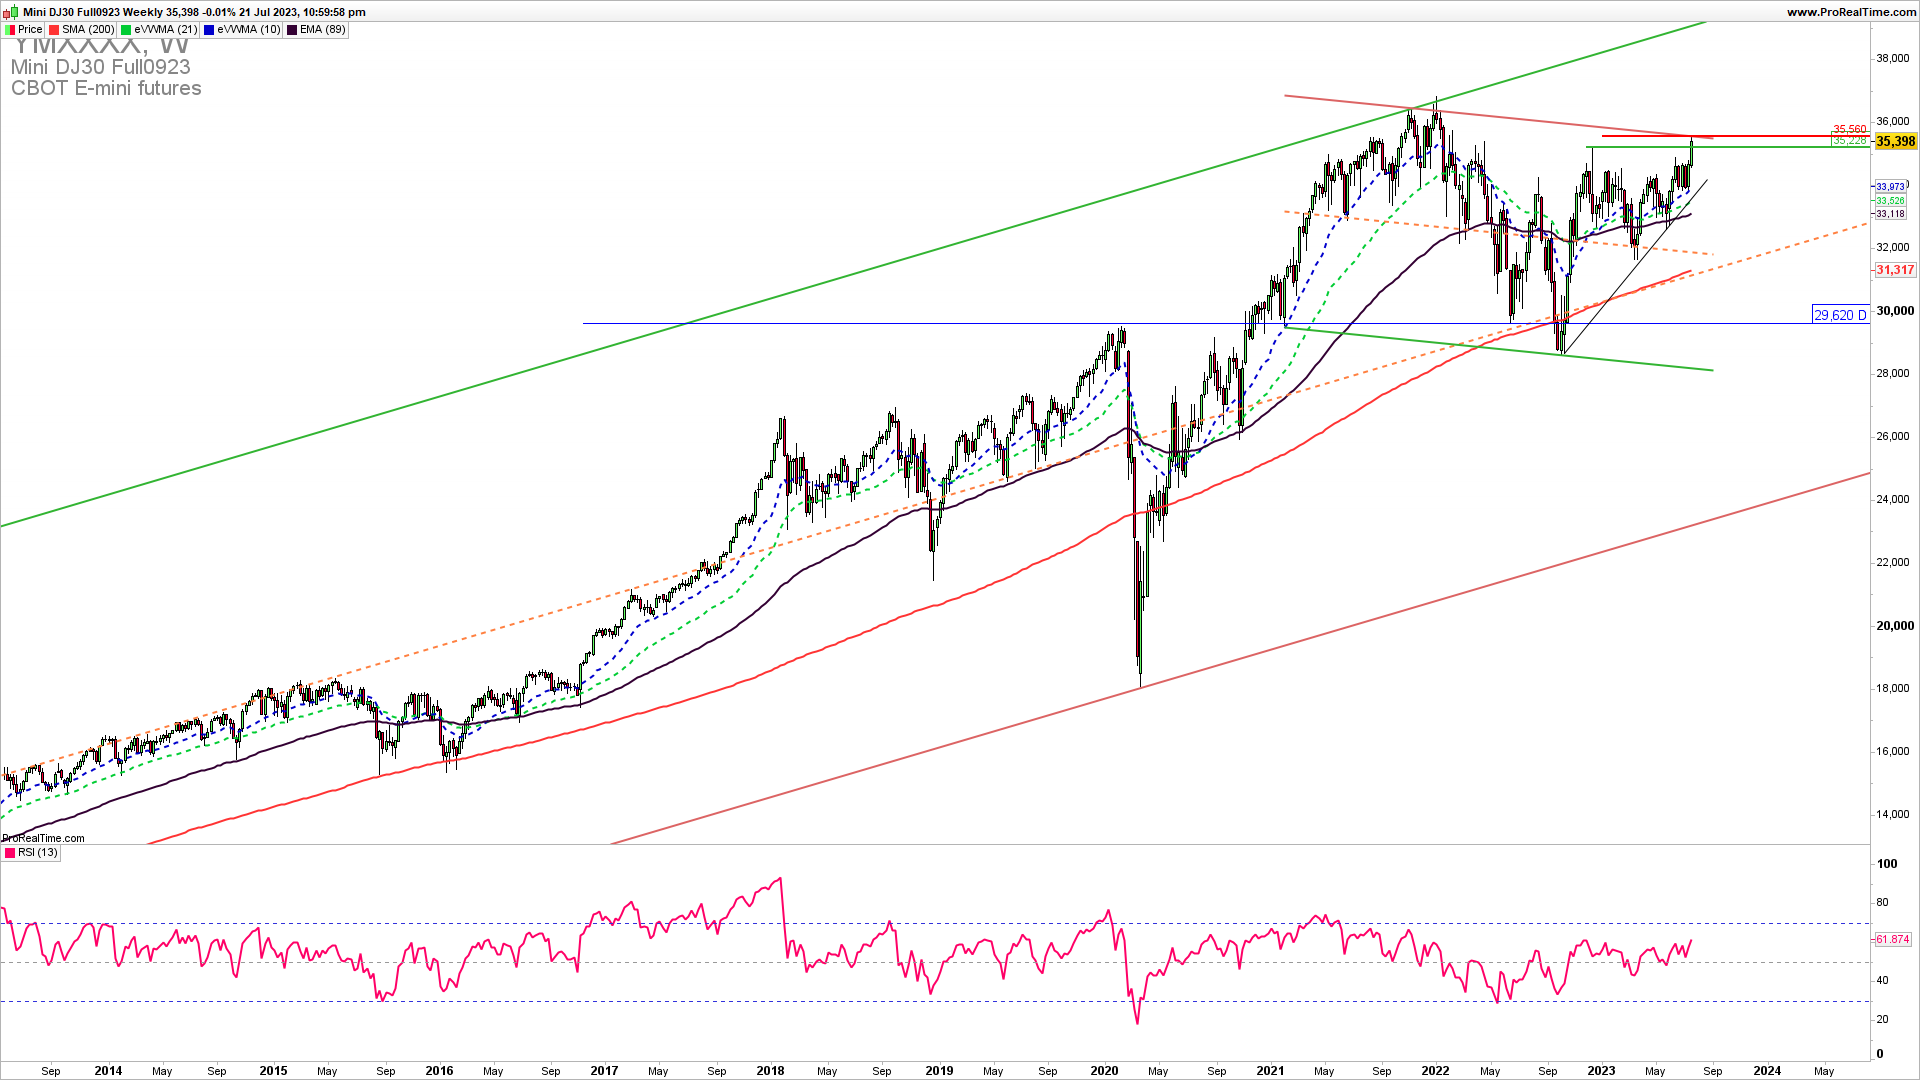
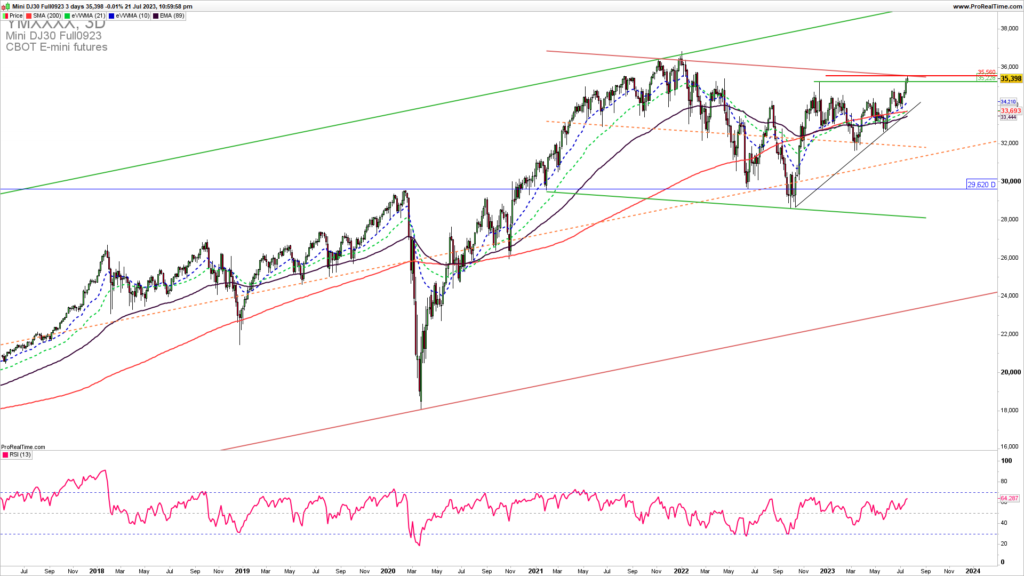
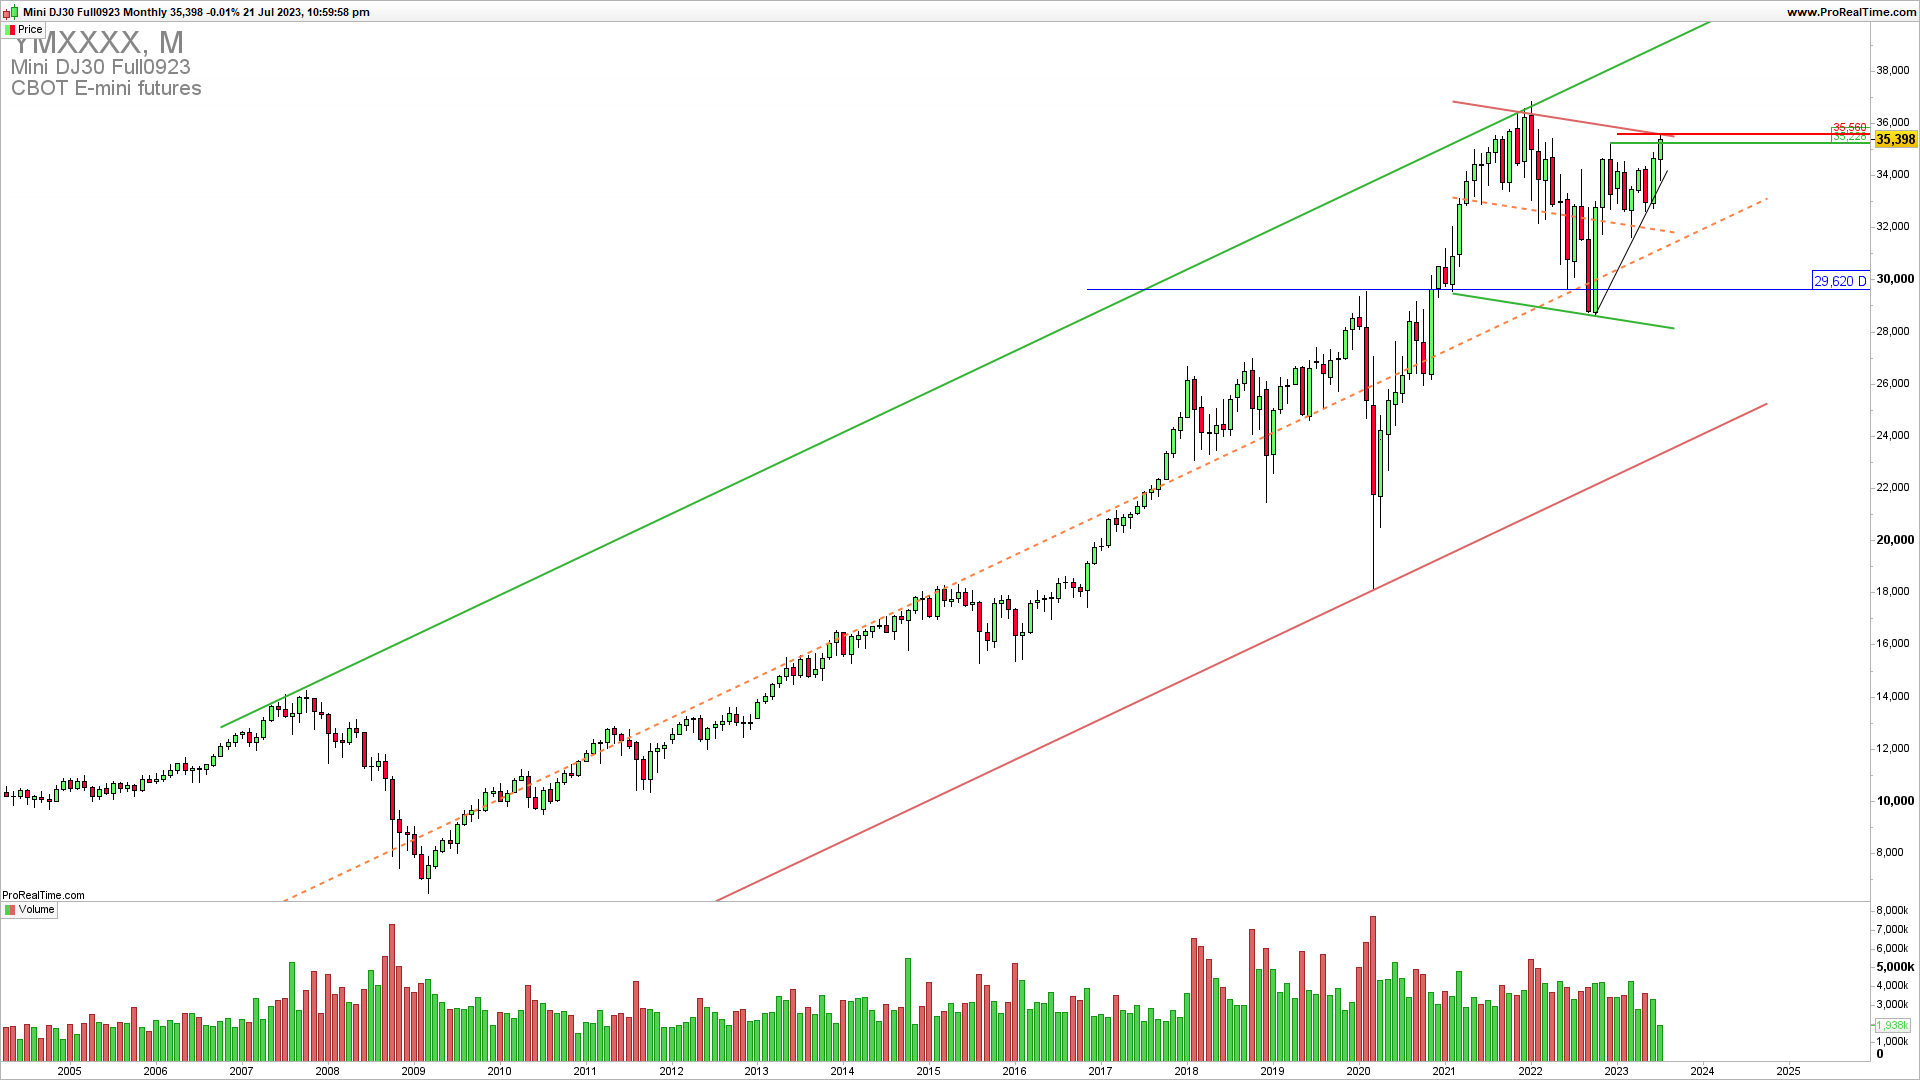
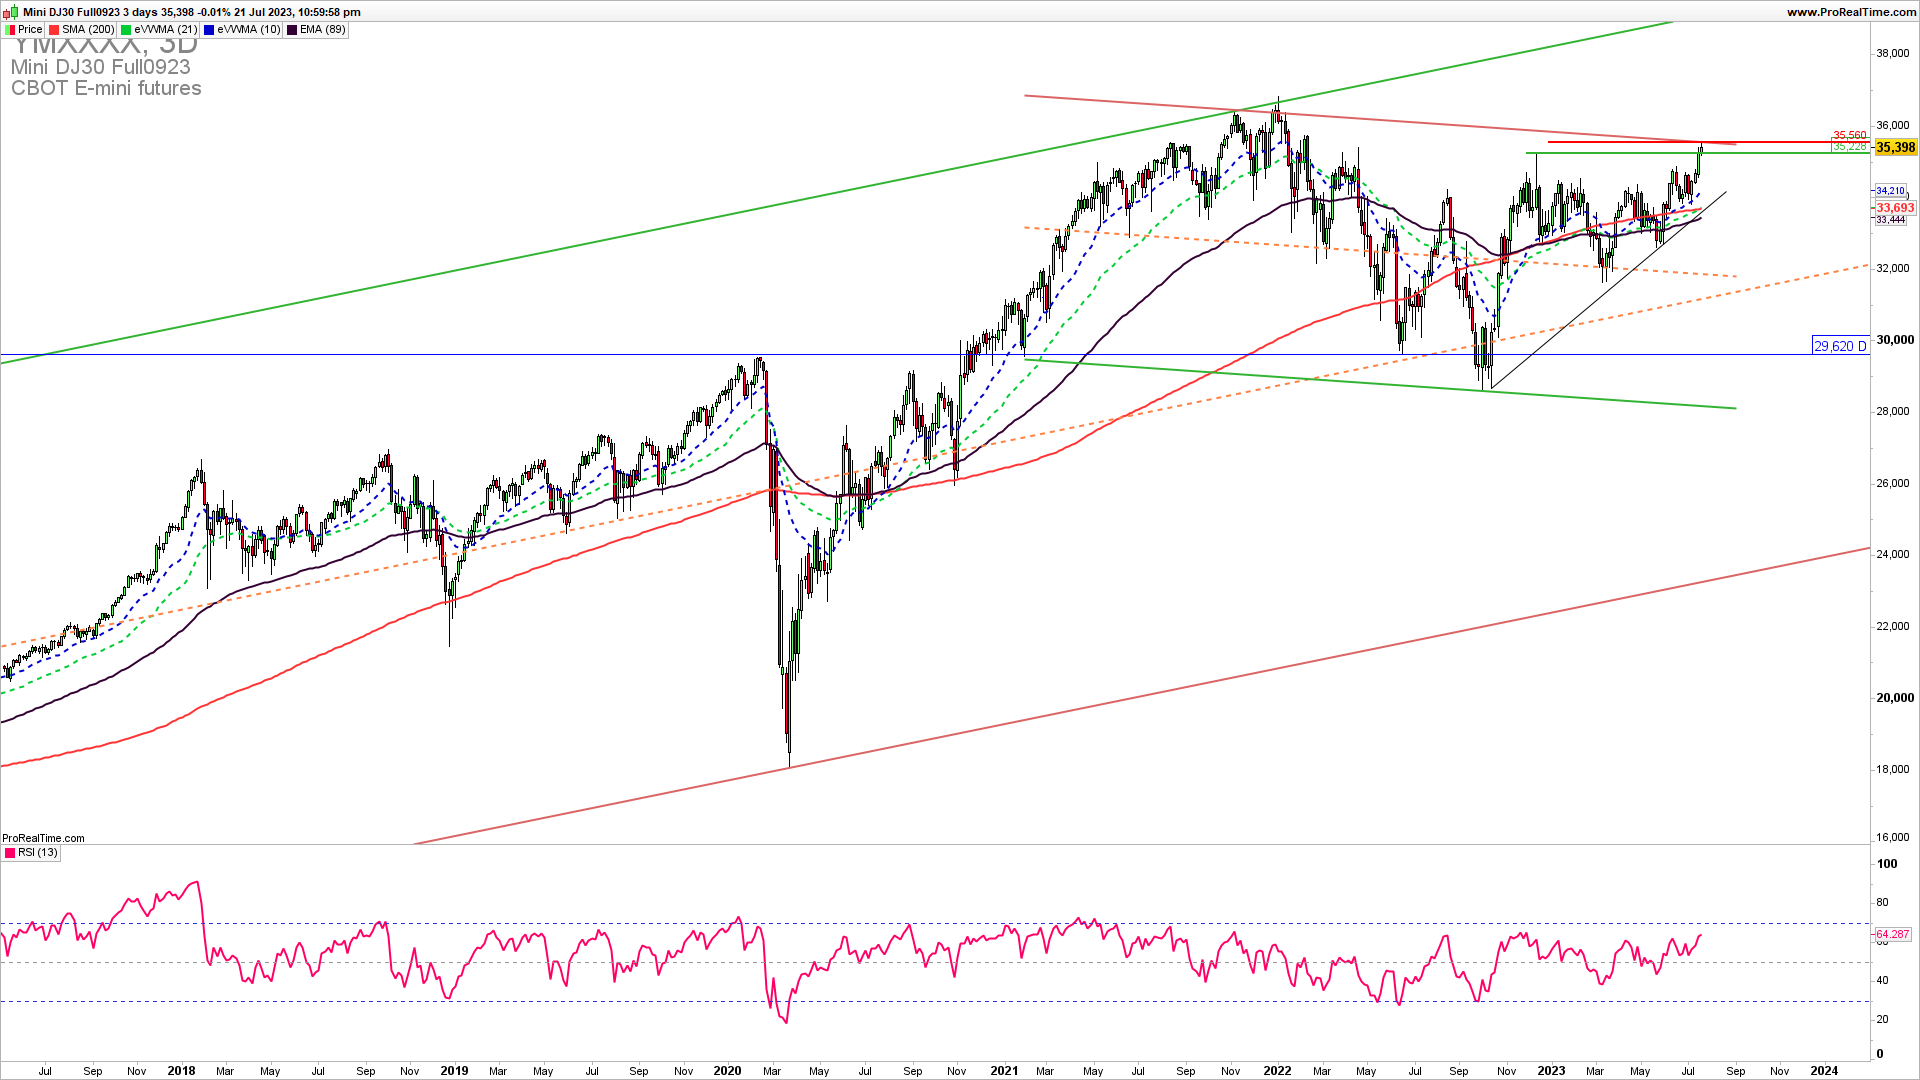
The monthly chart shows that DJIA is reaching a critical confluence of resistance level 35500, a combination of the sideways channel upside resistance. This confluence of upside resistance is coming after ten months of the upside without a significant pullback. A break above this level exposes 38000 and even higher to the uptrend channel resistance.
OPTIONS TRADING INTENSIVE COURSE INTRO PRICE 30% OFF
The Weekly DJIA chart reveals a possible bullish flag with a horizontal resistance of 35560. A break above is required for the upside continuation and extension higher to 38000. A rejection here will lead to a swing lower for a downside resistance test of 33500. Price action is showing a significant strength and we could see either a fake break or a clear break to the upside.

GET THE CHART OF THE DAY EVERY DAY IN YOUR INBOX
As the famous trader says…
” The key to trading success is emotional discipline. If intelligence were the key, there would be a lot more people making money trading… I know this will sound like a cliche, but the single most important reason that people lose money in the financial markets is that they don’t cut their losses short.”Victor Sperandeo
How to trade this?
It is a fact that a strong upside resistance for Q3 is 35600 and we are seeing a test of it. As long as this resistance is holding in the coming weeks we could see a reversal lower to test at least 33500. A break below this level would mean a complete turnaround and a break below the rising wedge line. Near-term long-trade entries have a lower probability of success until we see a clear break above the resistance. There is a possibility of a long trade and a short trade here. The long trade we can open upon a clear break above 35600 and the short trade if we get a rejection here. This is an extremely important level for the market and we are seeing now a test of it. Be careful with the entries.


