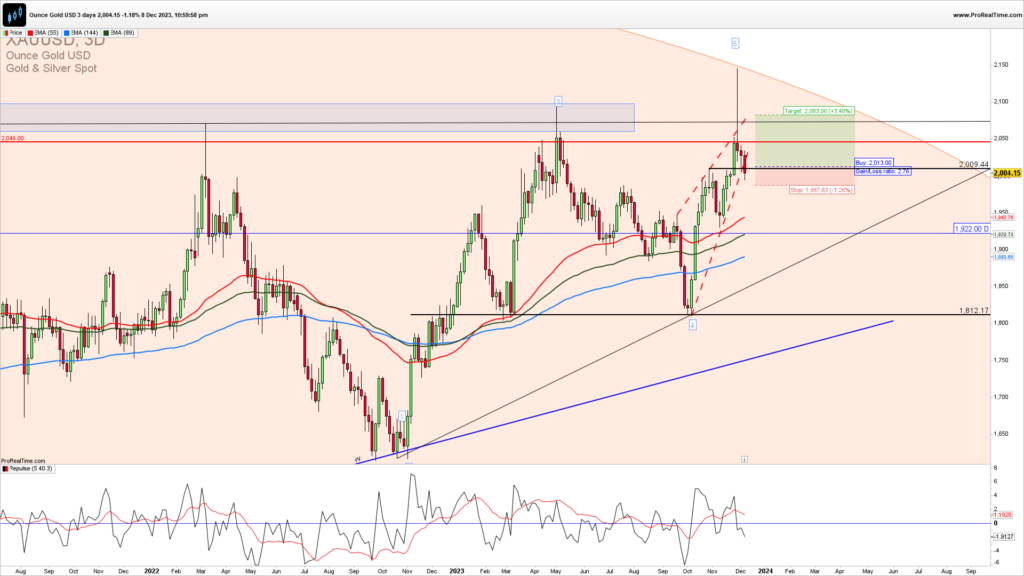
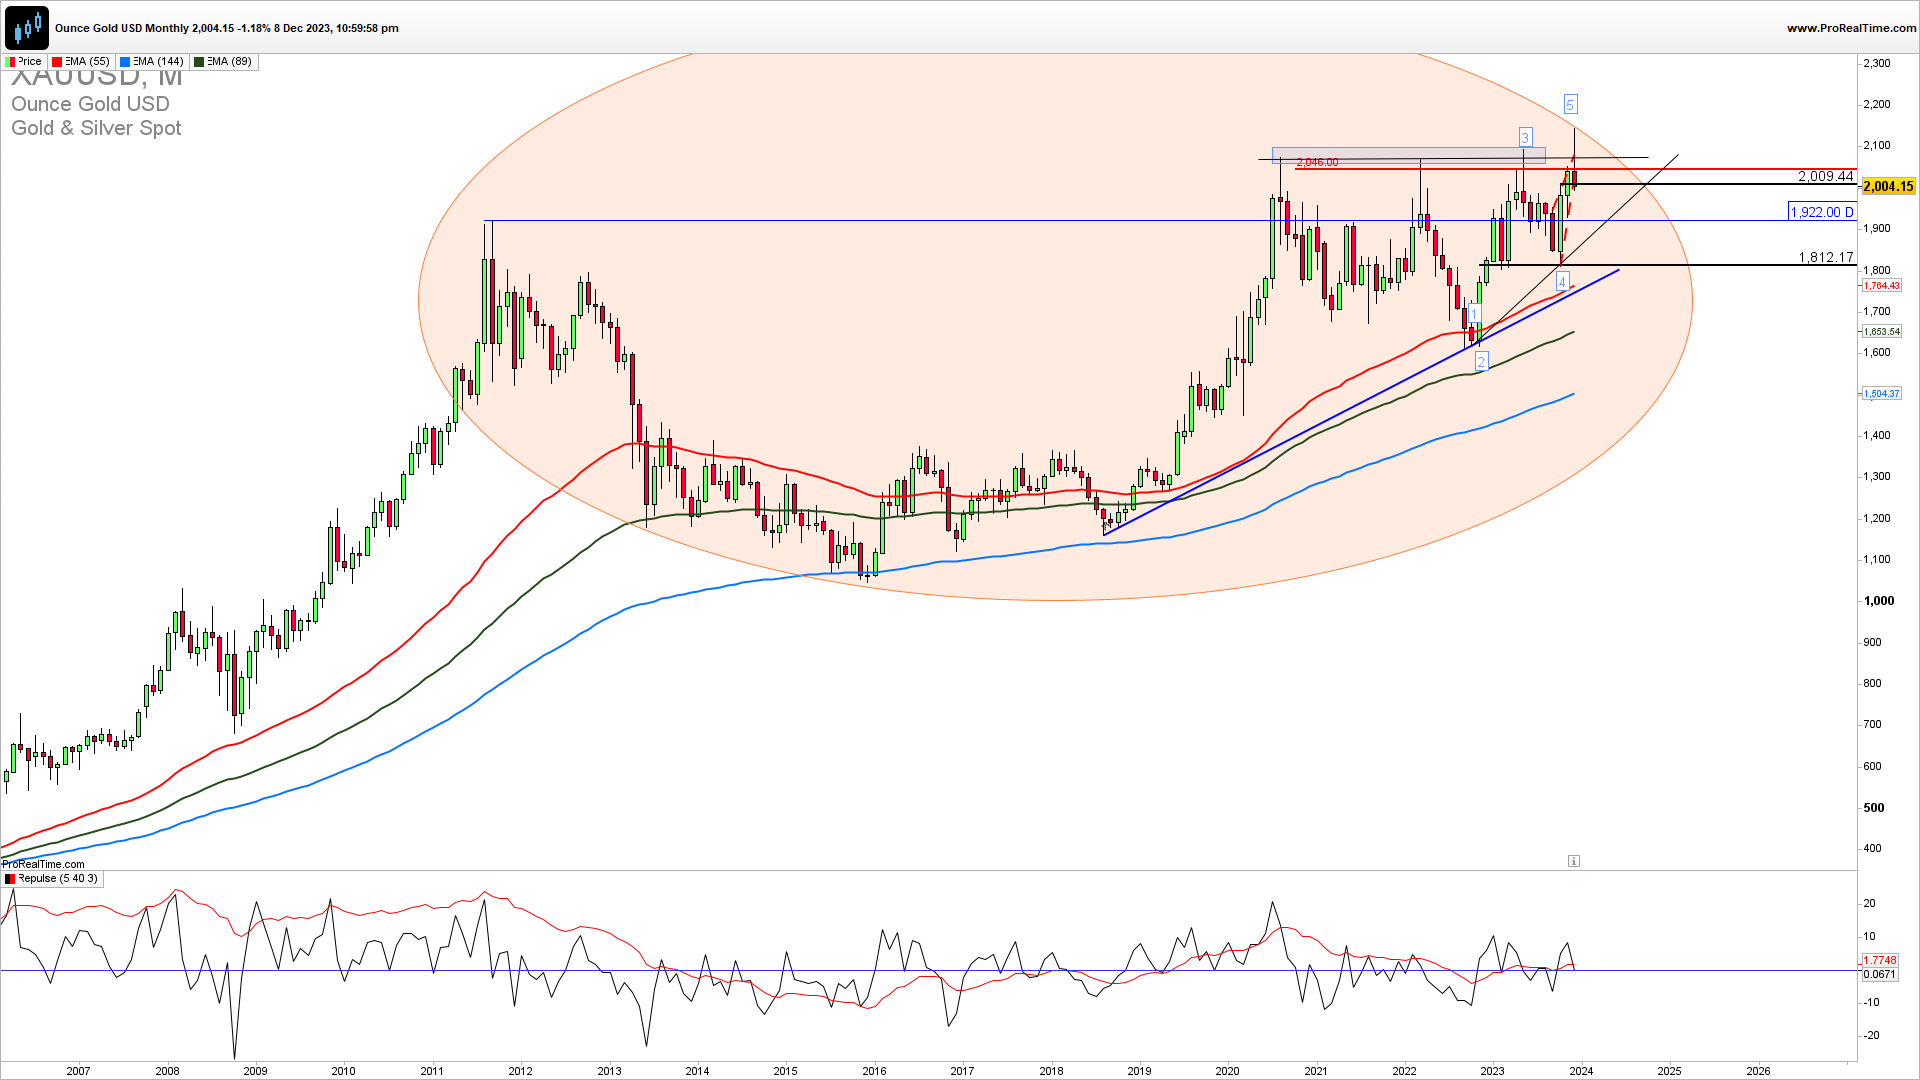
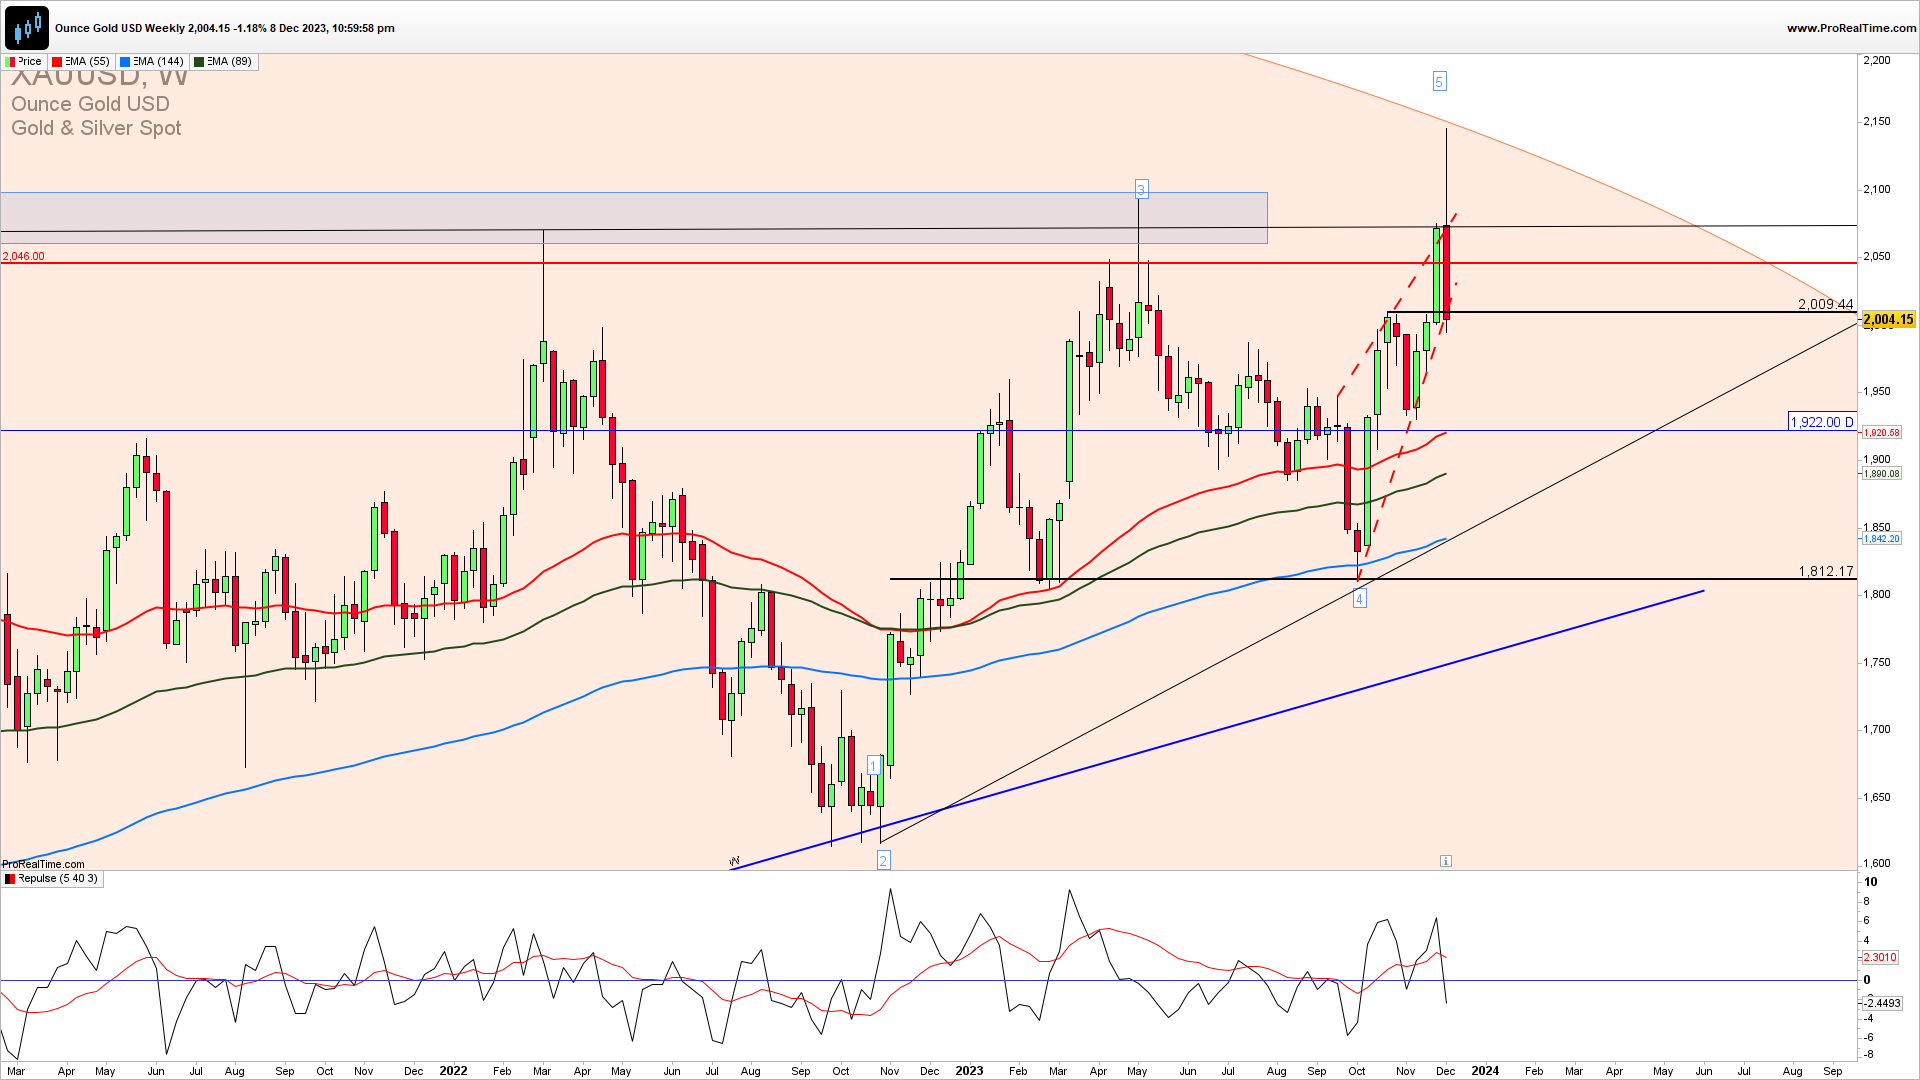
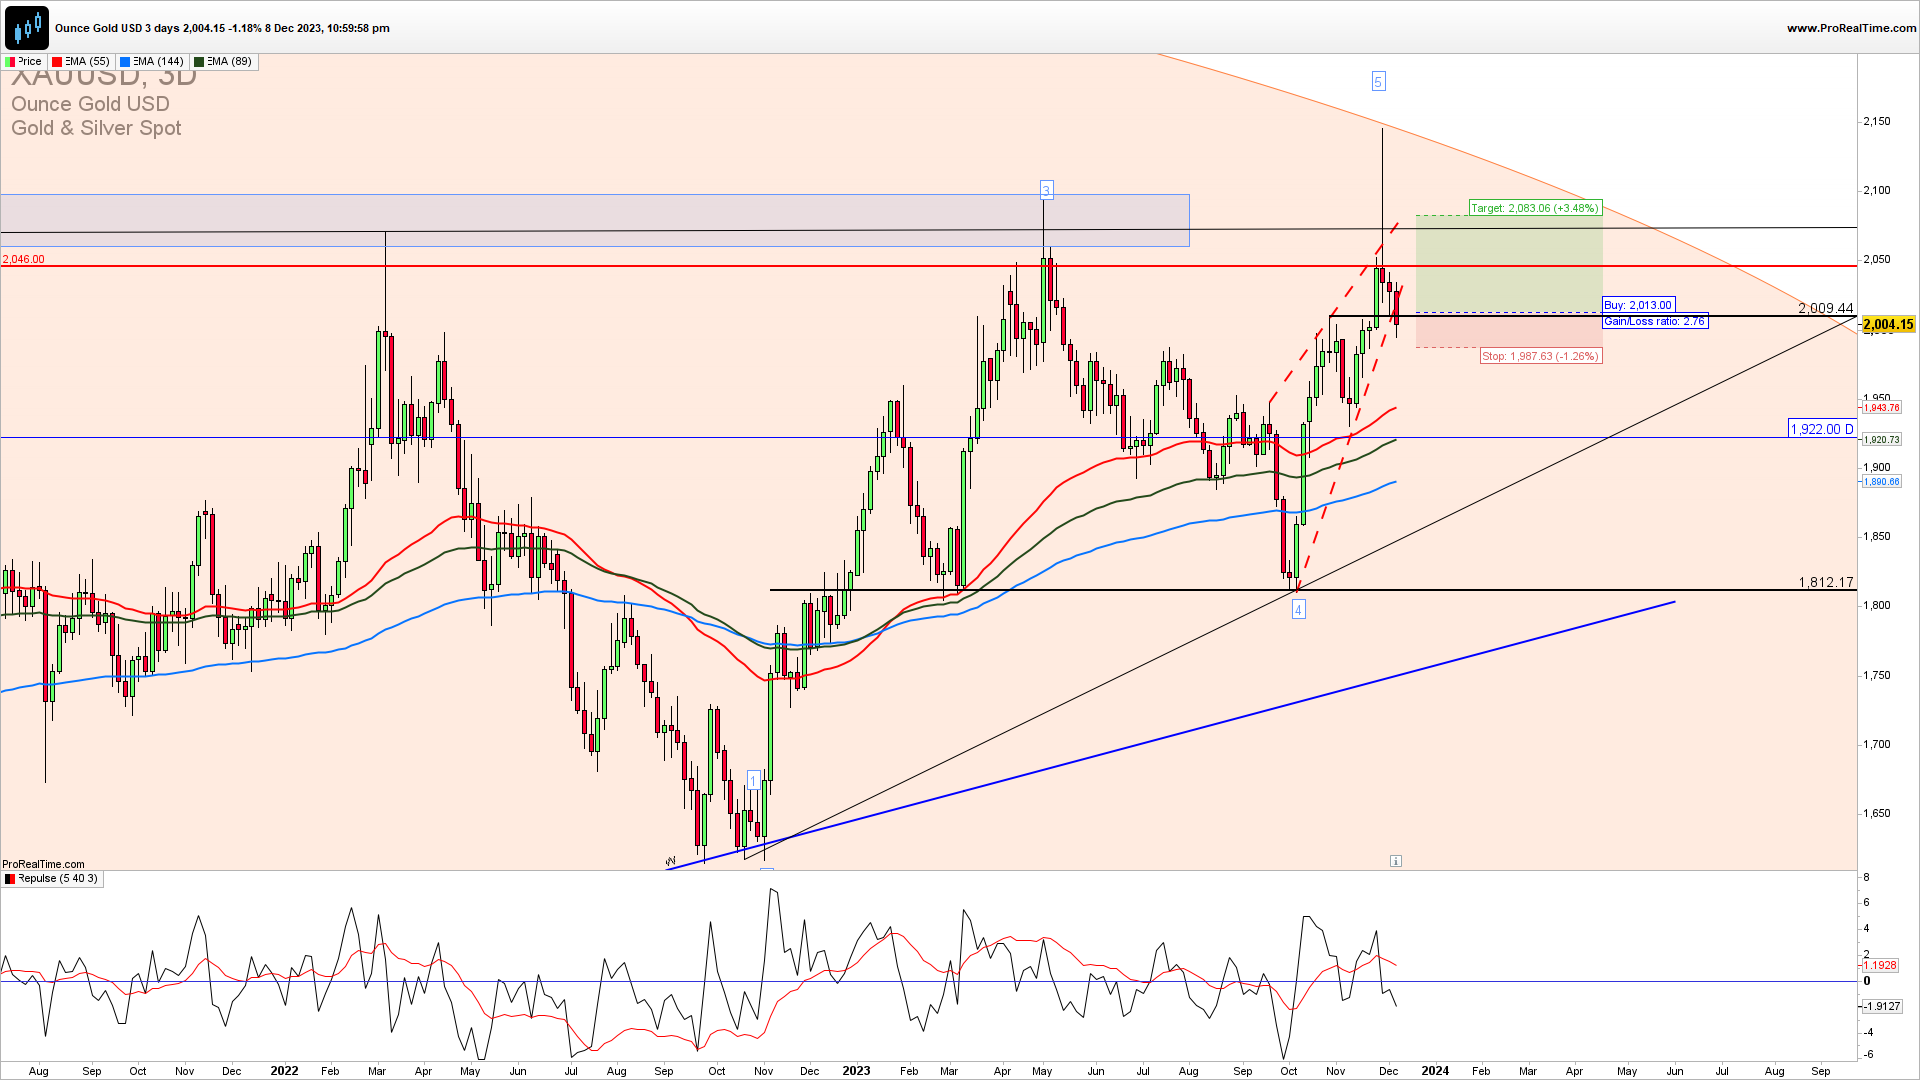
XAUUSD is reaching a strong resistance zone of 2050-2100 and a critical one for an extension higher. We are seeing a strong rejection from it which can push XAUUSD below 2000 again. A test of 2000 support will determine a future direction for XAUUSD. If we get a confirmed break below 2000 and it sustains lower we can see a pullback to 1870. A bounce will leave the probability of an extension higher open.
The Weekly Silver chart reveals the rising price action wedge and a test of its support in 2000. A break below is required to invalidate the immediate upside extension and will mark the fifth wave higher finished, and we are seeing an ongoing test of it. It is advisable to position yourself in just one trade direction and not to try to catch every swing. If we get a break below 2000 again this will be a swing short trade opportunity and we need to wait for a proper price action bounce from here to get a good long trade opportunity.
GET THE CHART OF THE DAY EVERY DAY IN YOUR INBOX
As the famous trader says…
“All the math you need in the stock market you get in the fourth grade.”Peter Lynch
How to trade this?
It is a fact that a strong upside resistance for Q4 2023 is 2050. If we get a confirmed break here we could see a strong upside continuation and a test of 2100. Near-term, short-trade entries have a higher probability of success but for the conservative traders upon a break below 2000. Long trade entries are possible as well but only on a price action bounce from 2000. You can try a long trade here with a stop loss below 2000 and if you will be stopped out then reverse to short.


