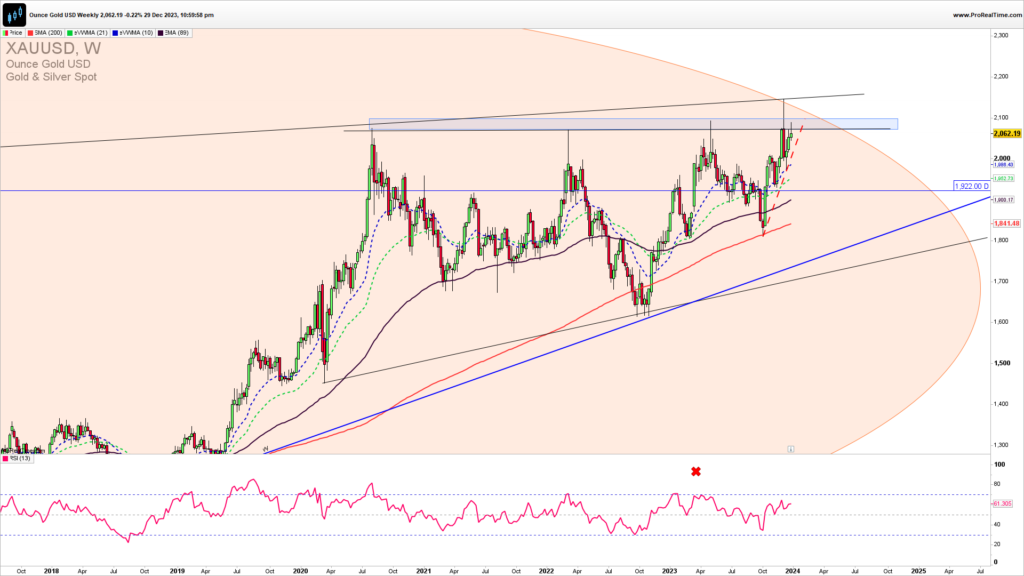
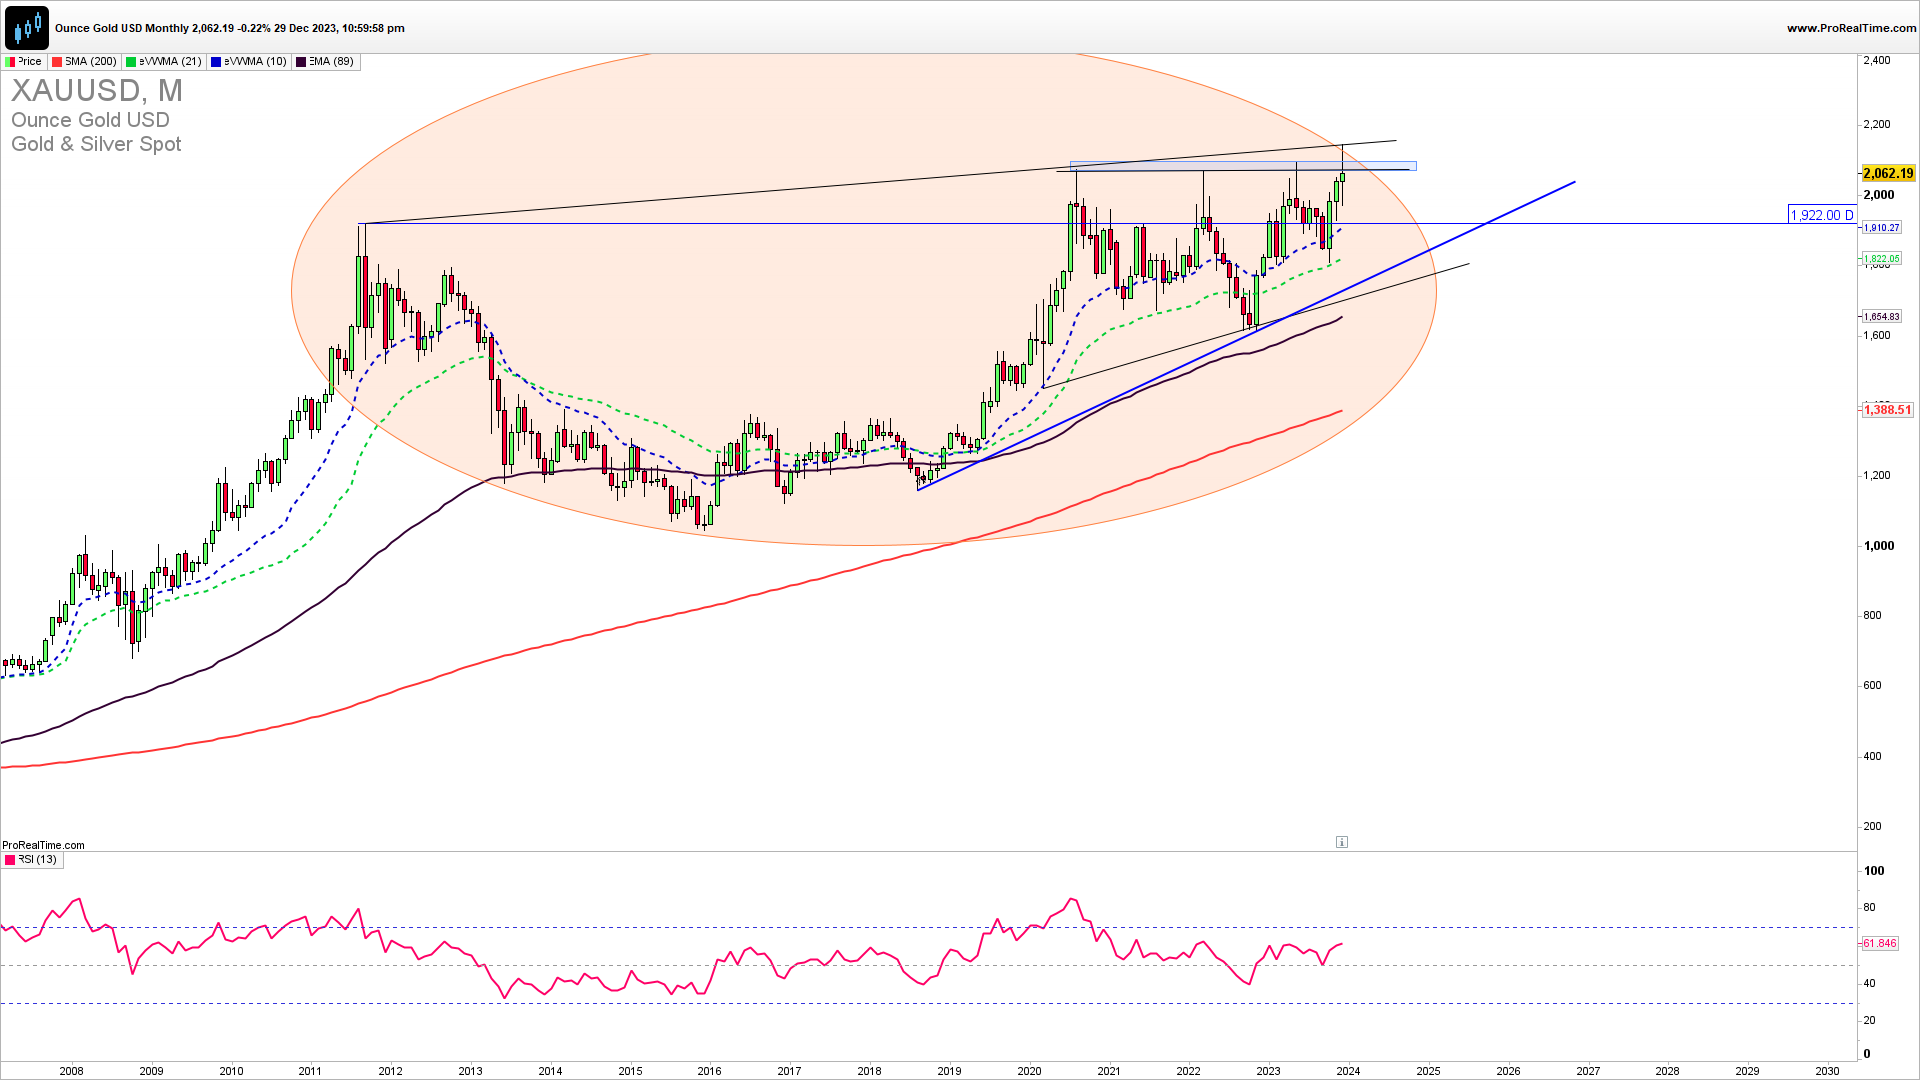
XAUUSD has tested a strong long-term upside resistance of 2140. A break above this resistance will open a new strong bullish cycle but we are seeing a terminal phase of the long-term and short-term Elliott Waves in the consolidation rising wedge which is not giving us a bullish expression. If we get a rejection here like we are seeing it and a confirmed break below 2000 we can say that the upside cycle is over and we will probably see a news swing lower to 1920.
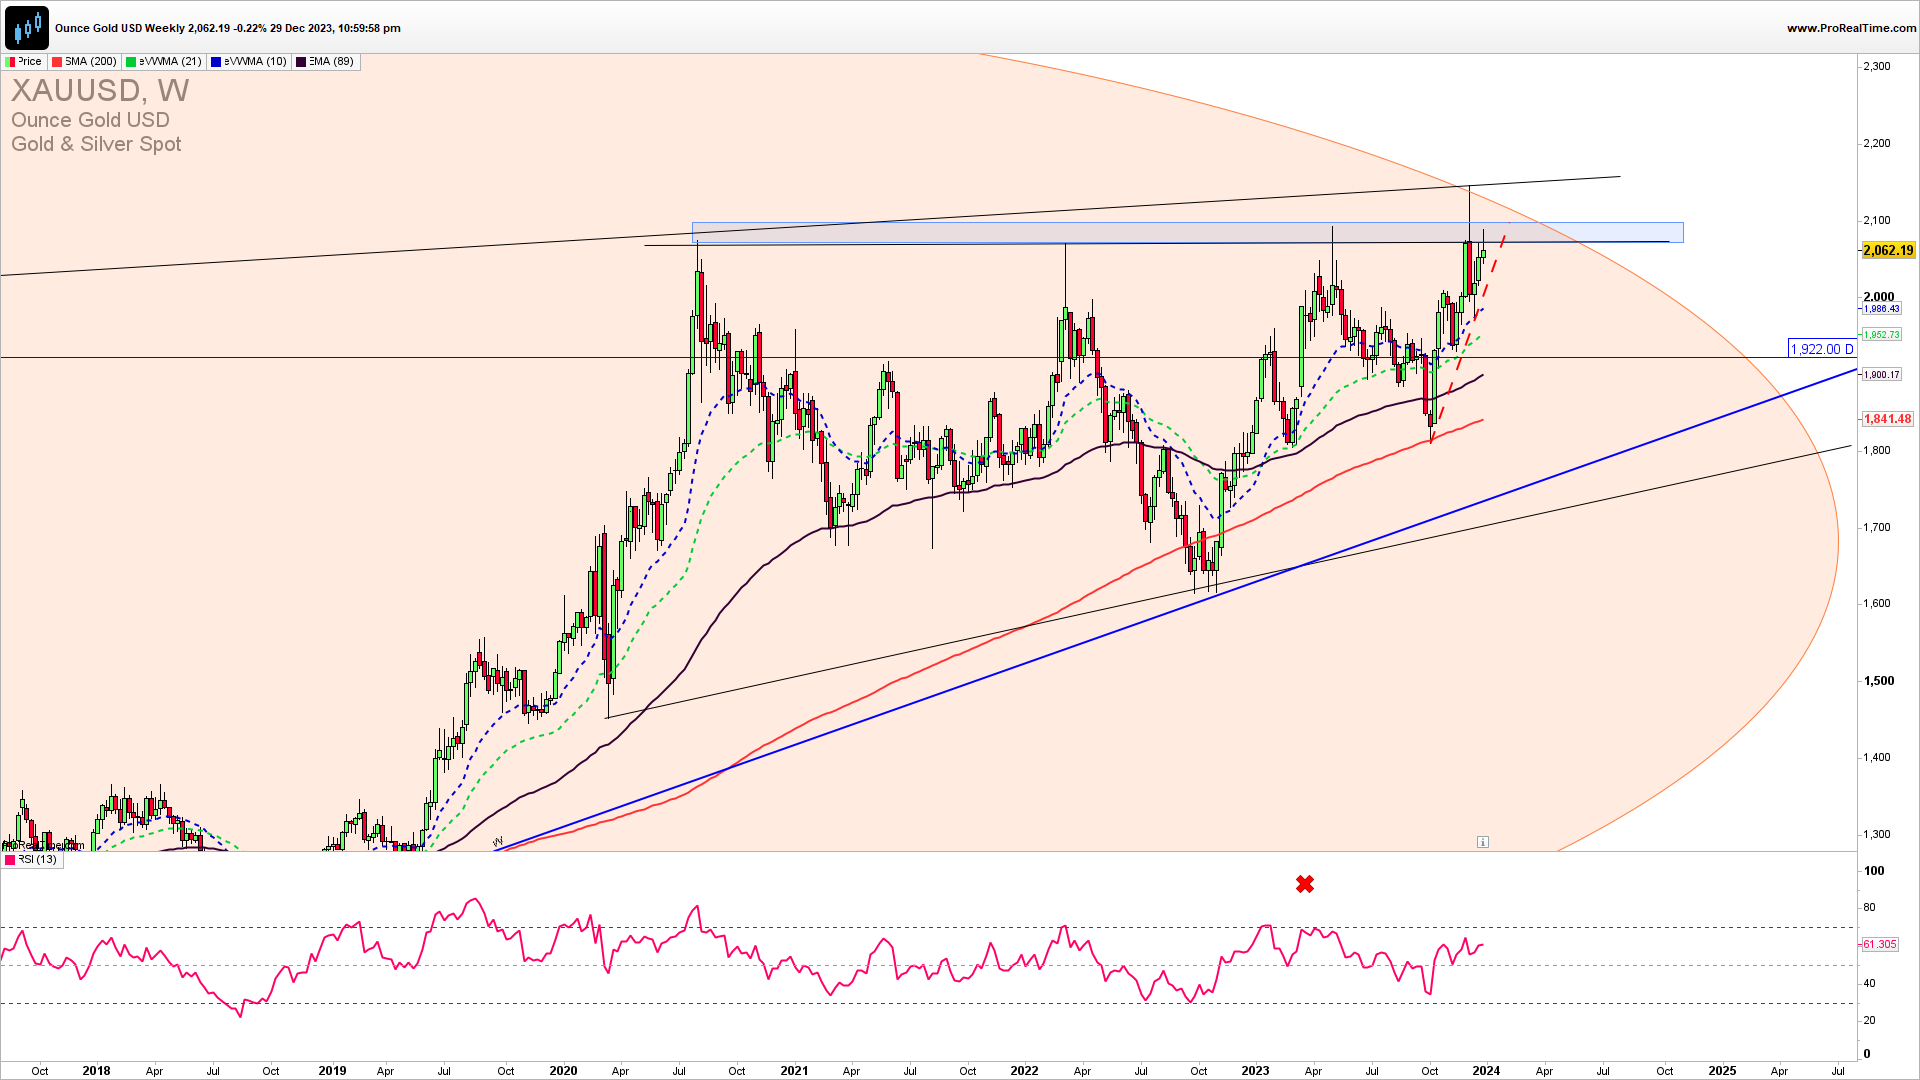
The Weekly XAUUSD chart reveals the rising price action wedge, a test of its upside resistance, and an already-mentioned key level of 2100. A break below 2050 is required to invalidate the immediate upside extension and will mark the fifth wave higher finished, which will lead to a deeper five-wave correction. It is advisable to position yourself in just one trade direction and not to try to catch every swing. If we get a break below 2050 it will mark the five waves upside finished and will lead to a bigger reversal lower as said.
GET THE CHART OF THE DAY EVERY DAY IN YOUR INBOX
As the famous trader says…
“Where you want to be is always in control, never wishing, always trading, and always, first and foremost, protecting your butt.”PAUL TUDOR JONES
How to trade this?
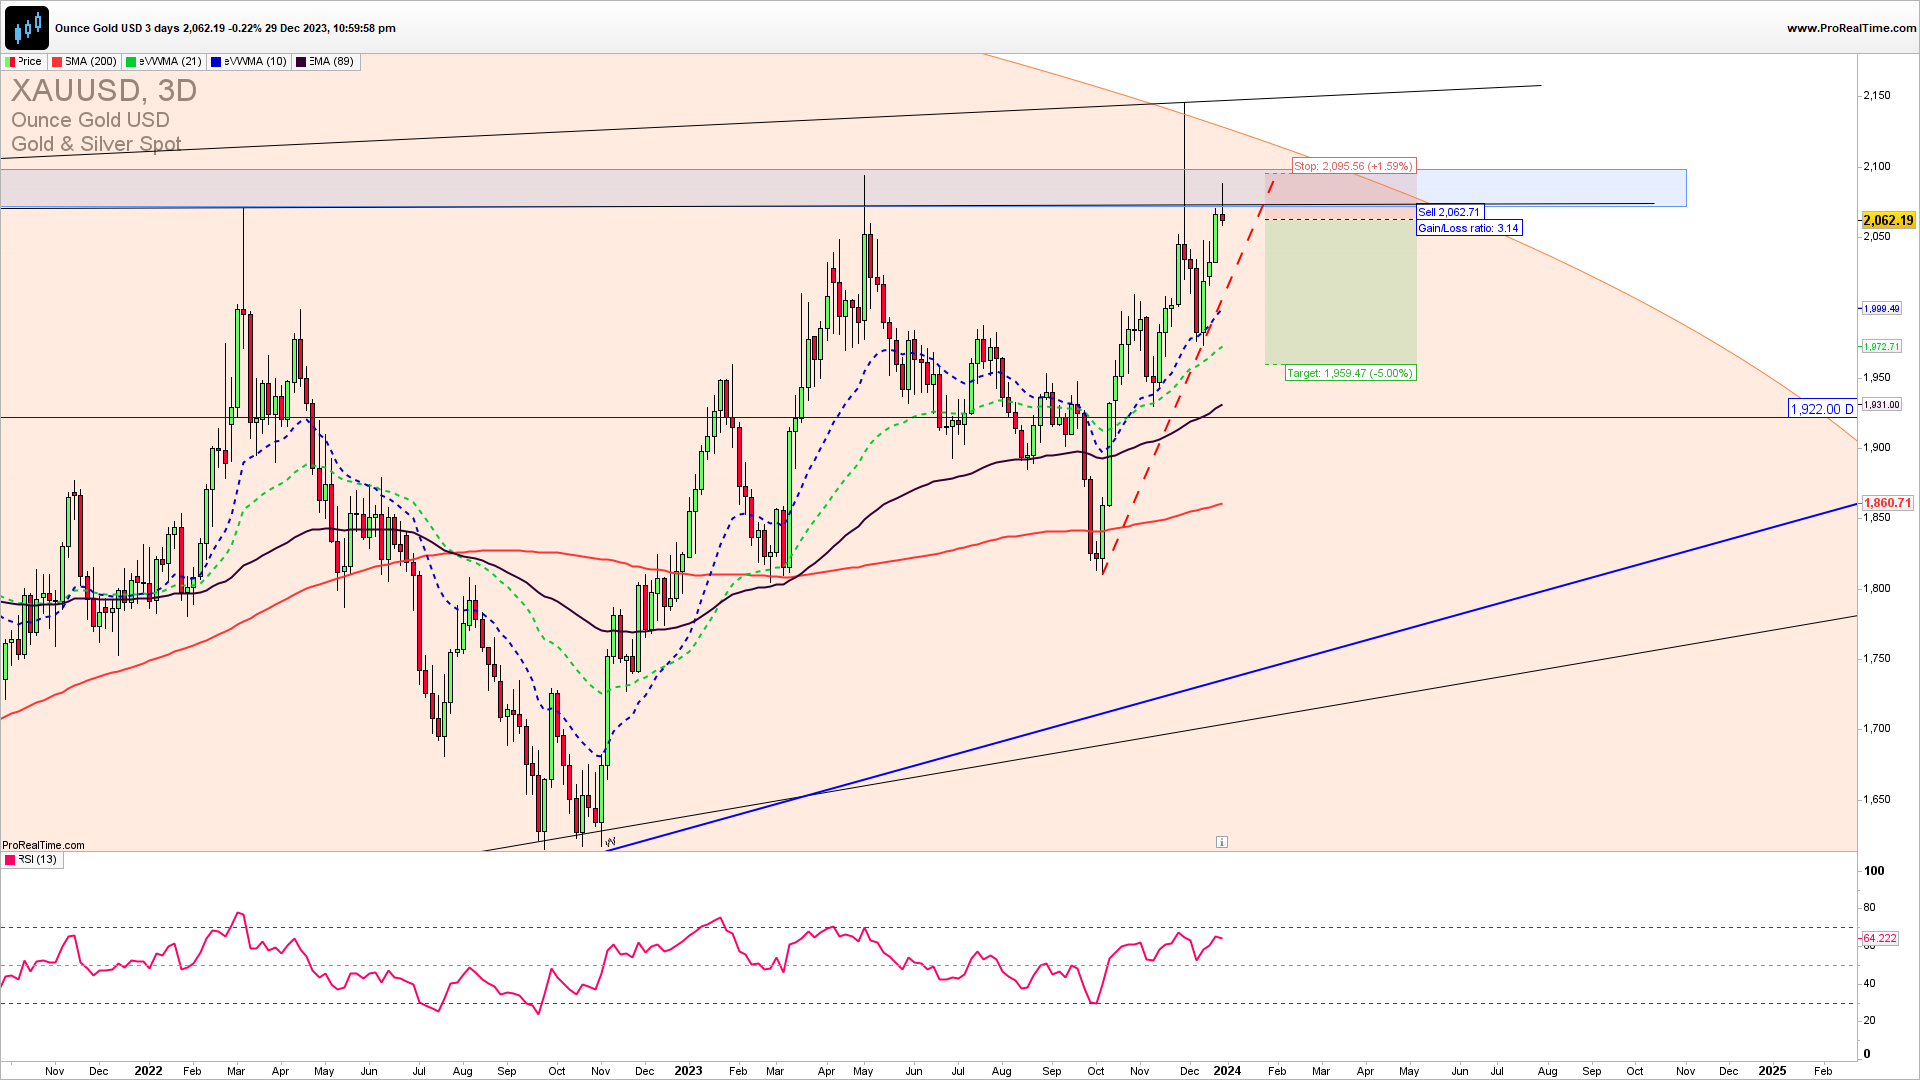
It is a fact that a strong upside resistance for Q1 2024 is 2130. If we get a confirmed break here we could see a strong upside continuation and new highs. Near-term, short-trade entries have a higher probability of success but for the conservative traders upon a break below 2050. Long trade entries are also possible but only on a price action confirmed break above 2130. You can try a short trade here with a stop loss above 2090. For inquiries about account management please write to [email protected].


