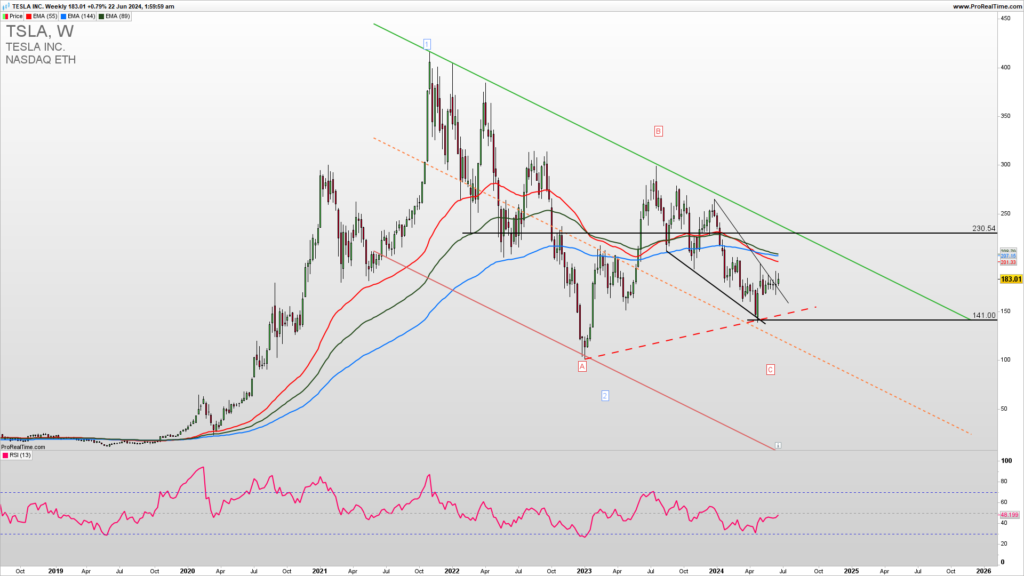
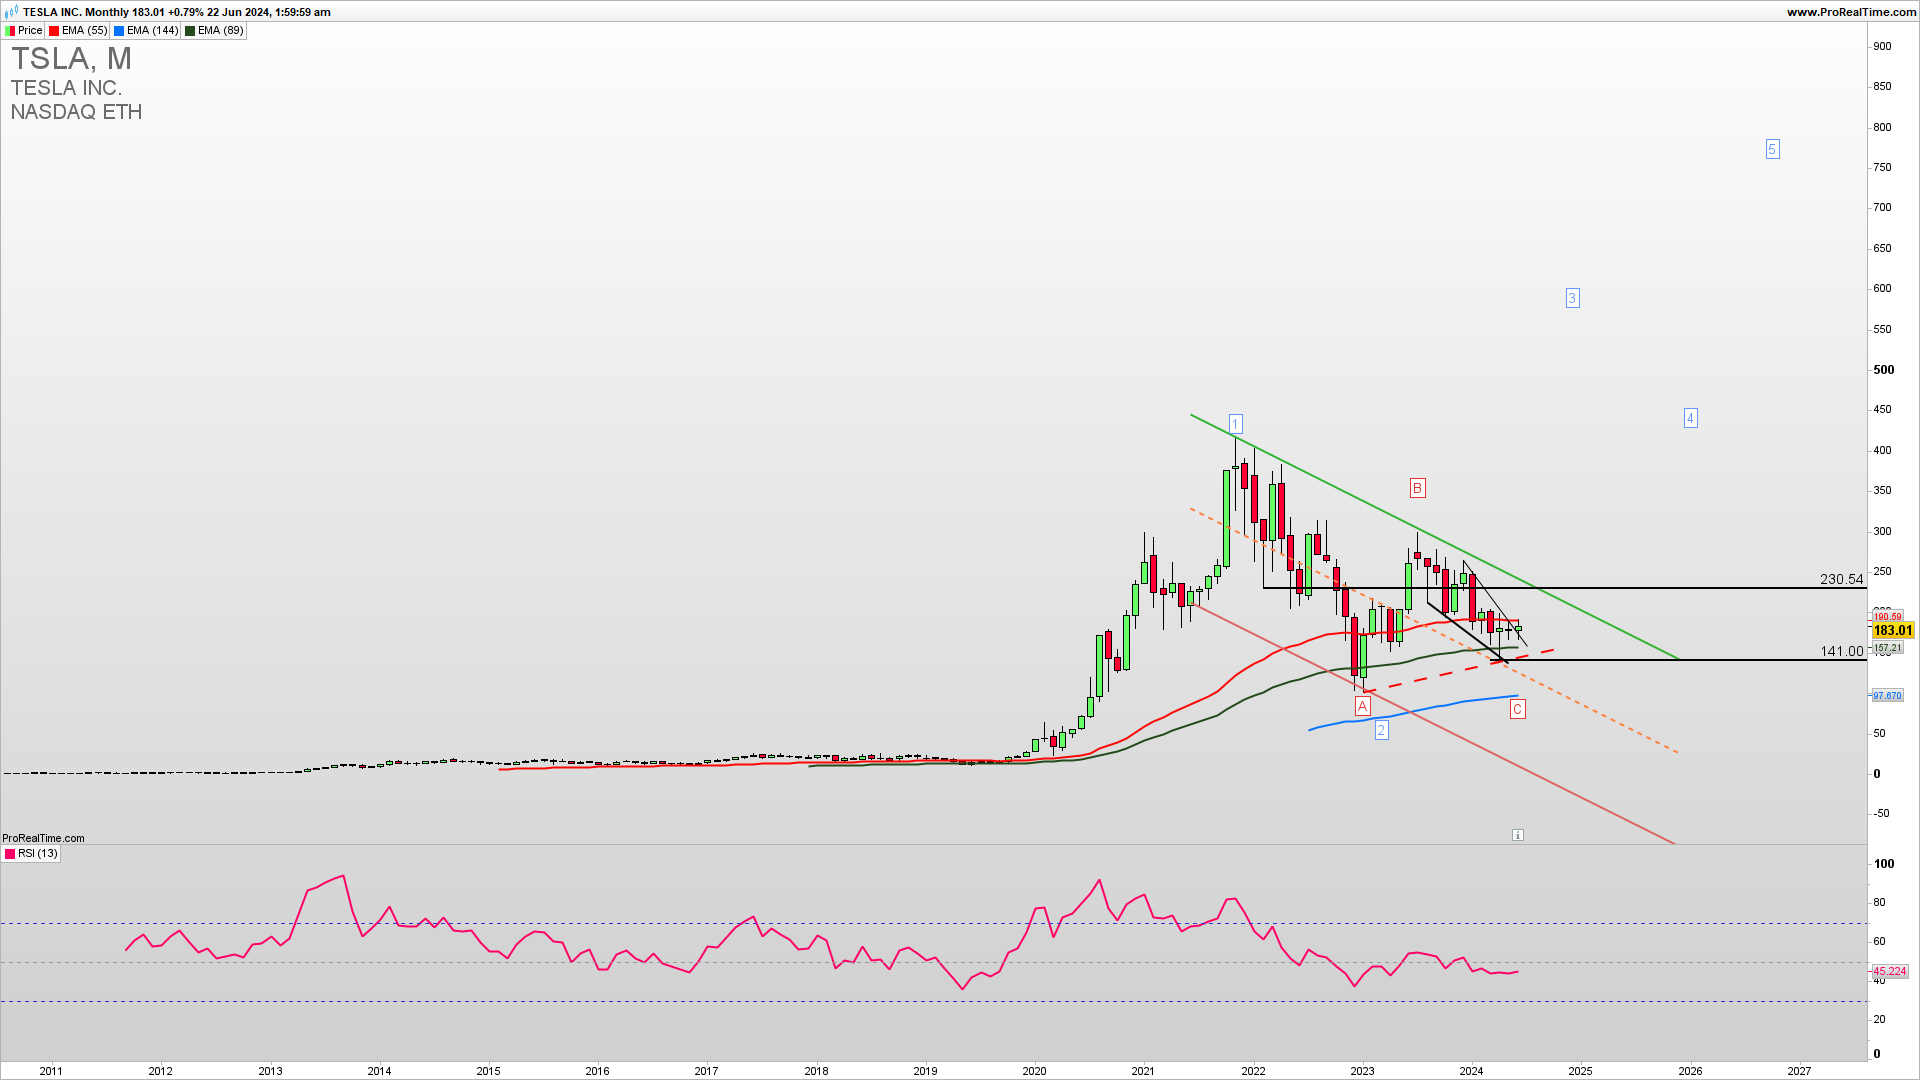
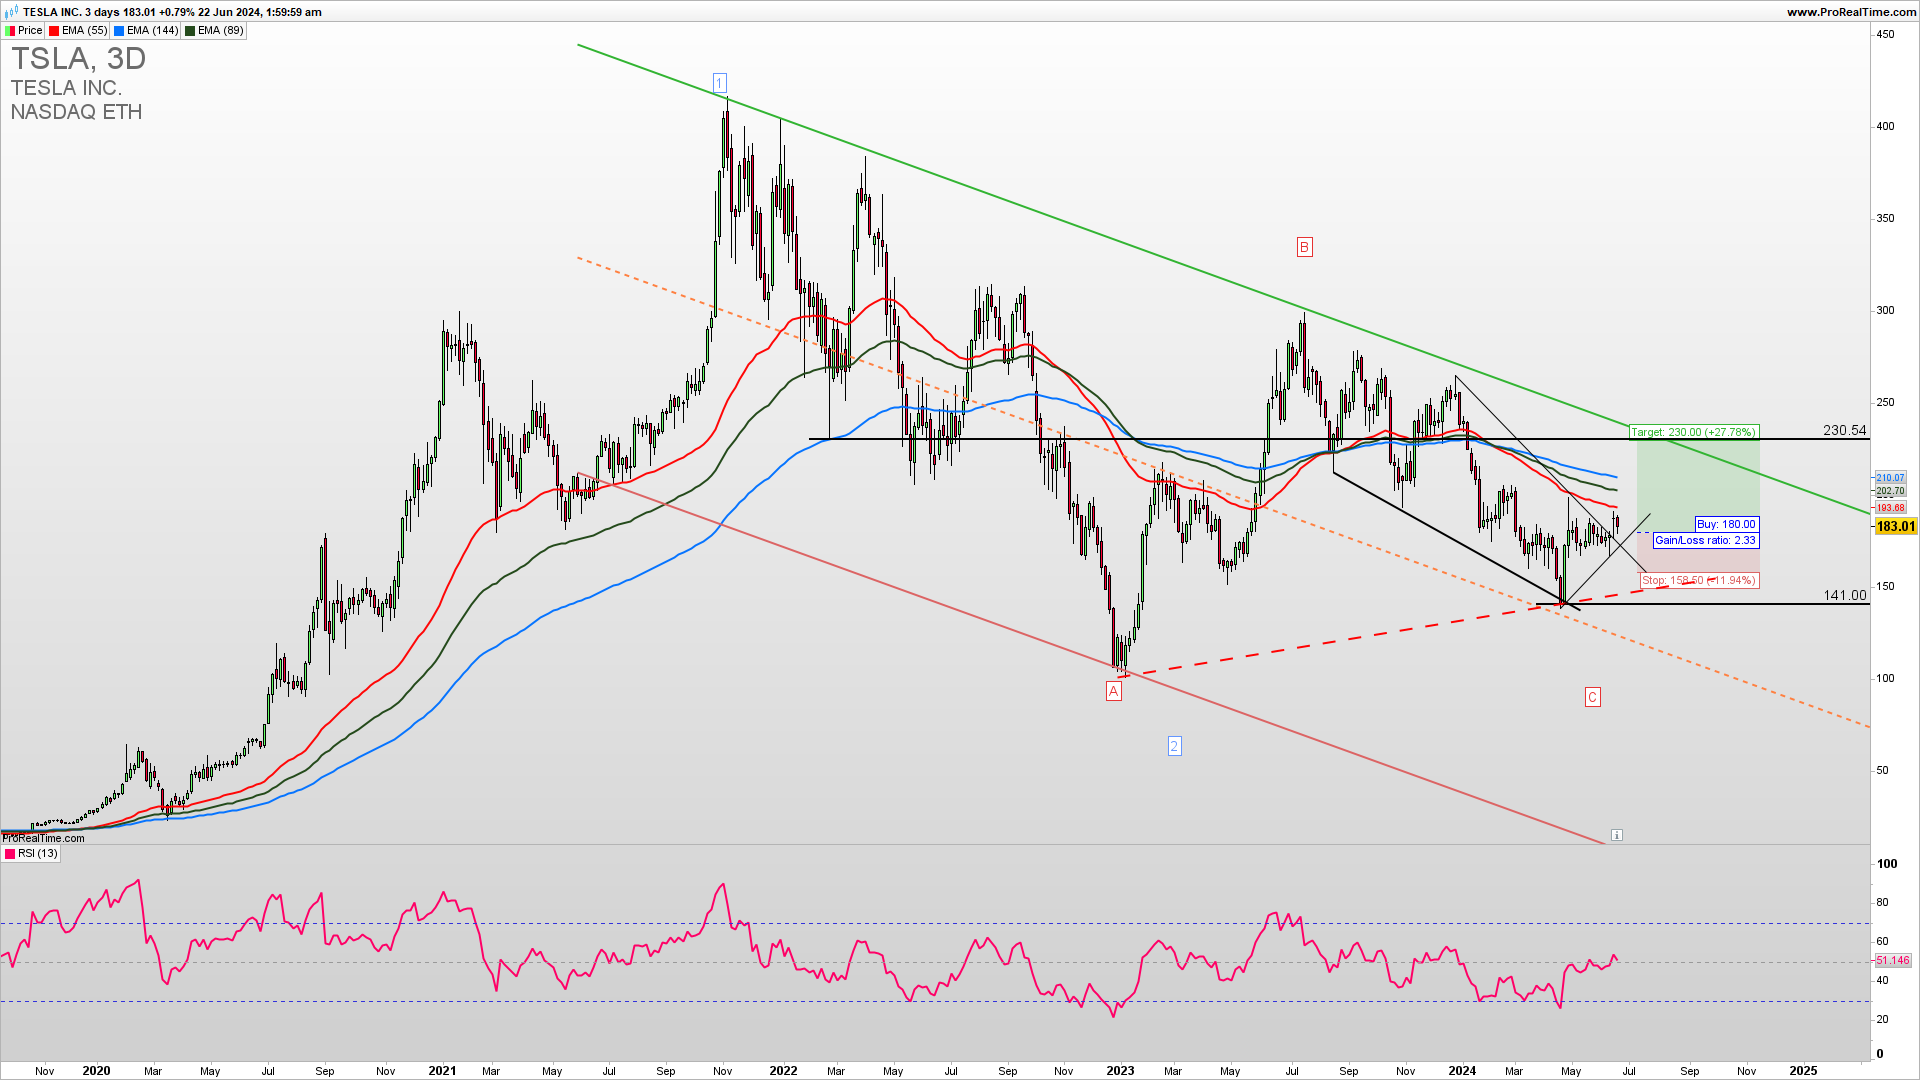
TSLA is within the LT bullish flag (it seems like that for now) and in the potential third wave beginning which can be triggered upon a confirmed break above 230. A confirmed breakout above this level is required to continue higher in the third wave. Strong support is a symmetrical triangle 150 level. Learn to Trade Indices profitably.
The Weekly TSLA chart reveals a falling wedge in the bullish flag. At this point, both sell and buy positions are possible as the TSLA is within a swing range and a short-term breakout above 200 could lead to a test of 230 level which is now medium-term key resistance. Overall support for the upside stays at the 140-150 zone.
GET THE CHART OF THE DAY EVERY DAY IN YOUR INBOX
As the famous trader says…
“I know where I’m getting out before I get in. Whenever I enter a position, I have a predetermined stop. That is the only way I can sleep. The position size on a trade is determined by the stop, and the stop is determined on a technical basis.”
Bruce Kovner
How to trade this?
It is a fact that a strong upside resistance for Q3 2024 is 230 and If we get a confirmed break above this level we could see a strong upside continuation in a third long-term upside Elliott Wave. Near-term, long-trade entries have a higher probability of success. Long trade entries can be placed here or a call option buying with a stop loss below 160 targeting the first 230 and if broken continuation higher. The short-trade entry can be tried in the case of a break below 140. For inquiries about account management please write to [email protected].


