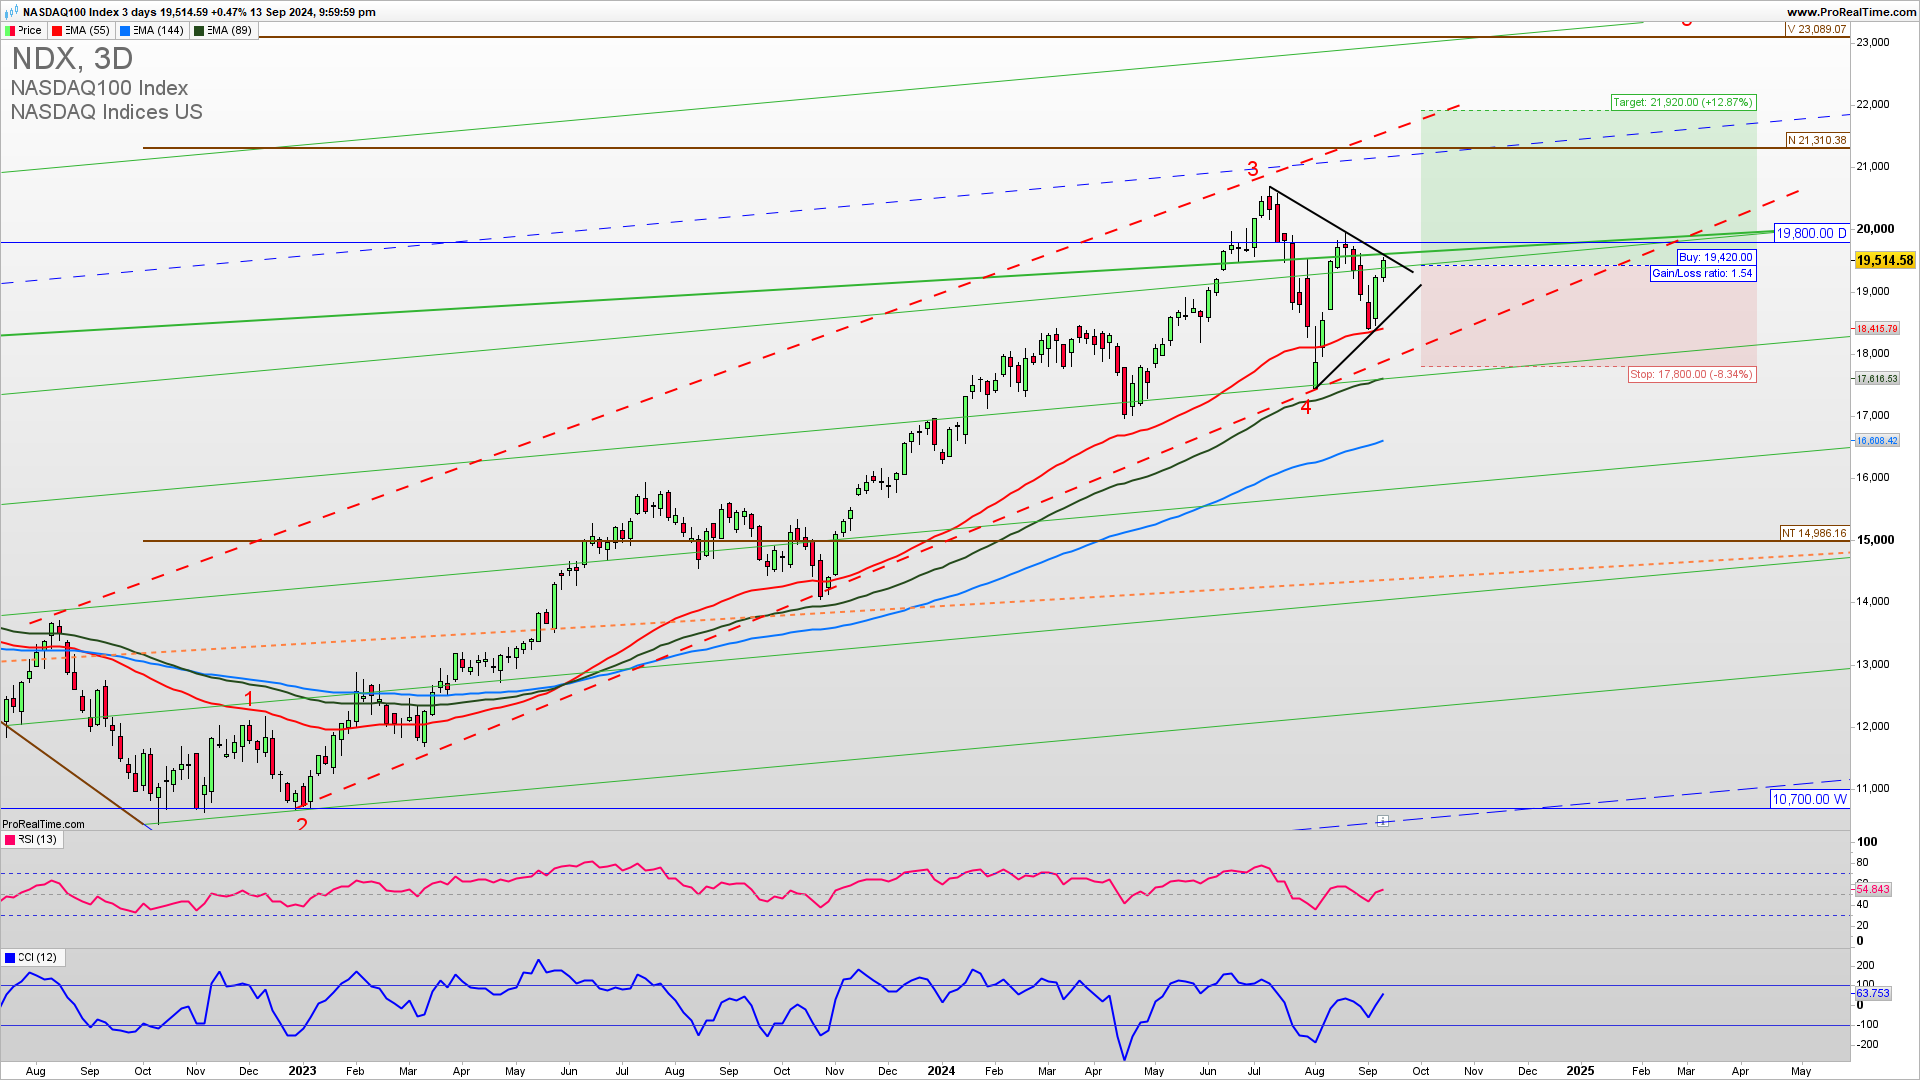
NASDAQ bounced strongly from the 17400 level and seems to have finished the fourth wave correction before an extension higher in the fifth wave that will begin upon a break above 20000. A break above 20000 is required for the extension higher in the fifth wave with an ultimate target of 23000. Learn to Trade stocks profitably.
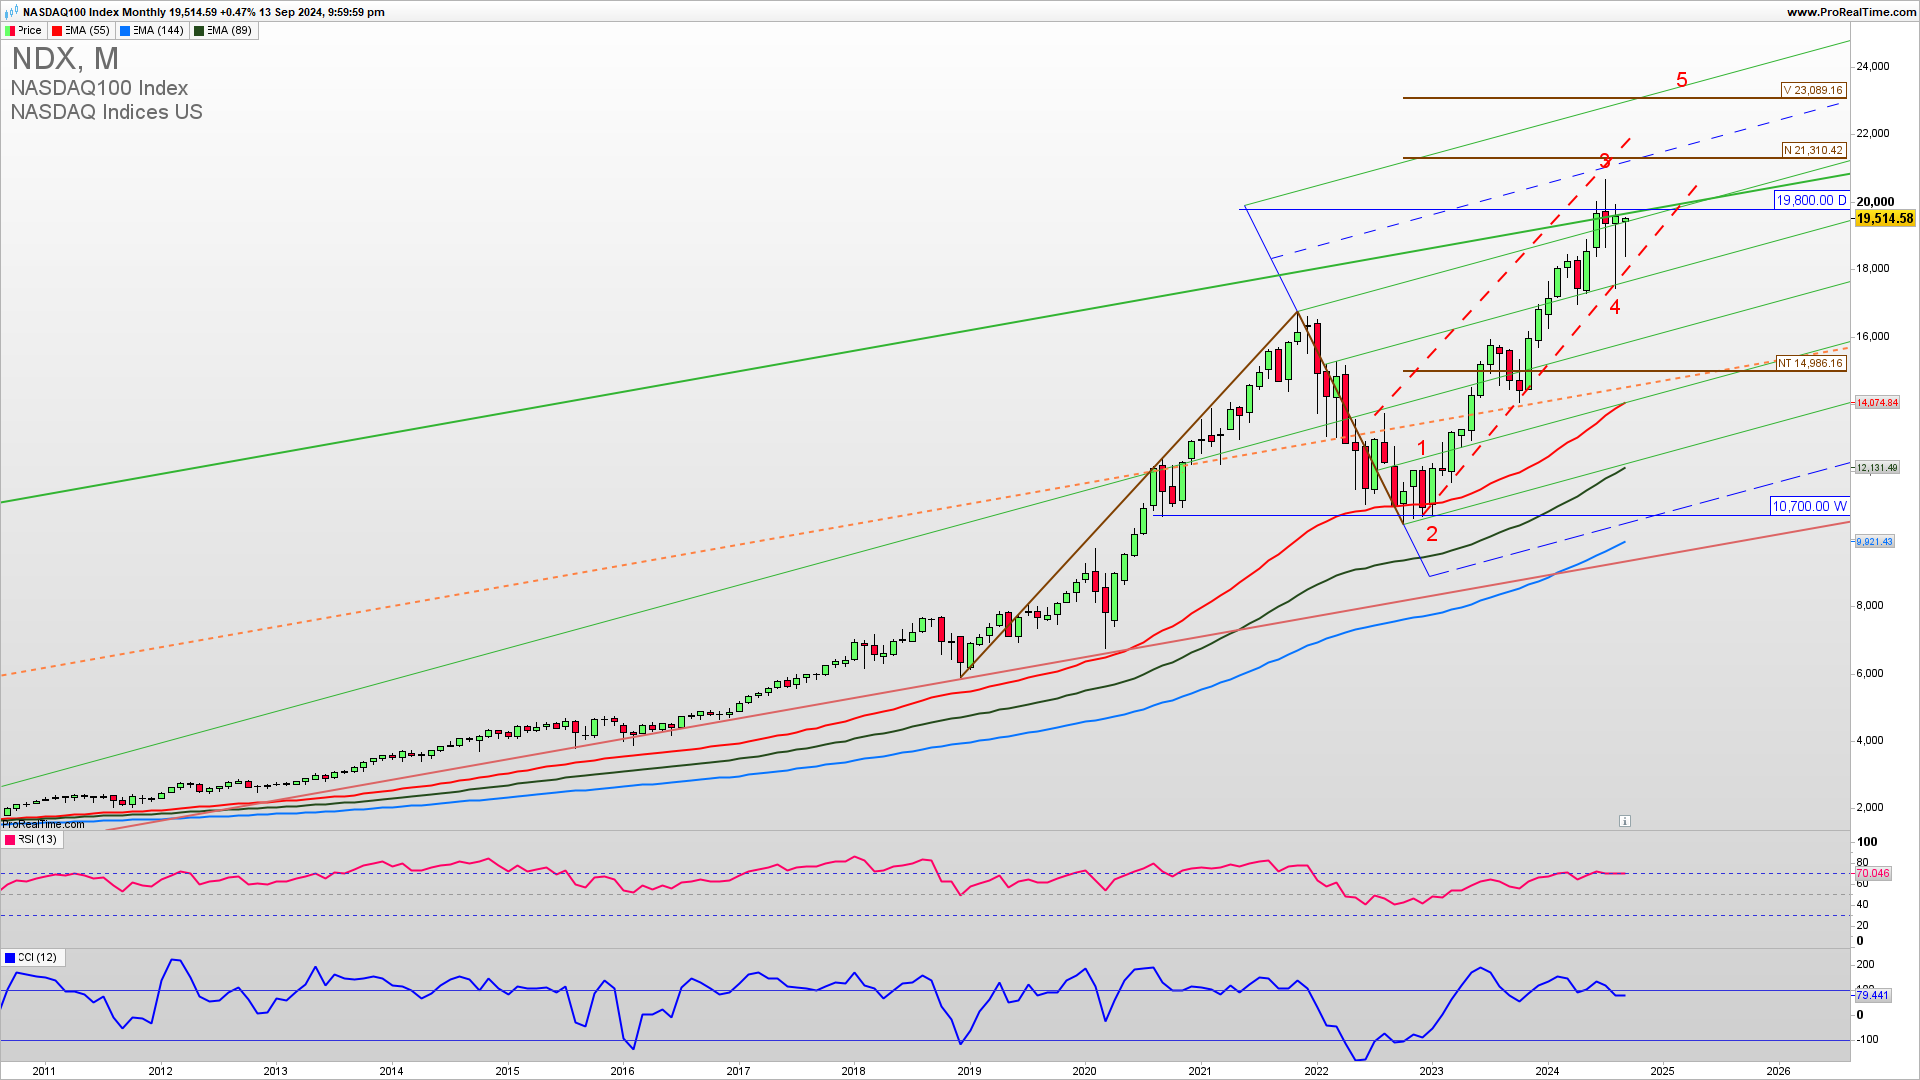
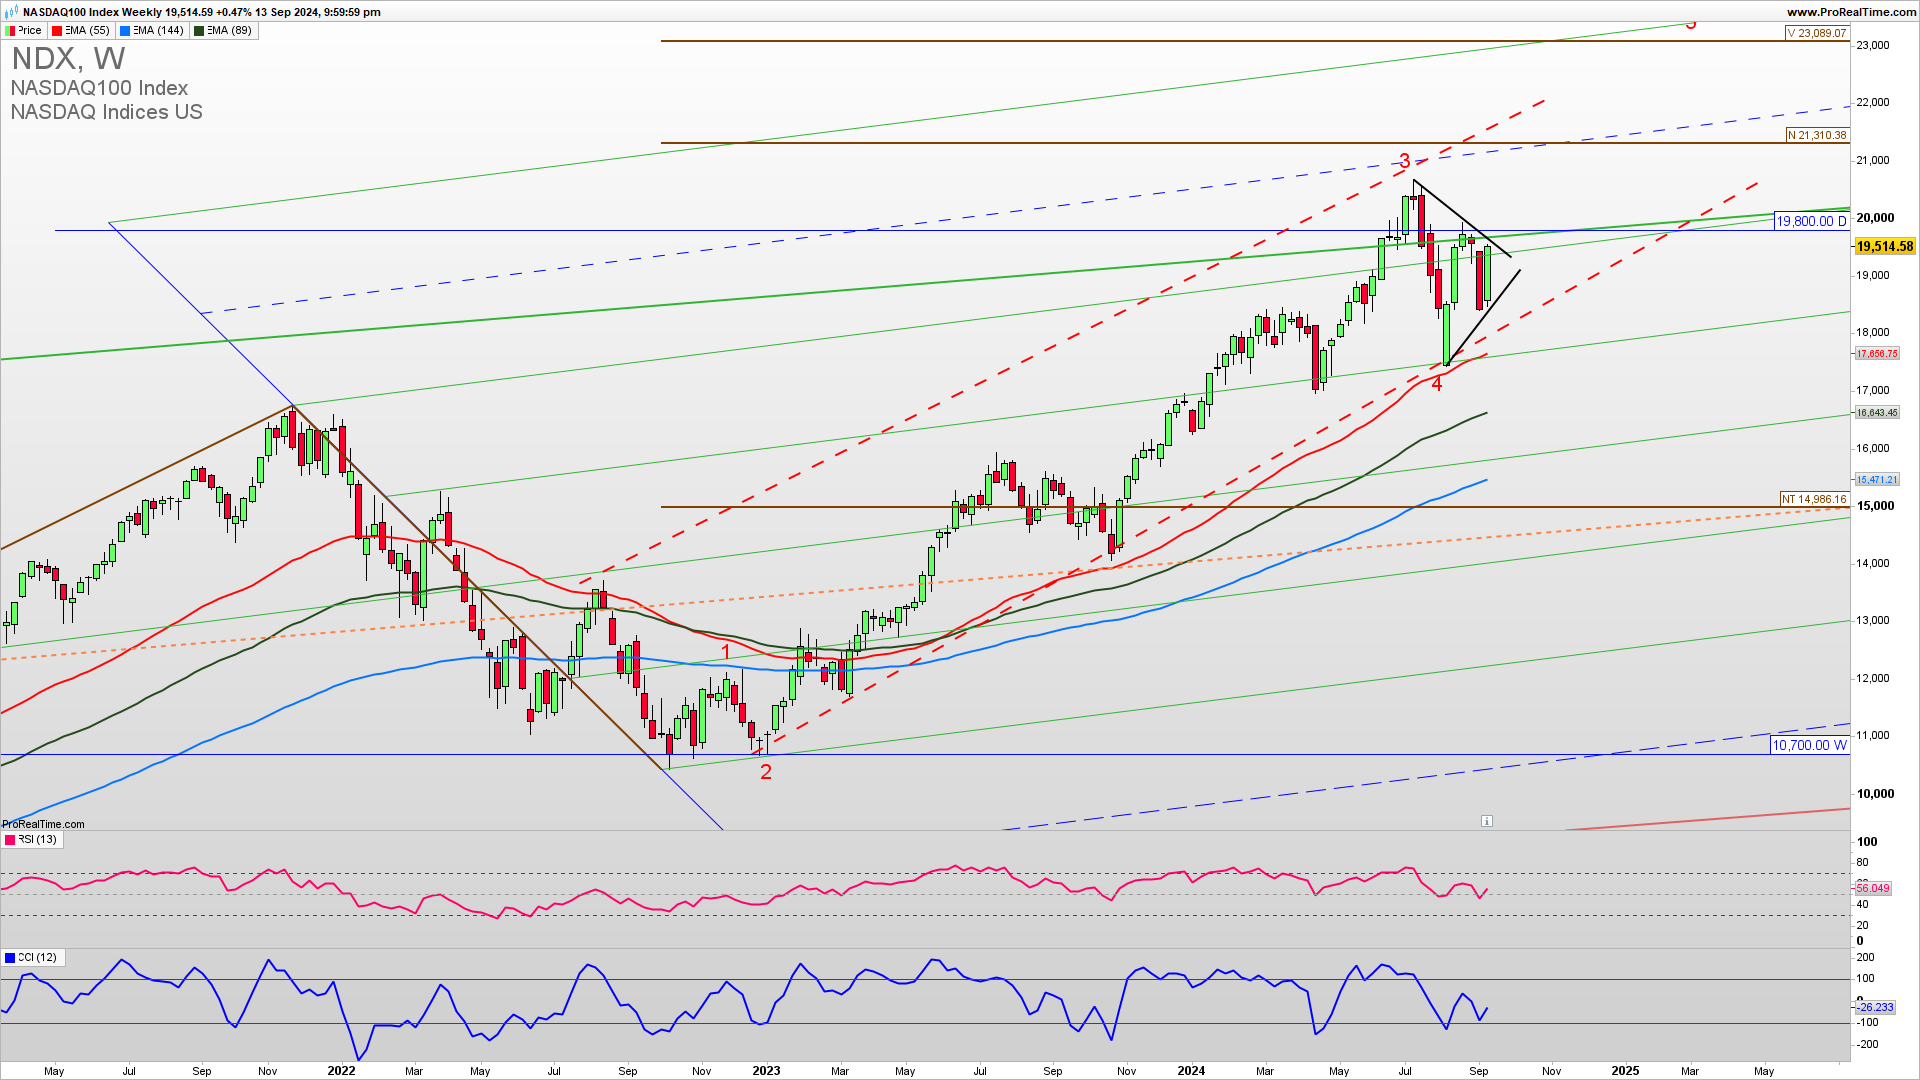
The weekly NASDAQ chart reveals a triangle consolidation after testing the upside resistance 20000 level two times. At this point, buy positions have a higher probability of success as the NASDAQ is still within a well-established uptrend and each retrace is strongly supported by a buying demand. Overall support for the upside even if it breaks below 18000 is 15800 and the final long-term support for a bullish trend invalidation is much lower at 14600 which means that it still can develop a long and profitable fifth impulse wave higher—following the price action we need to see a break above 20000 for a continuation higher and an extension to 21300.
GET THE CHART OF THE DAY EVERY DAY IN YOUR INBOX
LIFETIME ACCESS TO PRIVATE TRADING COMMUNITY $99 FOR A LIMITED TIME 48H VALID!
As the famous trader says…
“The stock market is a device to transfer money from the impatient to the patient.”
WARREN BUFFET
How to trade this?
It is a fact that a strong upside resistance for Q3 2024 is 2000 and If we get a confirmed break above this level we could see a strong upside continuation for 21300 in the fifth extended long-term upside Elliott Wave. Near-term, long-trade entries have a higher probability of success. Long trade entries can be placed here or upon a dip to 19000 with a stop loss below 18000. For inquiries about account management please write to [email protected].