The IWM is often analyzed in the context of broader market indices like $SPY, $QQQ, and others, with X posts reflecting market sentiment and reactions to economic news or individual stock performances within the ETF’s holdings.
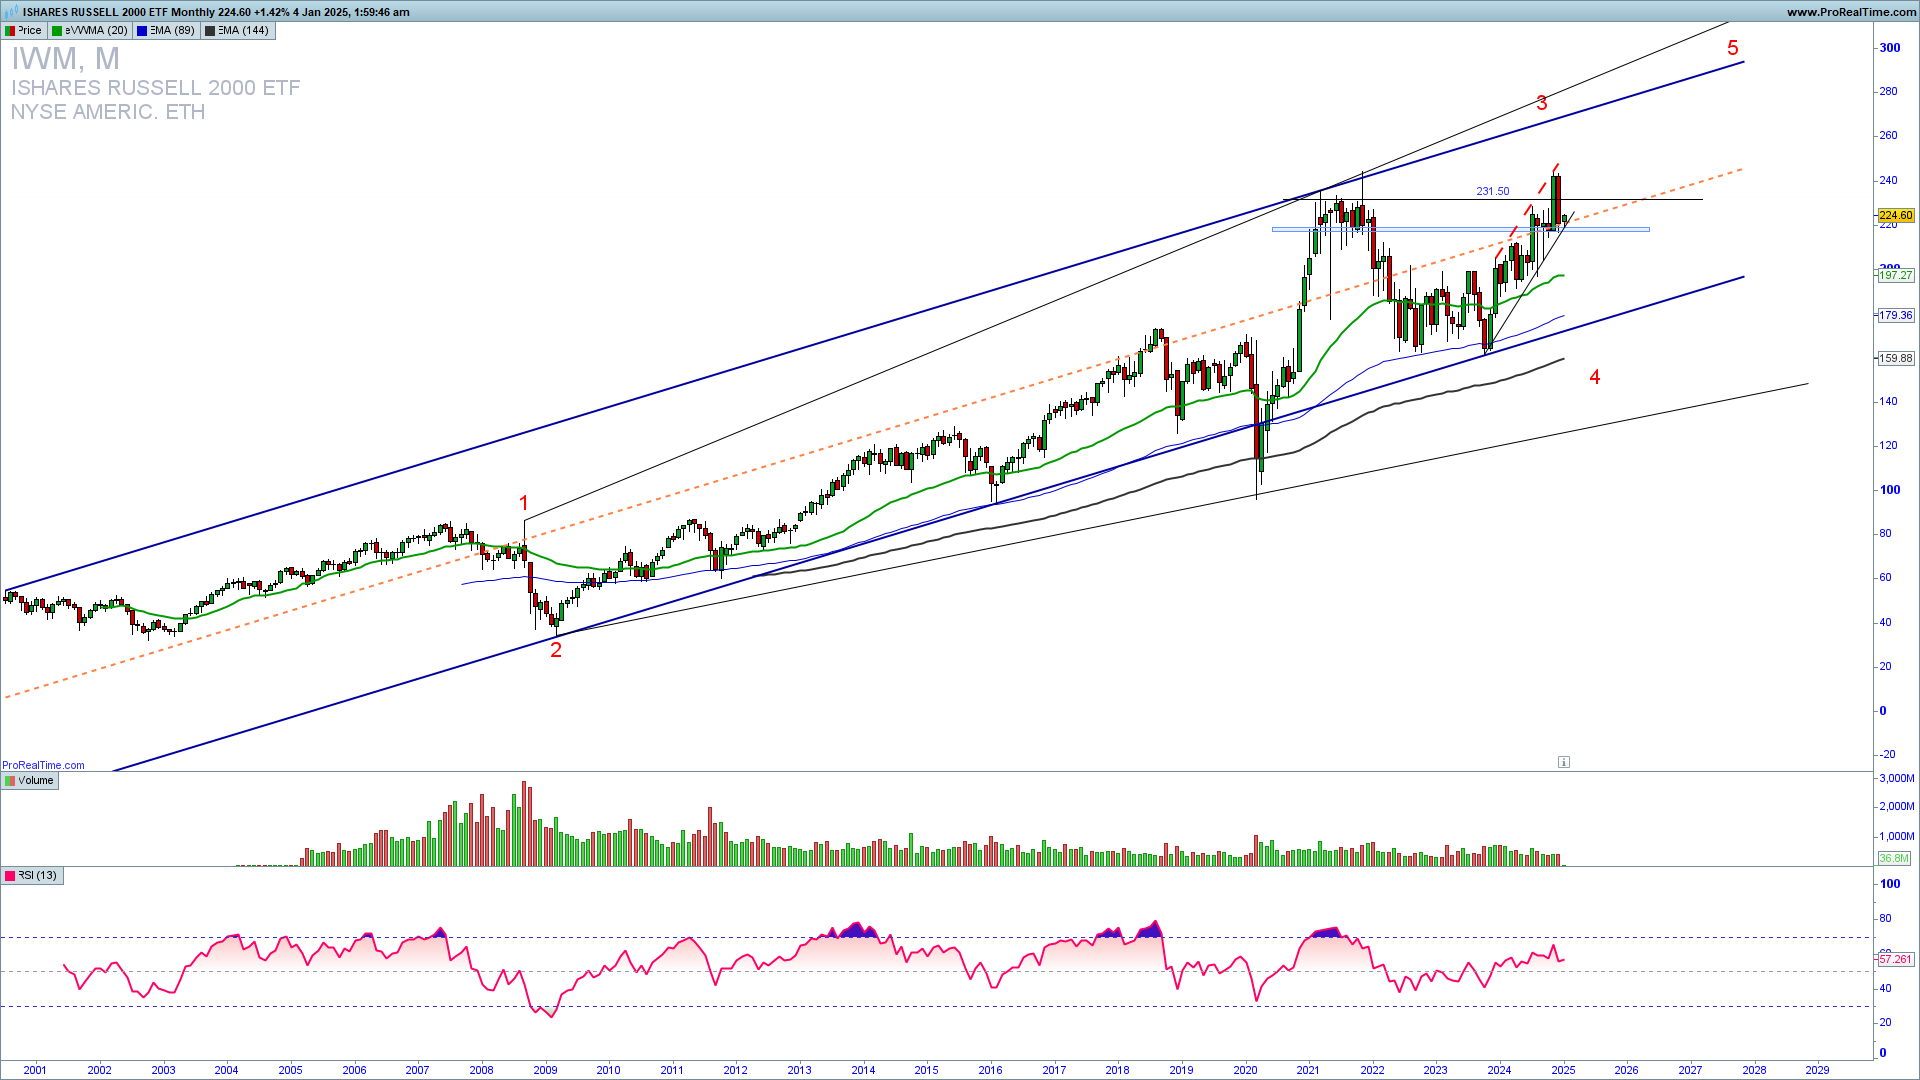
IWM has recently been rejected from the 243 high reached in November 2024 and is pulling back. This level represents a possible third long-term Elliott upside wave top; a confirmed break below 215 will confirm that. Only a break above 235 would lead to an upside continuation and invalidate the downside reversal. Learn to Trade CFDs profitably.
KNOWPO TRADING SYSTEM TRAINING INTRO FEE!
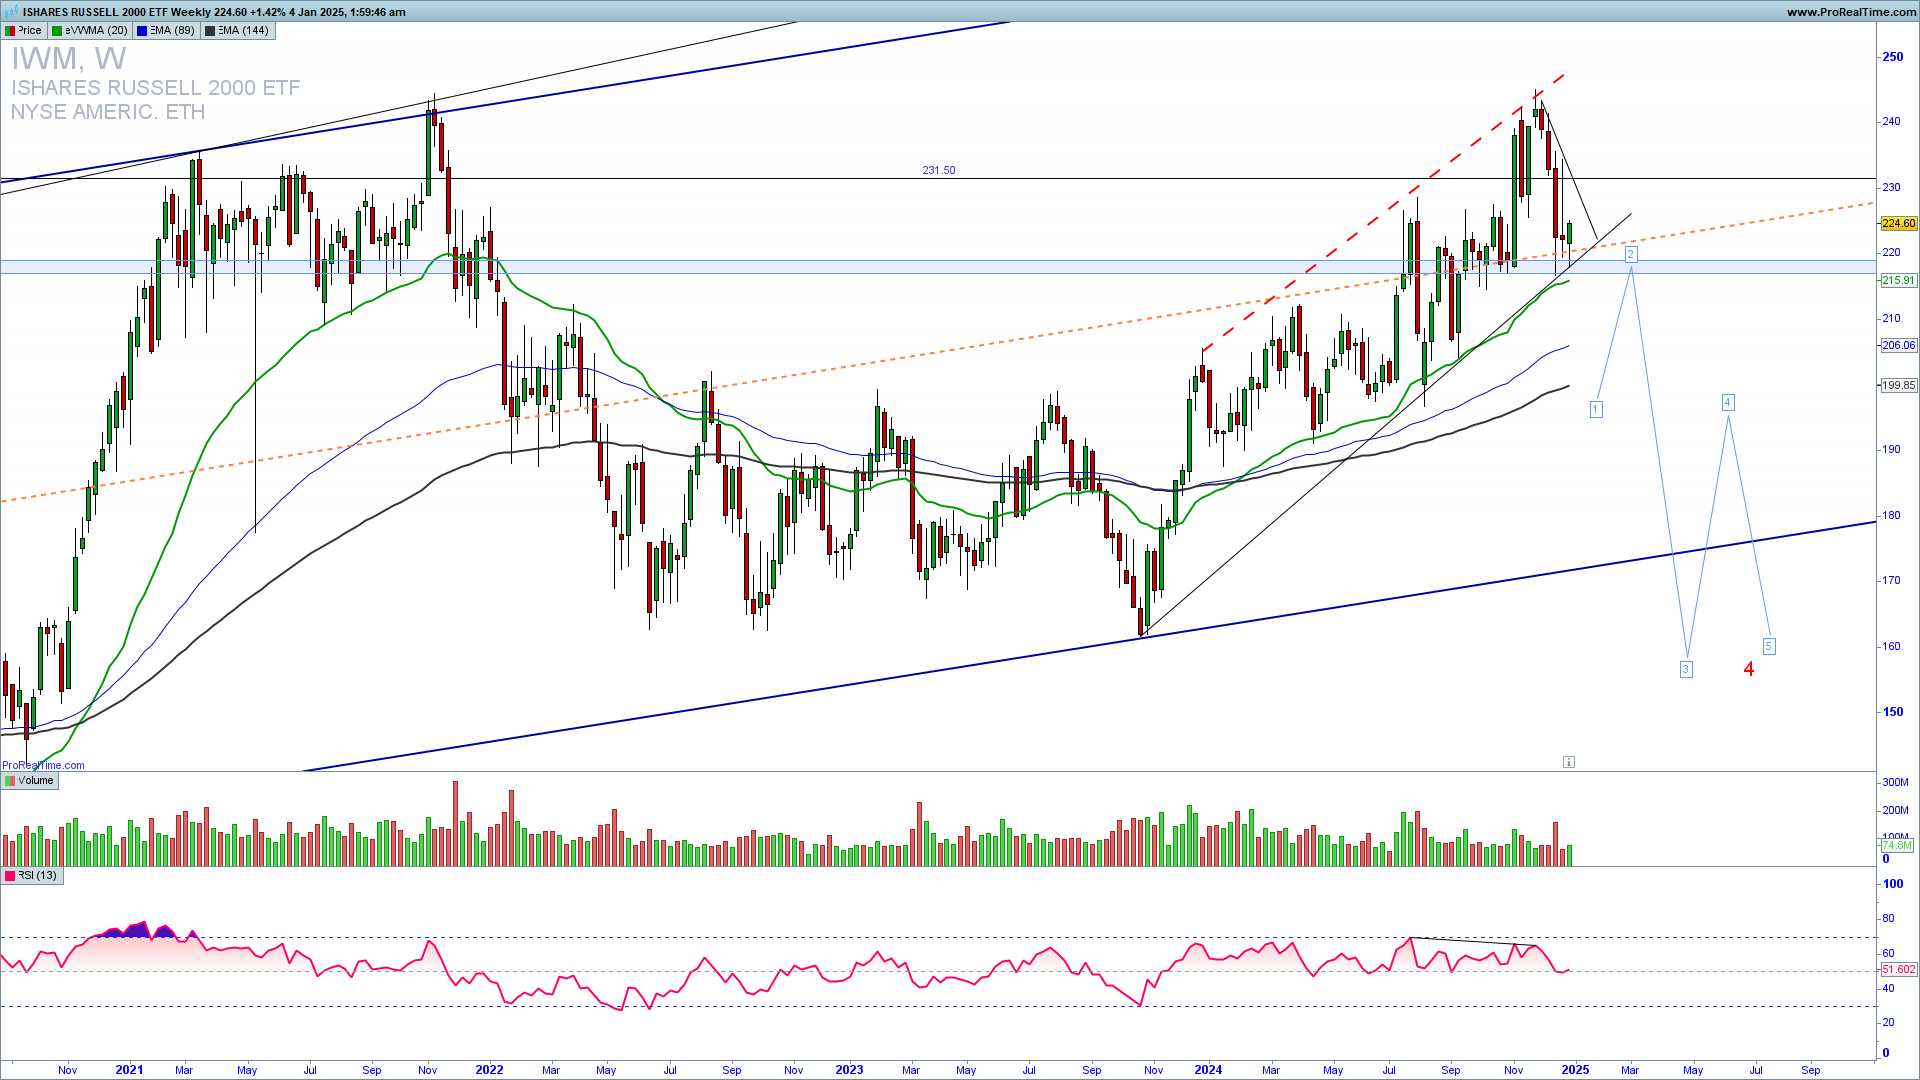
IWM’s weekly chart below reveals a test of the uptrend channel support and a descending triangle. At this point, sell positions have a greater probability of success. If we get a confirmed break above 230, we should see an extension of the long-term third wave higher. However, the RSI negative divergence triggered, so I expect a strong reversal downside continuation from here and a break below channel support.
GET THE CHART OF THE DAY EVERY DAY IN YOUR INBOX
As the famous trader says…
“If your goal is to trade like a professional and be a consistent winner, then you must start from the premise that the solutions are in your mind and not in the market.”
Mark Douglas
How to trade this?
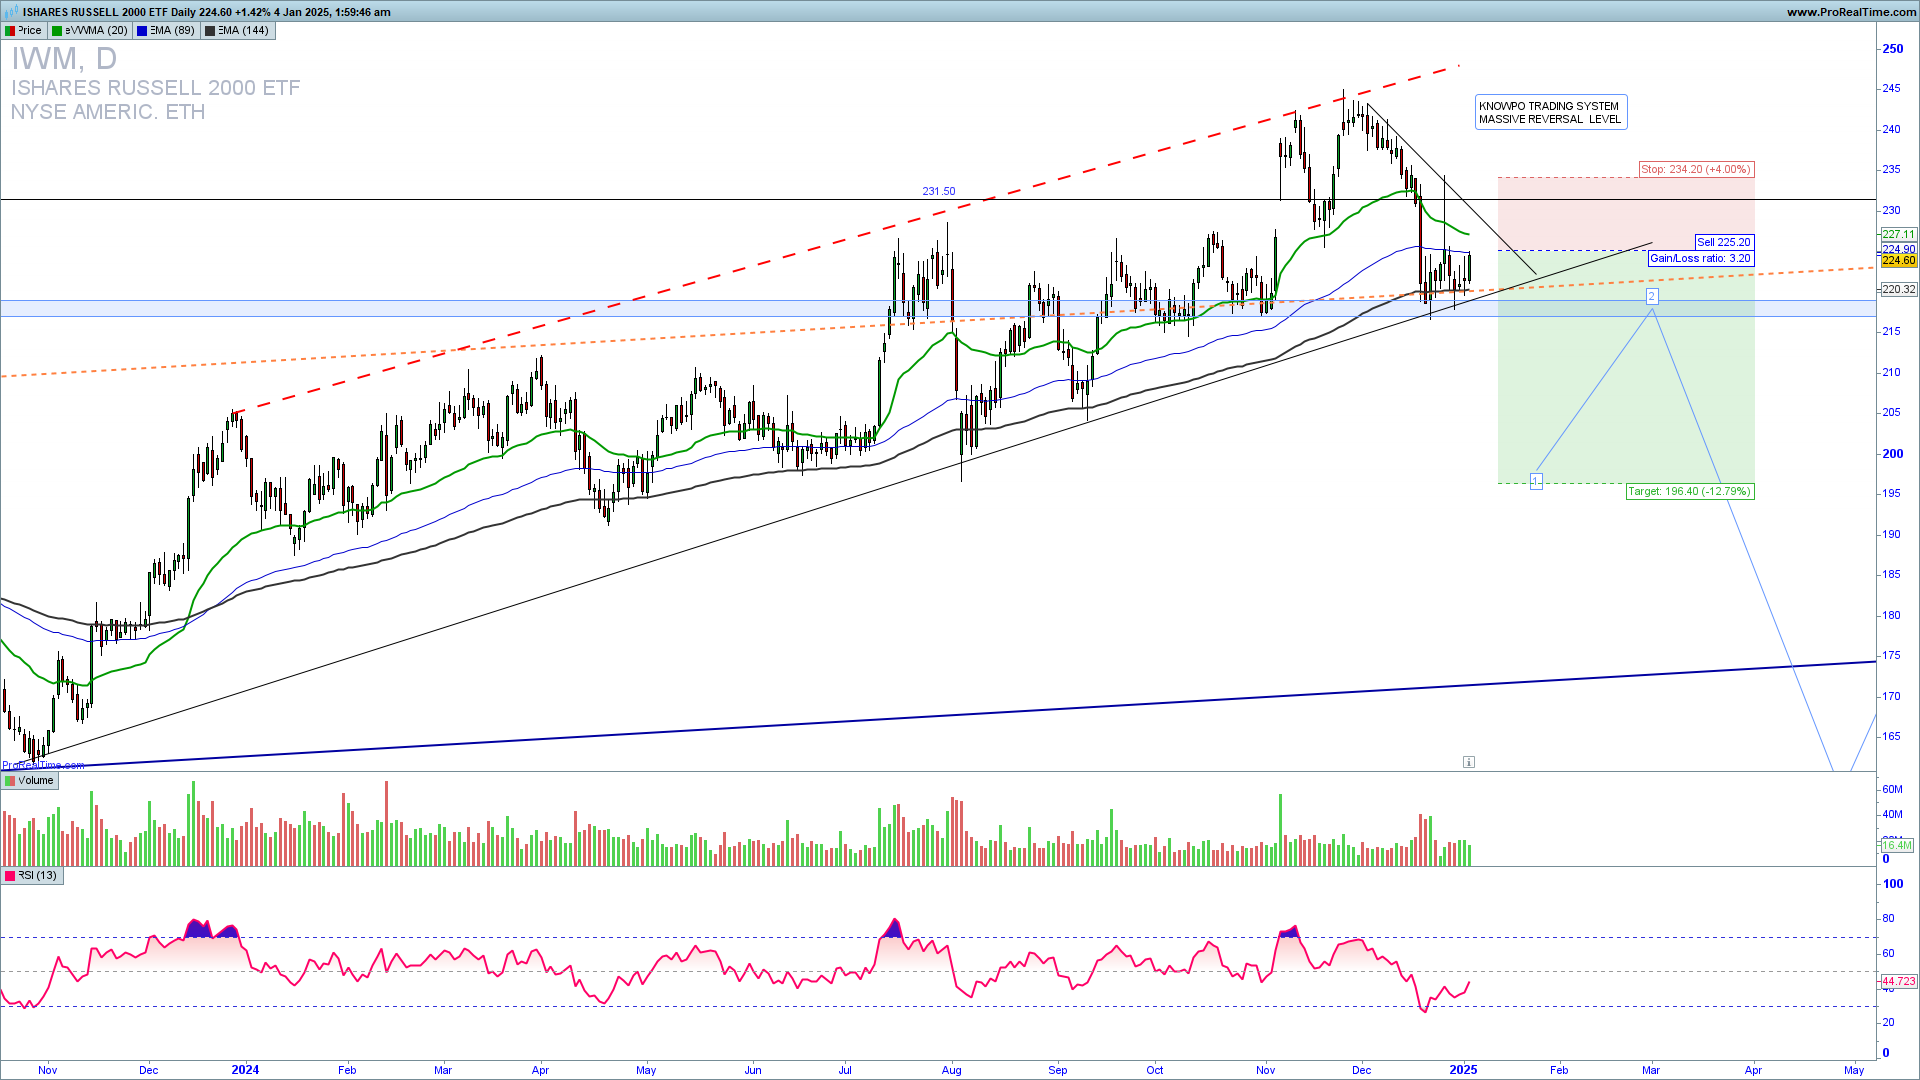
It is a fact that a strong upside resistance for Q1 2025 is 240 and If we get a confirmation of a breakout and a sustained extension above this level we could see still a strong upside continuation higher in the extended third long-term upside Elliott Wave. You can take the short trade here with a stop loss above 230. You can trade with put options as well. For inquiries about account management or copy trading please write to [email protected] or contact me on WhatsApp or Live chat.
OPTIONS TRADING TRAINING DISCOUNTED


