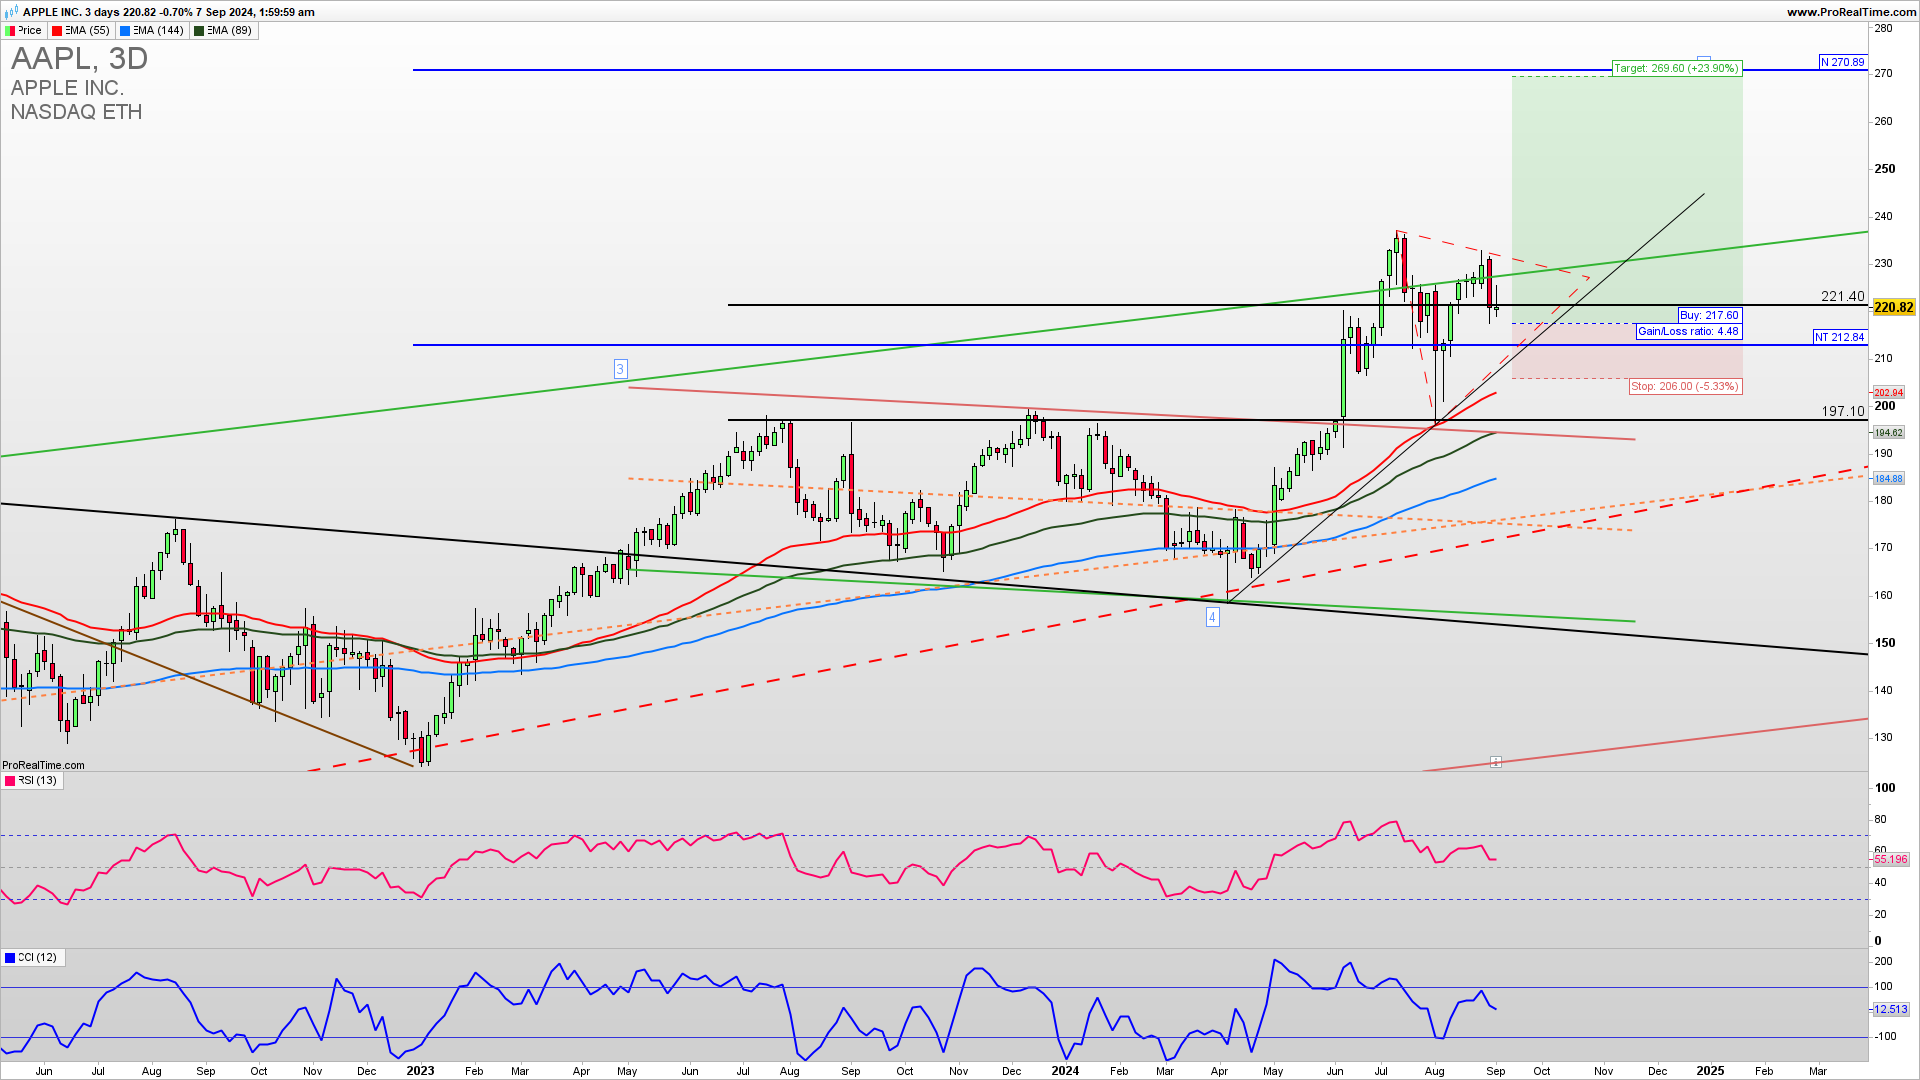
AAPL bounced strongly from the 200 level and seems to have finished the fourth wave correction before an extension higher in the fifth wave that has begun. A break above 230 is required for the extension higher in the fifth wave which has already started and an invalidation level is 197 (a break below this level would lead to an invalidation). Learn to Trade stocks profitably.
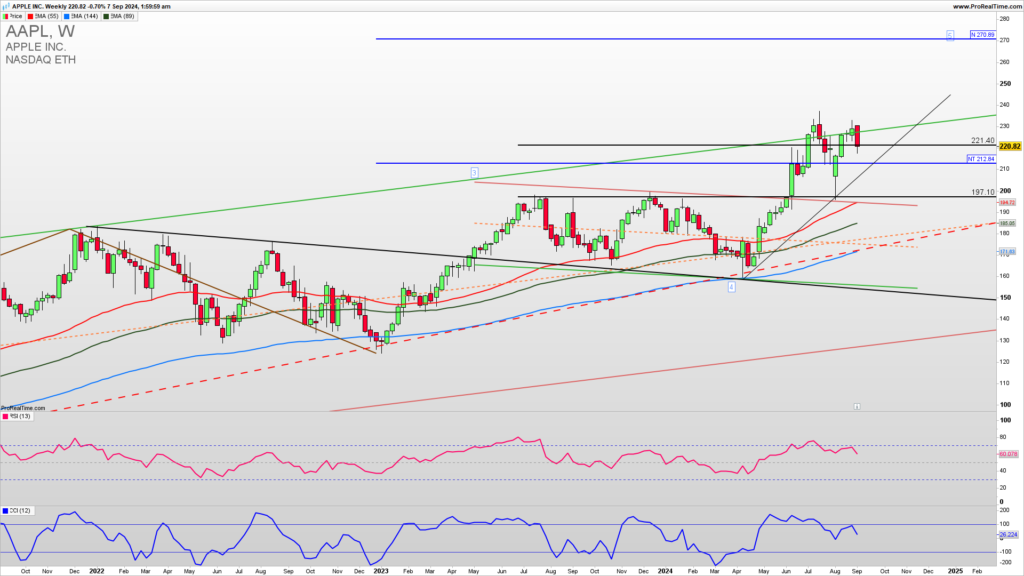
The weekly AAPL chart reveals a consolidation after testing the 230 level two times. At this point, buy positions have a higher probability of success as the AAPL is still within a well-established uptrend with a little volatility. Overall support for the upside even if it breaks below 213 is 197 and the final long-term support for a bullish trend invalidation is much lower at 160 which means that it still can develop a long and profitable fifth impulse wave higher—following the price action we need to see a break above 230 for a continuation higher and an extension to 270.
GET THE CHART OF THE DAY EVERY DAY IN YOUR INBOX

JOIN THE TRADING COMMUNITY GET ACCESS TO EVERYDAY MEGA TECH STOCKS, FUTURES AND OPTIONS UPDATES
As the famous trader says…
“The four most dangerous words in investing are: ‘this time it’s different.”
SIR JOHN TEMPLETON
How to trade this?
It is a fact that a strong upside resistance for Q3 2024 is 230 and If we get a confirmed break above this level we could see a strong upside continuation for 270 in the fifth extended long-term upside Elliott Wave. Near-term, long-trade entries have a higher probability of success. Long trade entries can be placed here or upon a dip to 212 with a stop loss below 210. For inquiries about account management please write to [email protected].