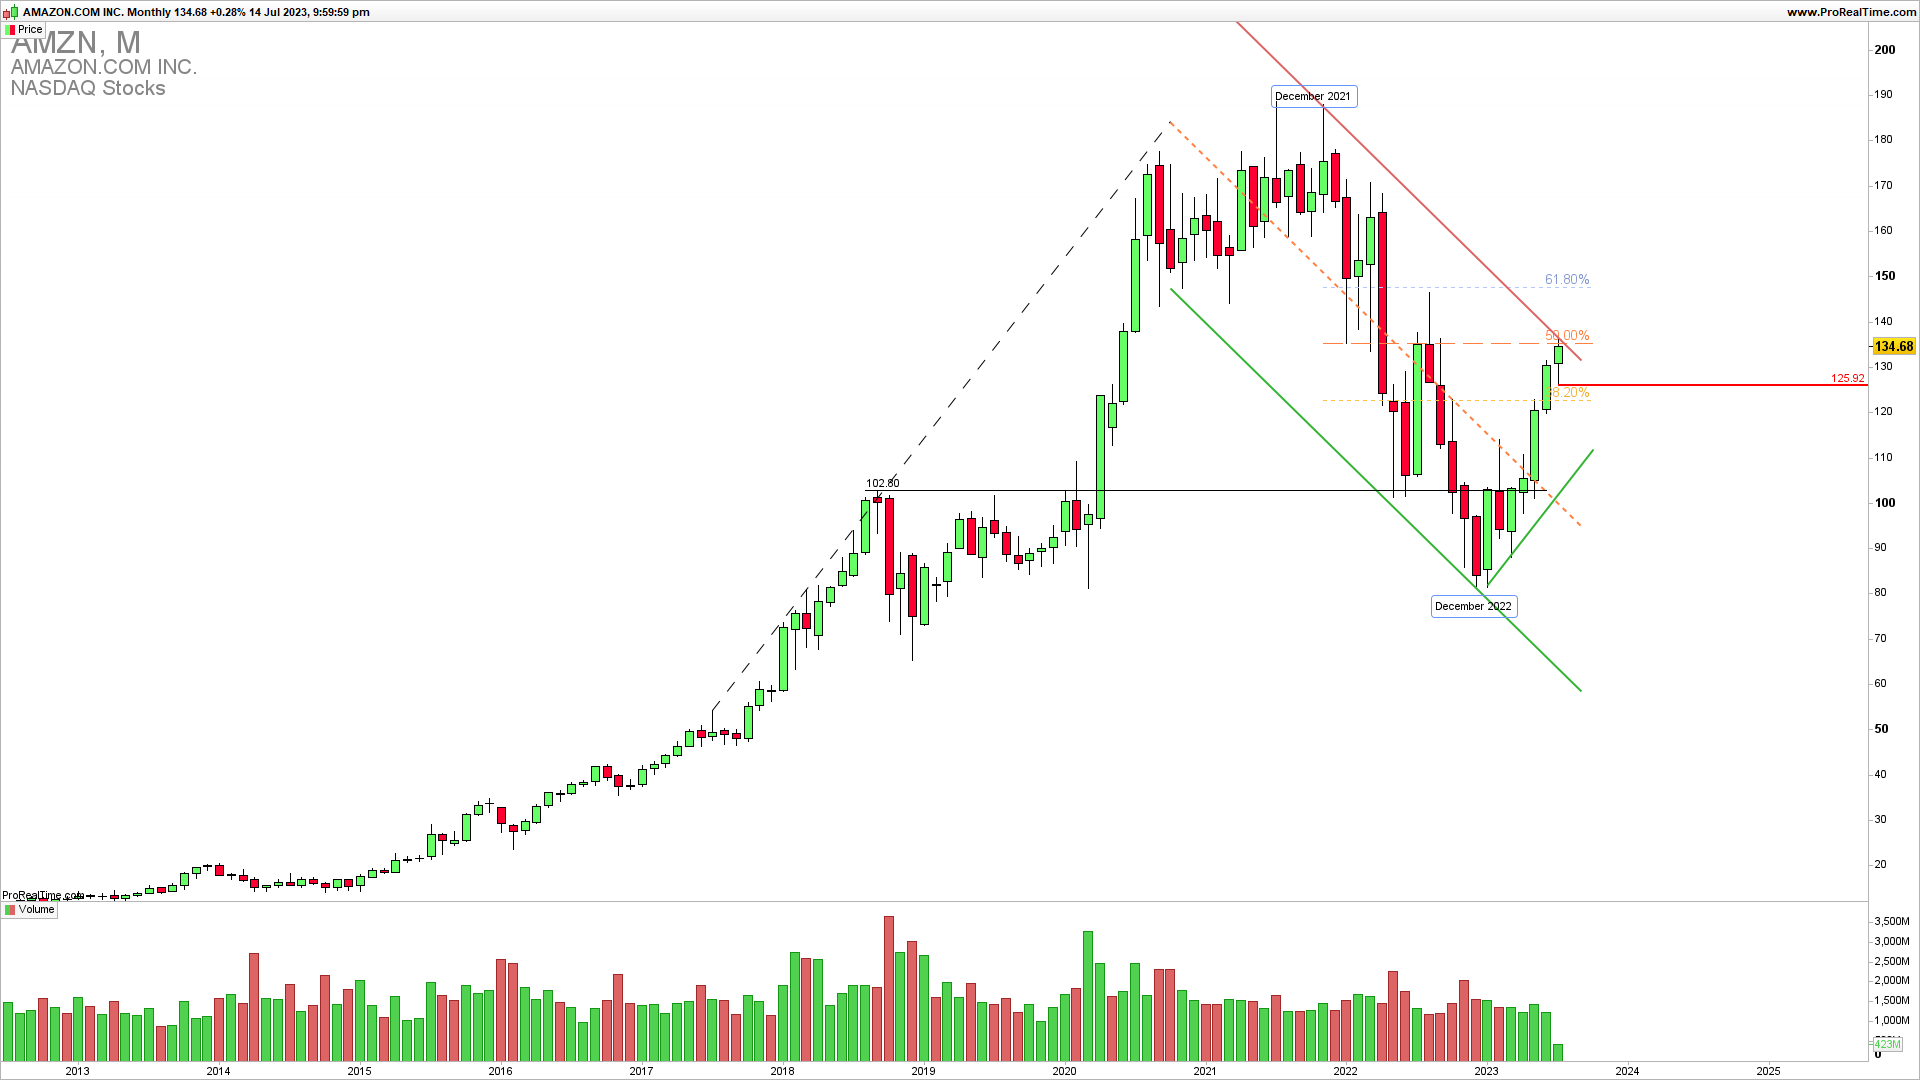
The monthly chart shows that AMZN is reaching a critical confluence of resistance level 137, a combination of the 50% Fibonacci retracement (December 2021 to December 2022 swing down) and a downside channel upper resistance. This confluence of upside resistance is coming after six months of the upside without a significant pullback. A break above this level exposes the 150 which is also 61.8% of the mentioned Fibonacci retracement.
OPTIONS TRADING INTENSIVE COURSE INTRO PRICE
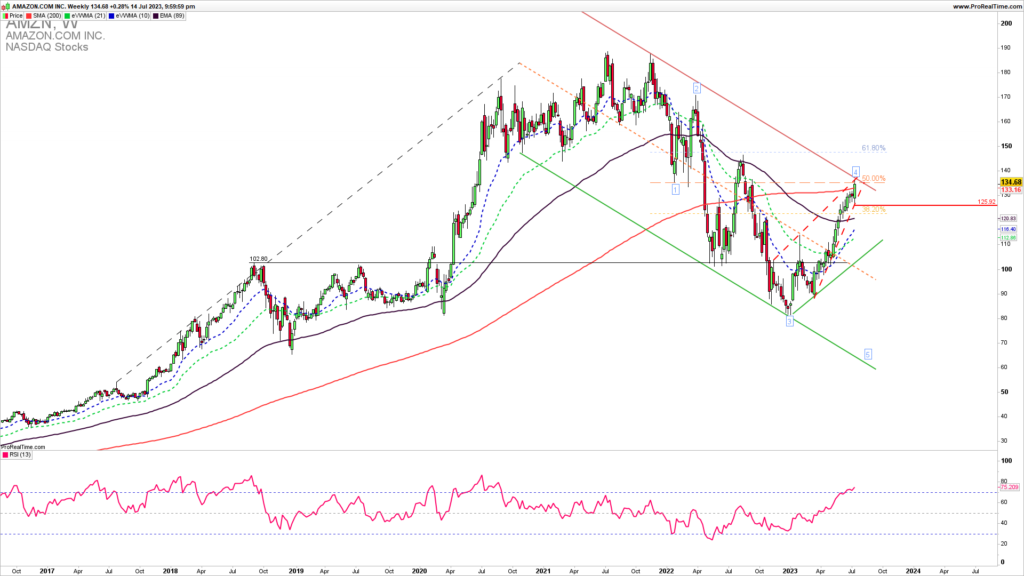
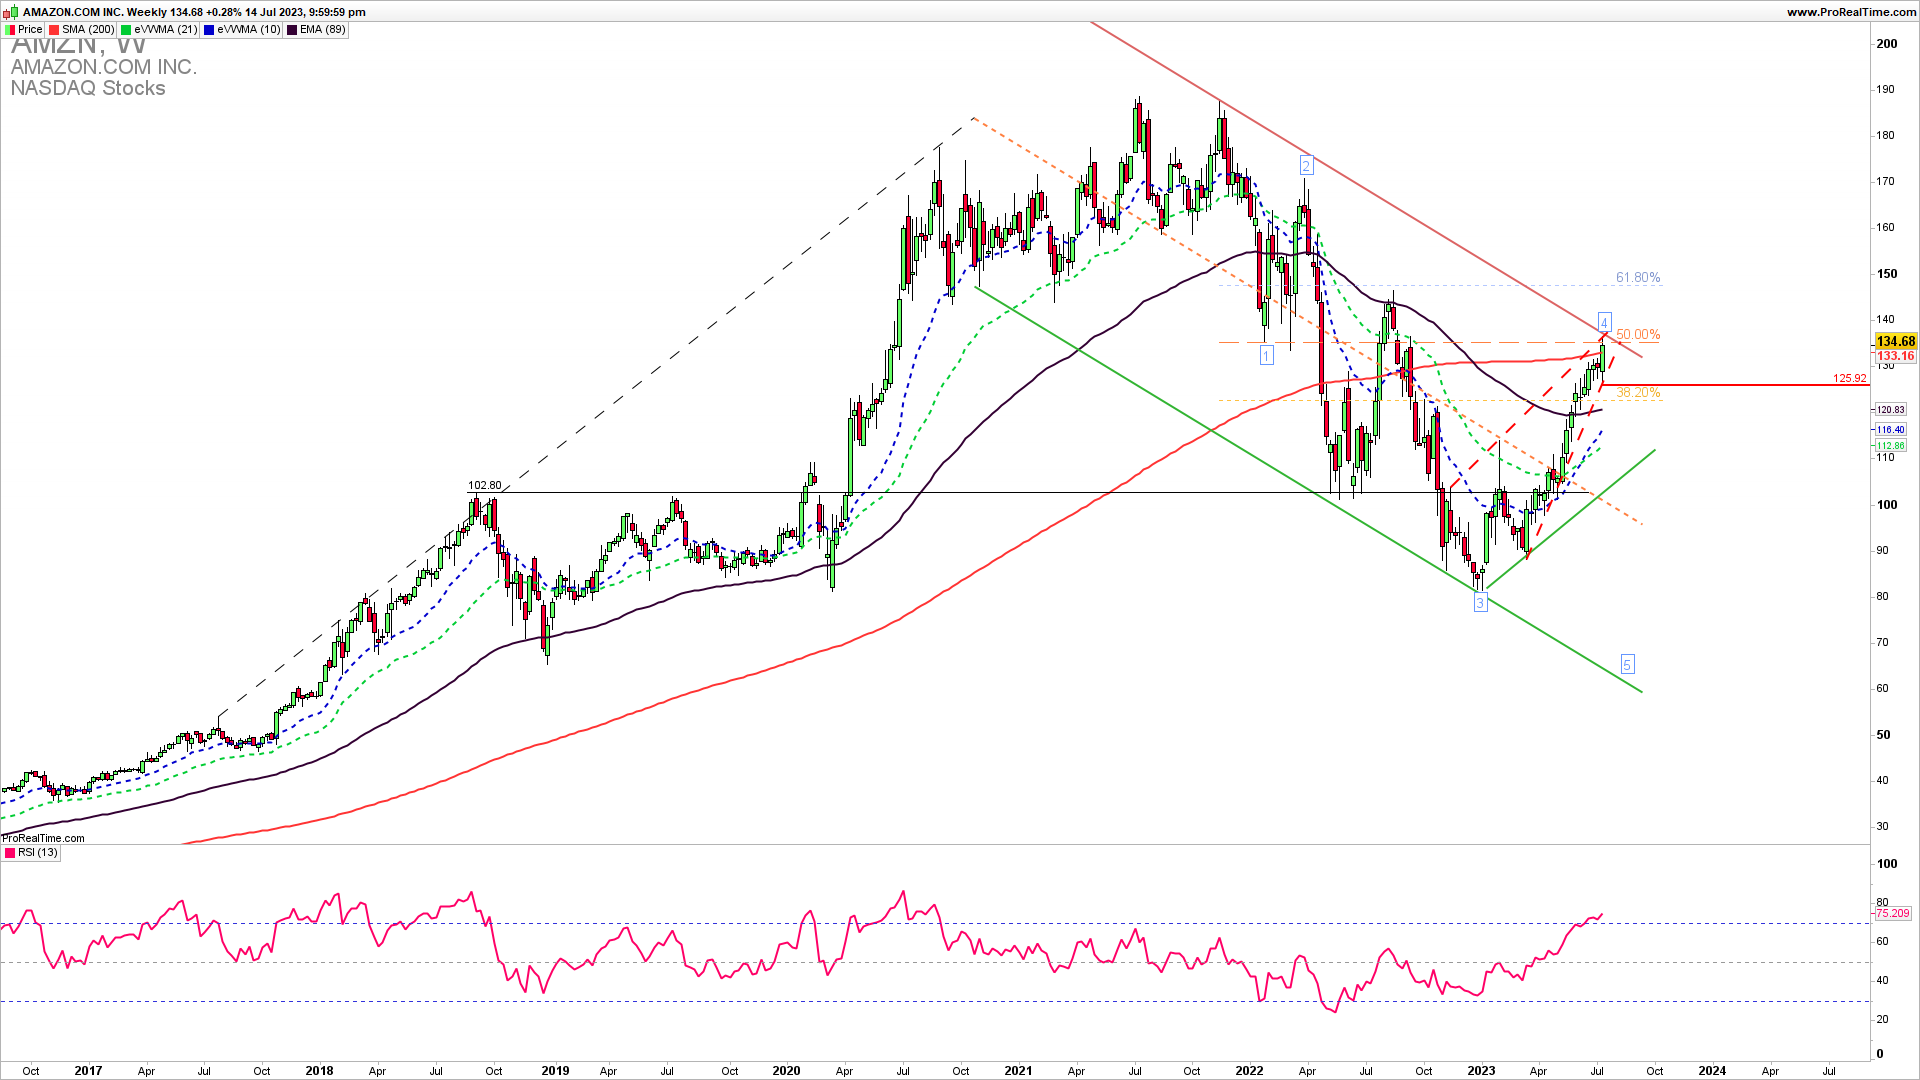
The Weekly AMZN chart reveals a rising wedge after a clean three waves down and could mark the end of the fourth wave pullback if it will not be invalidated by a clean break above 137. This is an upside wedge resistance of a long-term rising wedge. A break below 127 is required to confirm that the fourth pullback wave is finished and that we are close to a complete reversal for the last fifth wave. As said a confirmed break above 137 exposes a test of 150. This would be a strong bullish signal.
GET THE CHART OF THE DAY EVERY DAY IN YOUR INBOX
As the famous trader says…
” Throughout my financial career, I have continually witnessed examples of other people that I have known being ruined by a failure to respect risk. If you don’t take a hard look at risk, it will take you.”Larry Hite
How to trade this?
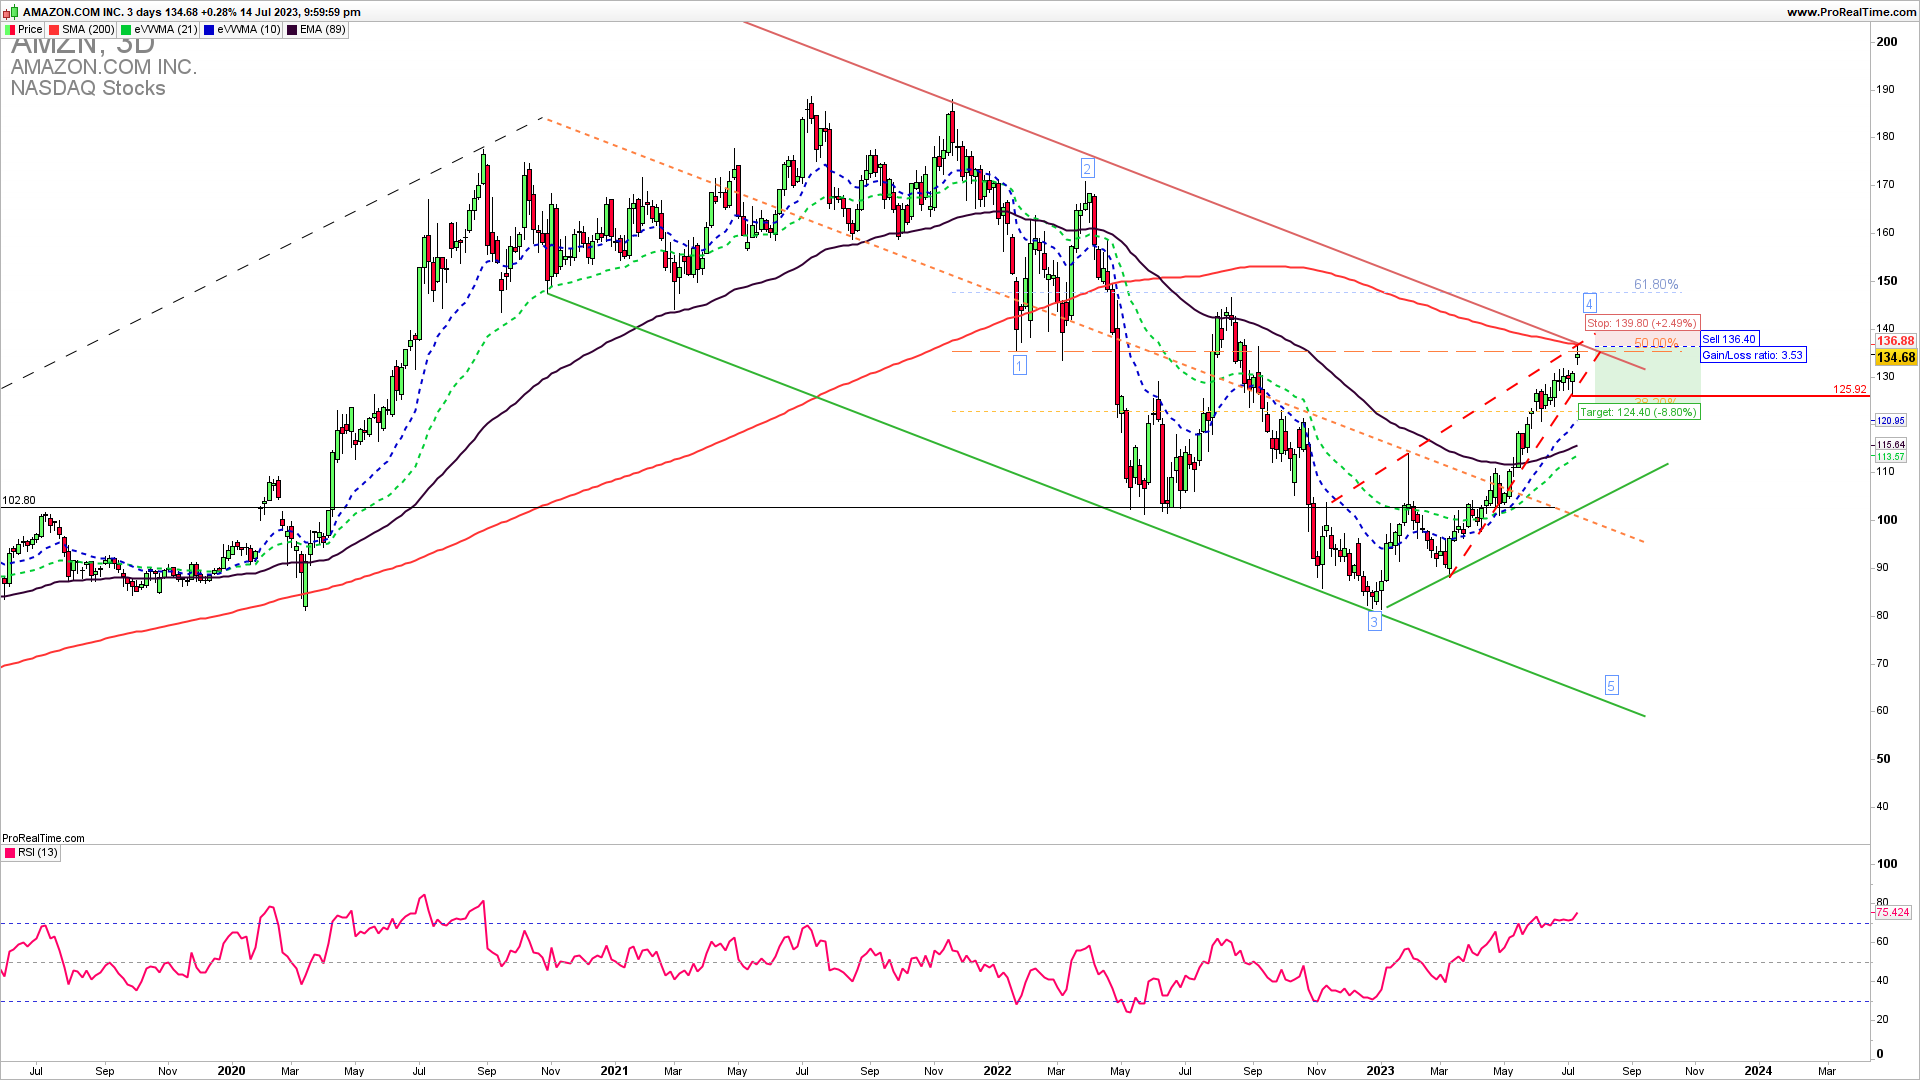
It is a fact that a strong upside resistance for Q3 is 137 and we are seeing a test of it. As long as this resistance is holding in the coming weeks we could see a reversal lower to test at least 125. A break below this level would mean a complete reversal and a break below the rising wedge line. Near-term long-trade entries have a lower probability of success, and now short trades have a greater risk to reward and a higher probability of success. You can place a short trade entry during the NY session on Monday or buy put options. The target is 125, the risk to reward is above and stops should be above 137.

