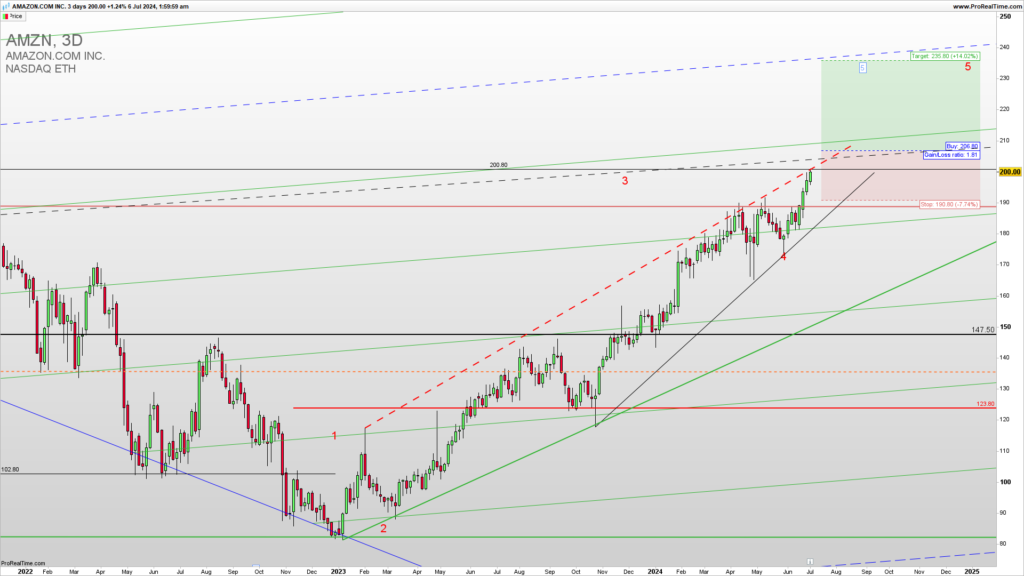
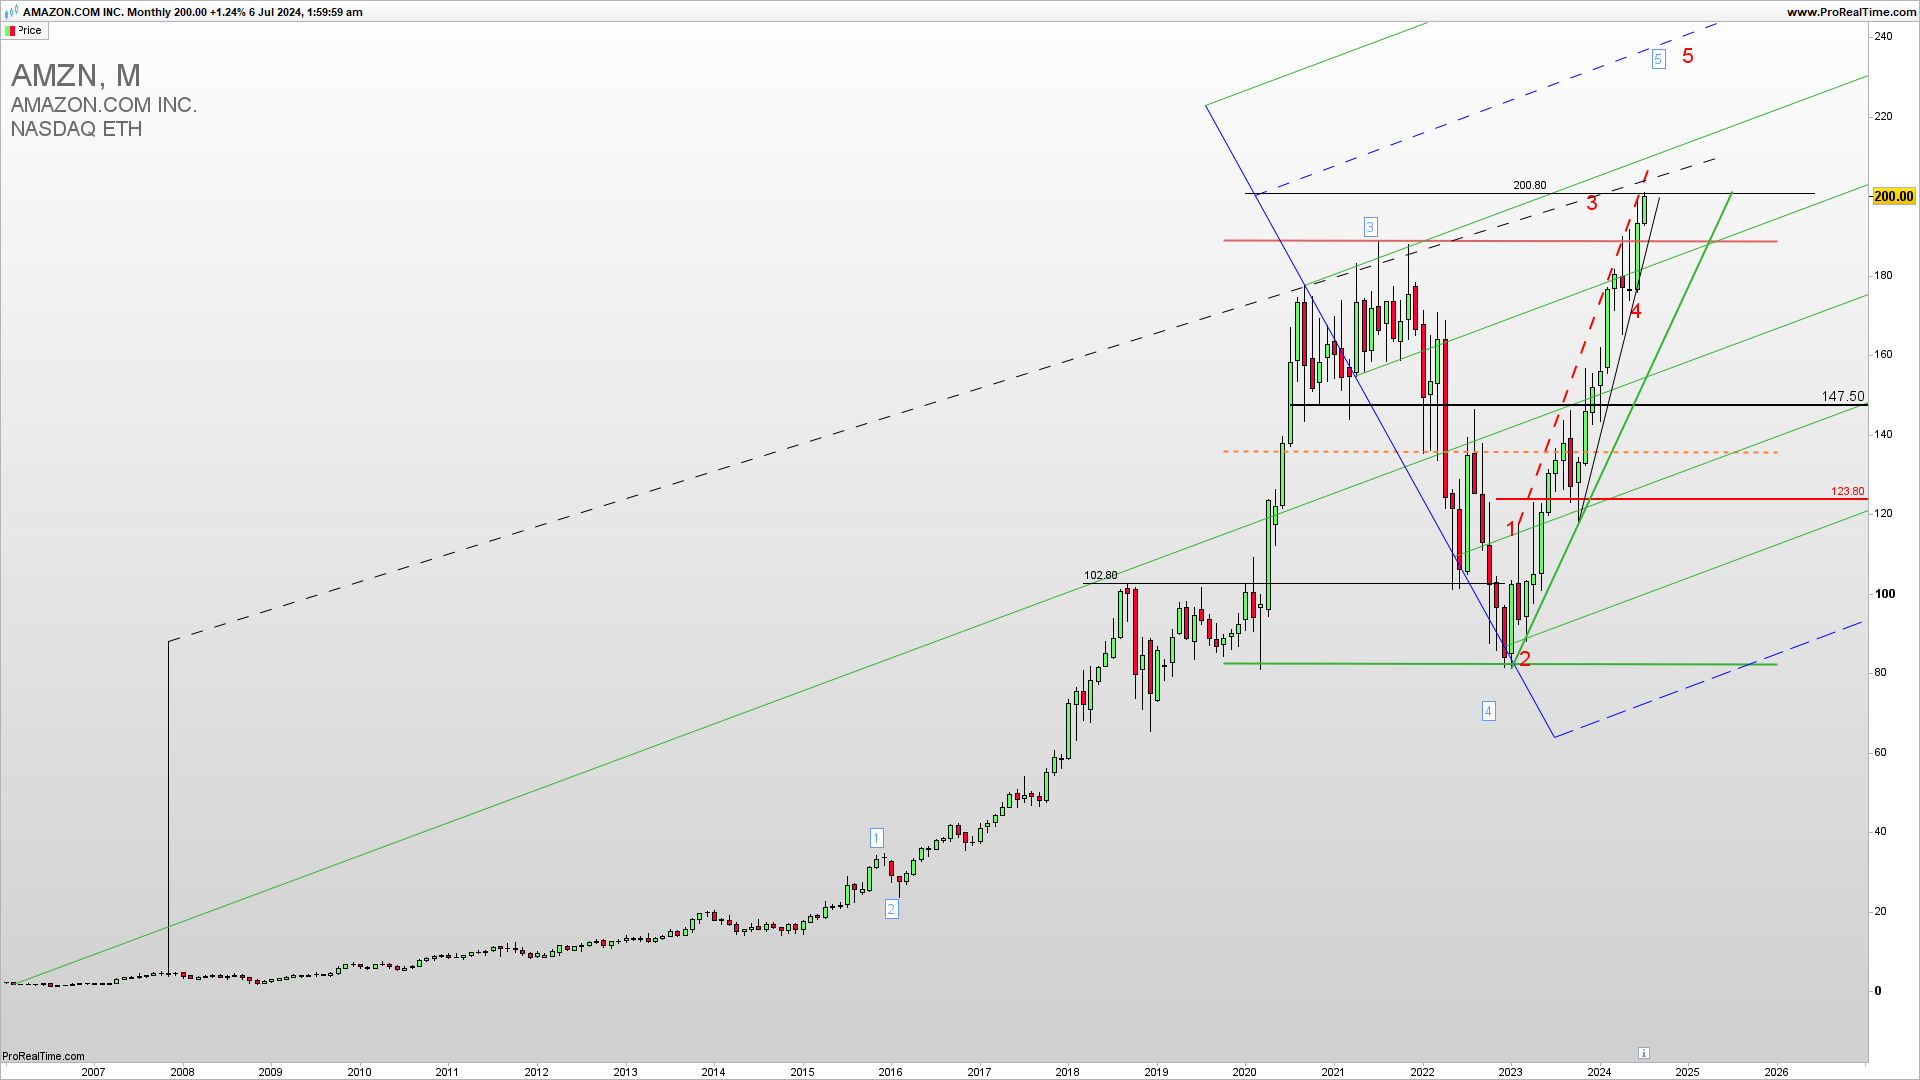
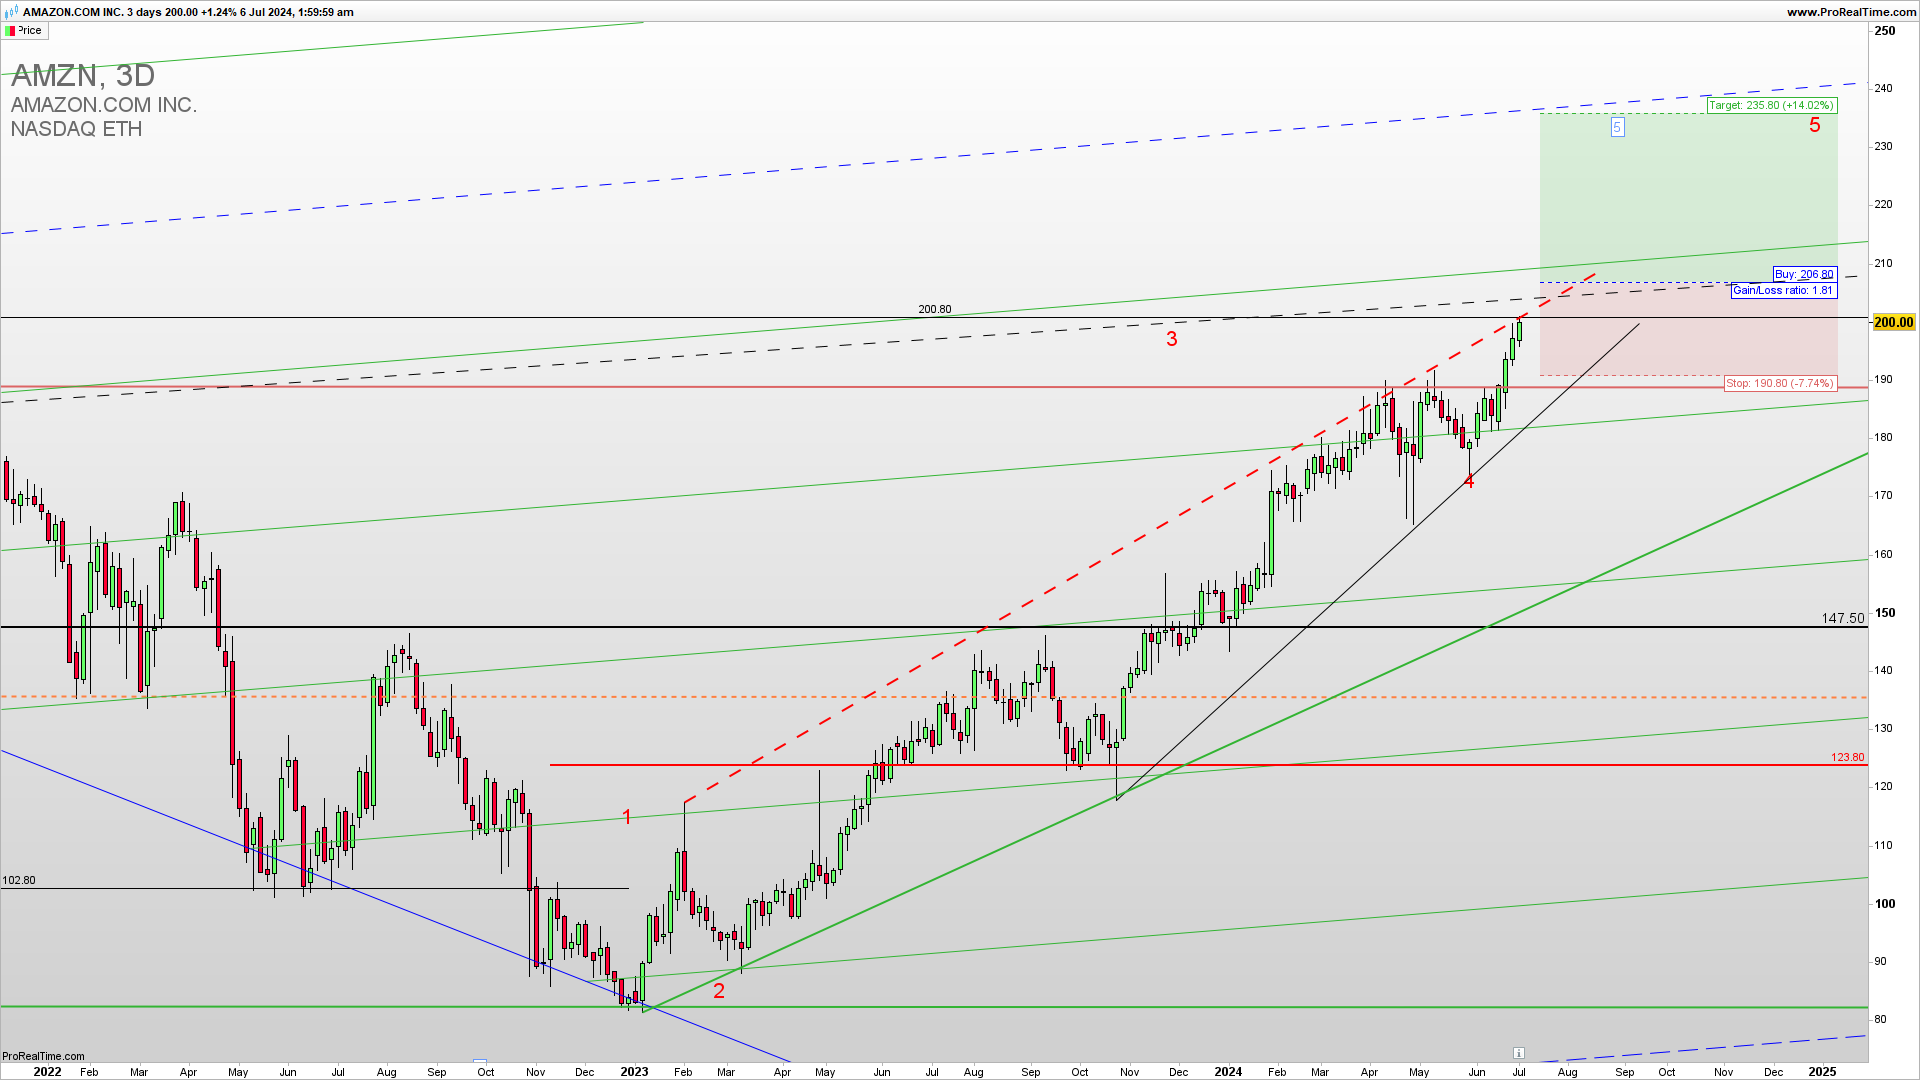
AMZN is heading for a test of 200 which is a strong resistance for a continuation higher. A confirmed break above this resistance will lead to a continuation higher in the fifth wave to 240. The next resistance is 220. Learn to Trade Stocks profitably.
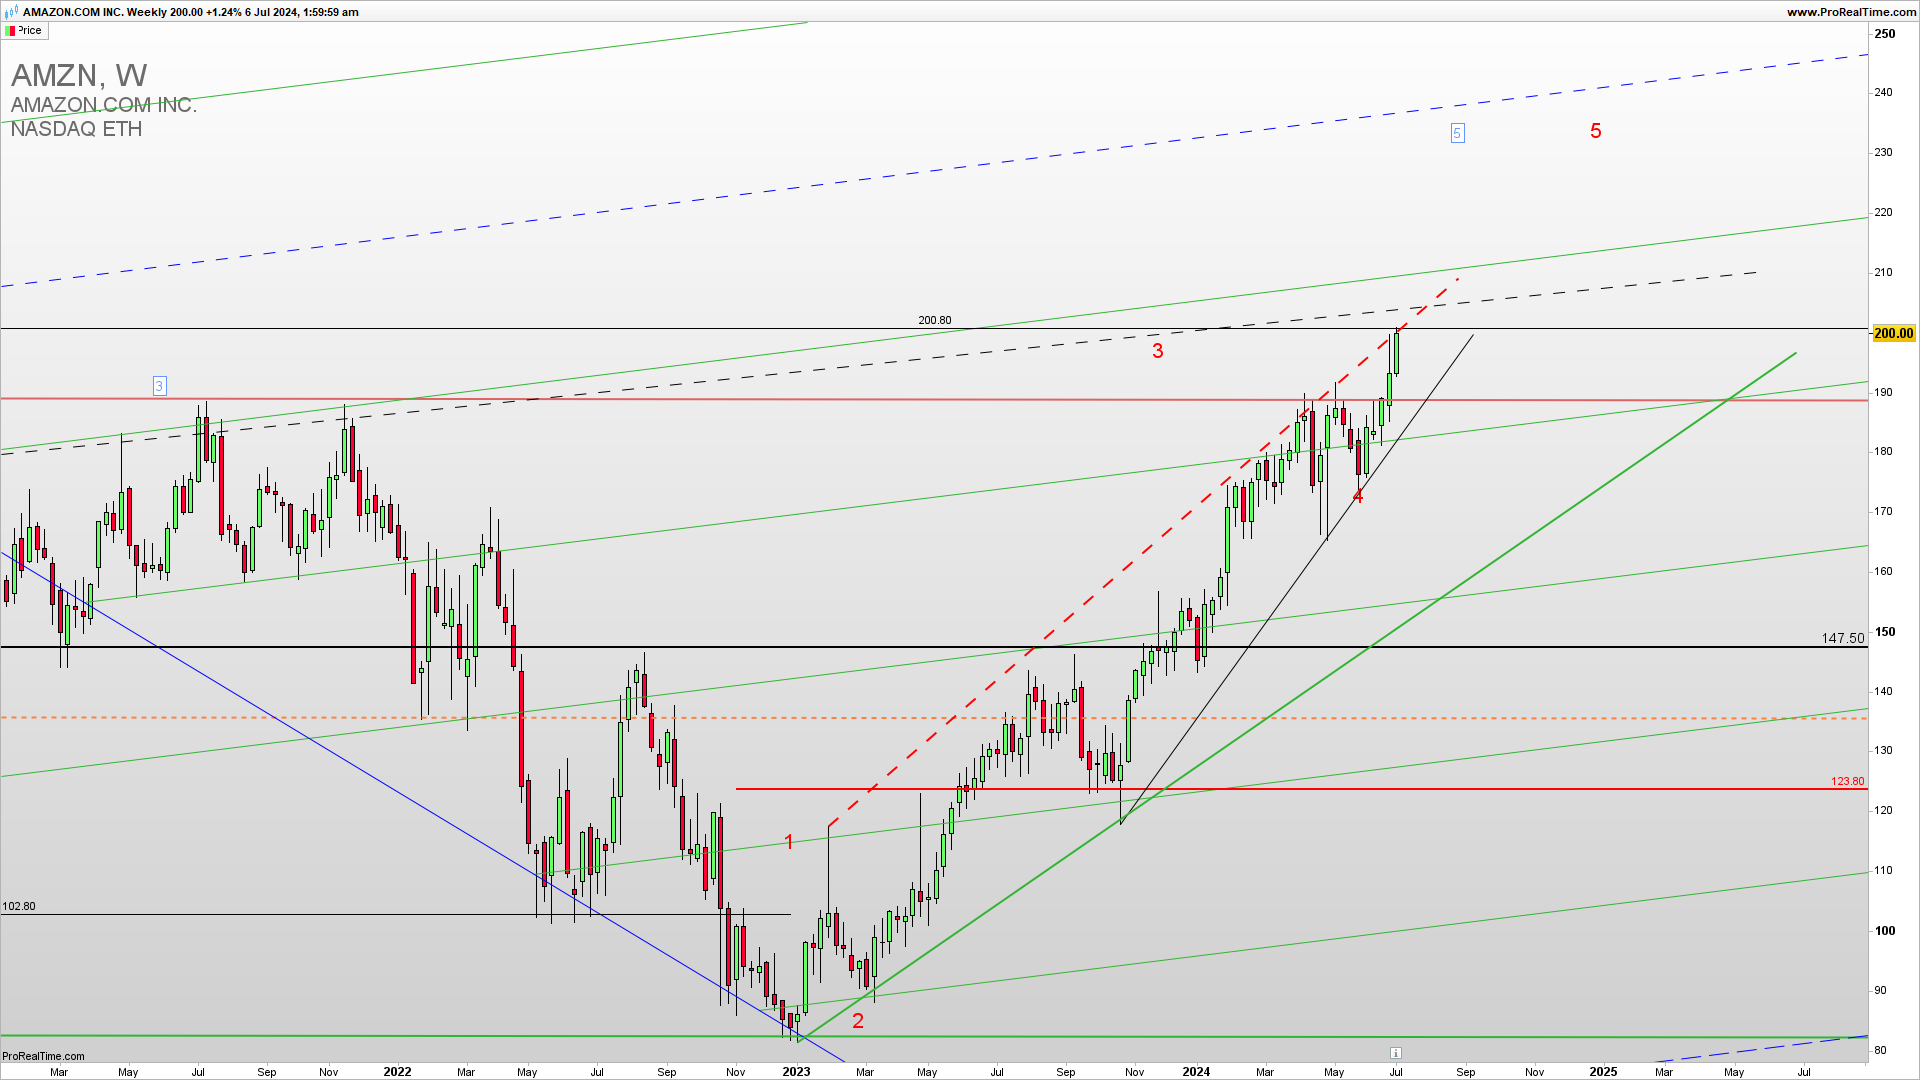
The Weekly AMZN chart reveals a test of the rising wedge breakout resistance mentioned at level 200. At this point, both sell and buy positions are possible as the AMZN is still below the strong upside extension level of 200. Overall support for the upside even if it breaks below 190 is 160 and long-term support for a bullish trend invalidation is 138.
GET THE CHART OF THE DAY EVERY DAY IN YOUR INBOX
As the famous trader says…
“The elements of good trading are: (1) cutting losses, (2) cutting losses, and (3) cutting losses. If you can follow these three rules, you may have a chance”
Ed Seykota
How to trade this?
It is a fact that a strong upside resistance for Q3 2024 is 200 and If we get a confirmed break above this level we could see a strong upside continuation in a fifth long-term upside Elliott Wave. Near-term, long-trade entries have a higher probability of success. Long trade entries can be placed upon a break above 200 or a call option buying with a stop loss below 195 with a first target of 220 and if broken second target is 240. The short-trade entry can be tried in the case of a break below 188. For inquiries about account management please write to [email protected].


