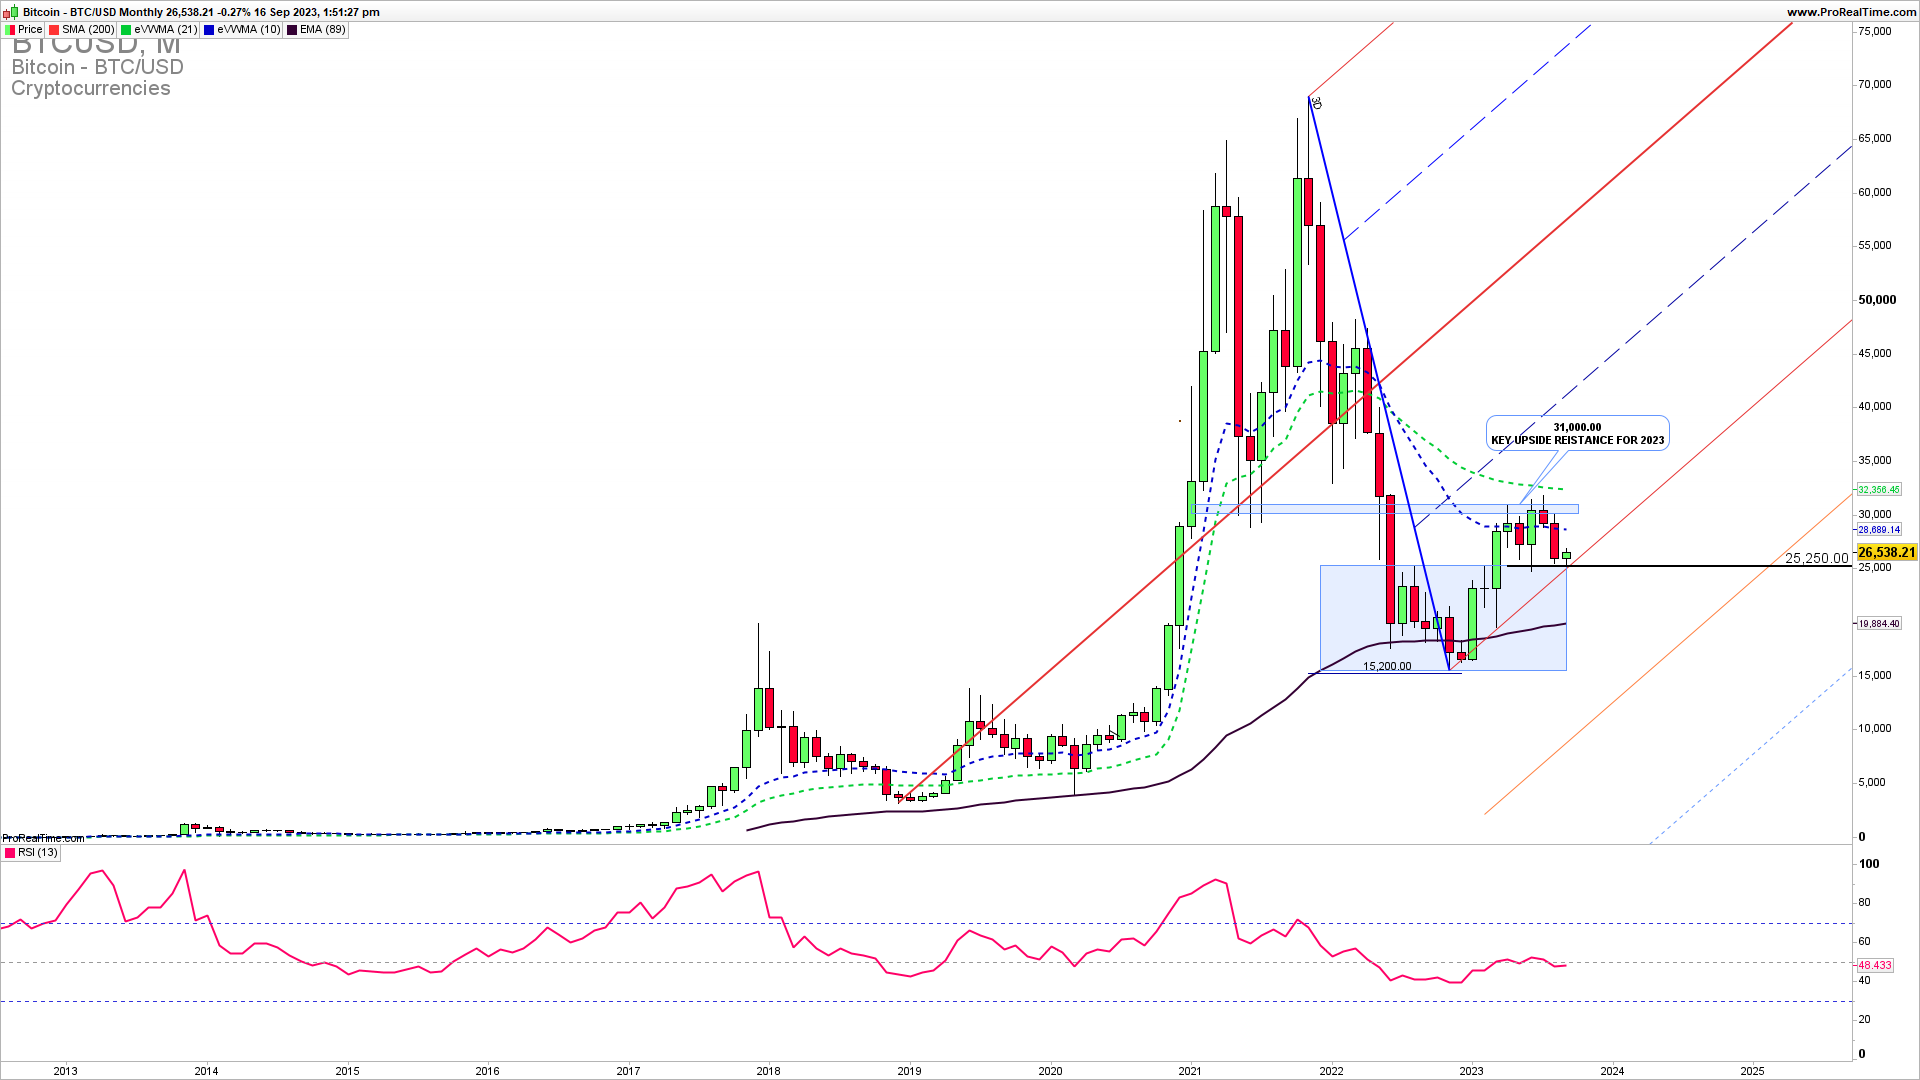
The monthly chart shows that Bitcoin is between long-term support and resistance. As it has been indicated on the chart 31000 is the key upside resistance for 2023. Key support is 25000 and the bears would be in control for one more swing down in the case we got a confirmed break below 25000. For a continuation higher and a complete reversal after the April 2022 – December 2022 slump.
SPECIAL LAST SEPTEMBER OFFER MENTORING $300
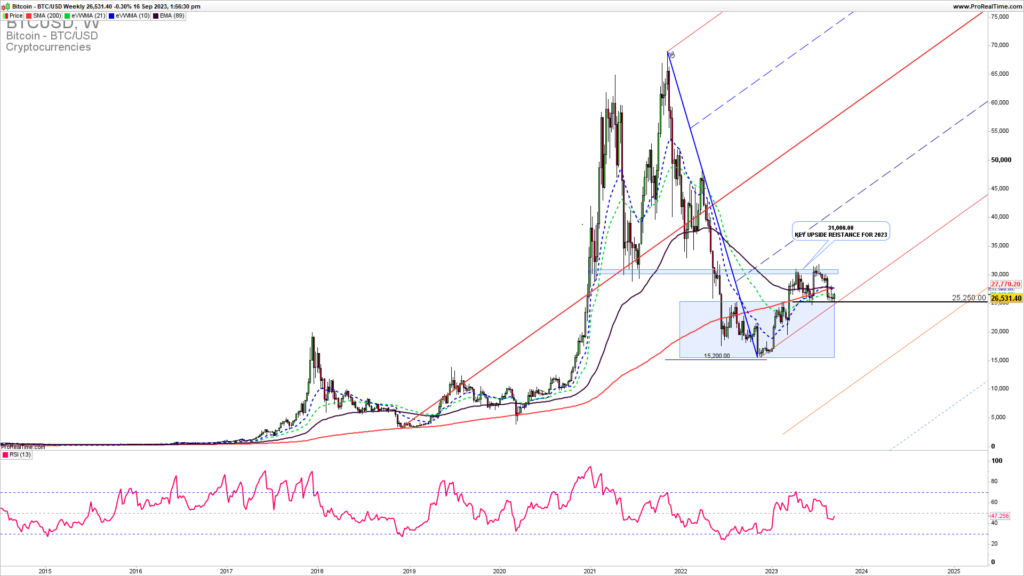
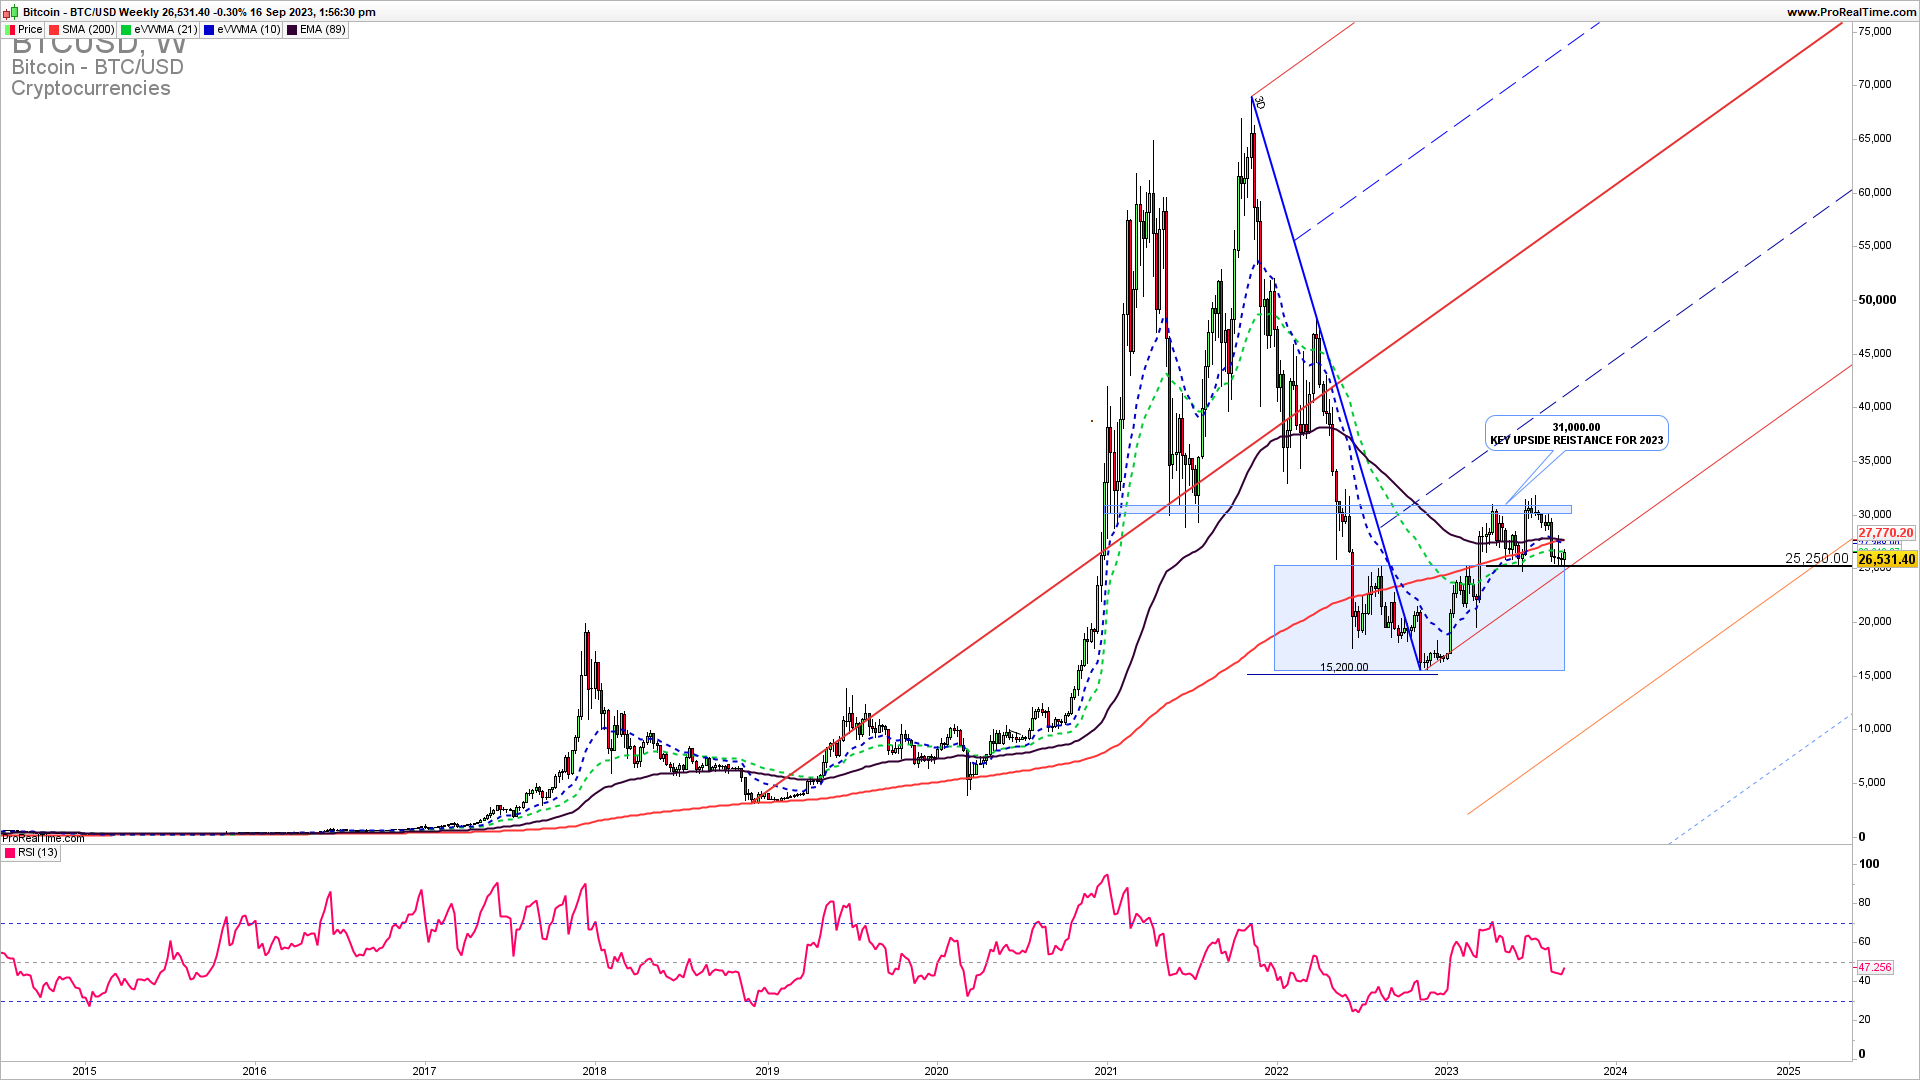
The Weekly Bitcoin chart reveals a strong uptrend channel and horizontal support confluence of 25000. This is the first vital line of defense for the existing uptrend supported by a rising uptrend line and a horizontal support line and it is also a breakout point in the case we got a confirmed break below. This zone should hold for the extension higher. A bounce here followed by a break above 27700 could lead to an upside continuation.
GET THE CHART OF THE DAY EVERY DAY IN YOUR INBOX
As the famous trader says…
“Are you willing to lose money on a trade? If not, then don’t take it. You can only win if you’re not afraid to lose. And you can only do that if you truly accept the risks in front of you.”SAMI ABUSAD
How to trade this?
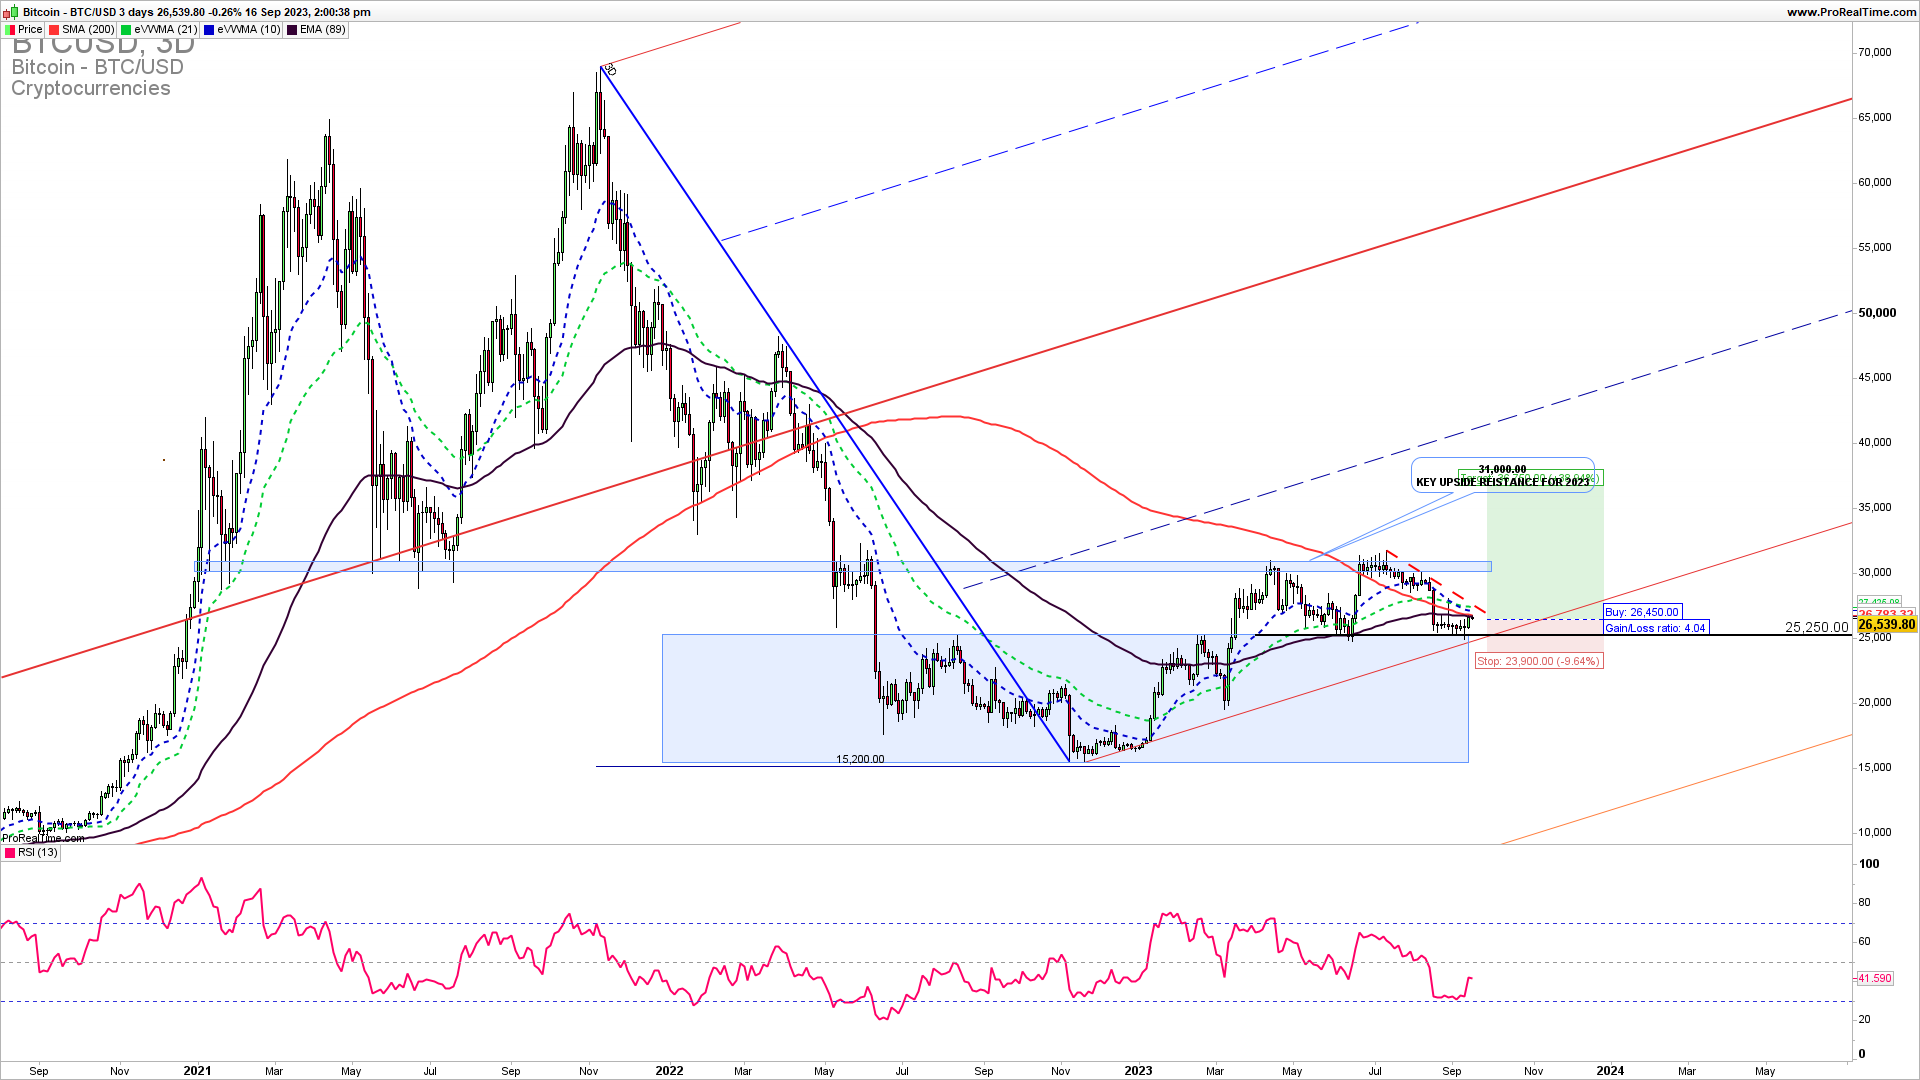
It is a fact that a strong upside resistance for Q3 is 31000. If we get a confirmed extension higher in the coming weeks above 27700 we could see an extension higher and a test of 31000 soon. A break below 25000 would mean a complete turnaround. Near-term, long-trade entries have a higher probability of success. There is a possibility of long trade entry and short trade here. We can open the long trade here with a bit of risk and stop the loss below 25000 and the short trade if we get stopped from the long trade.


