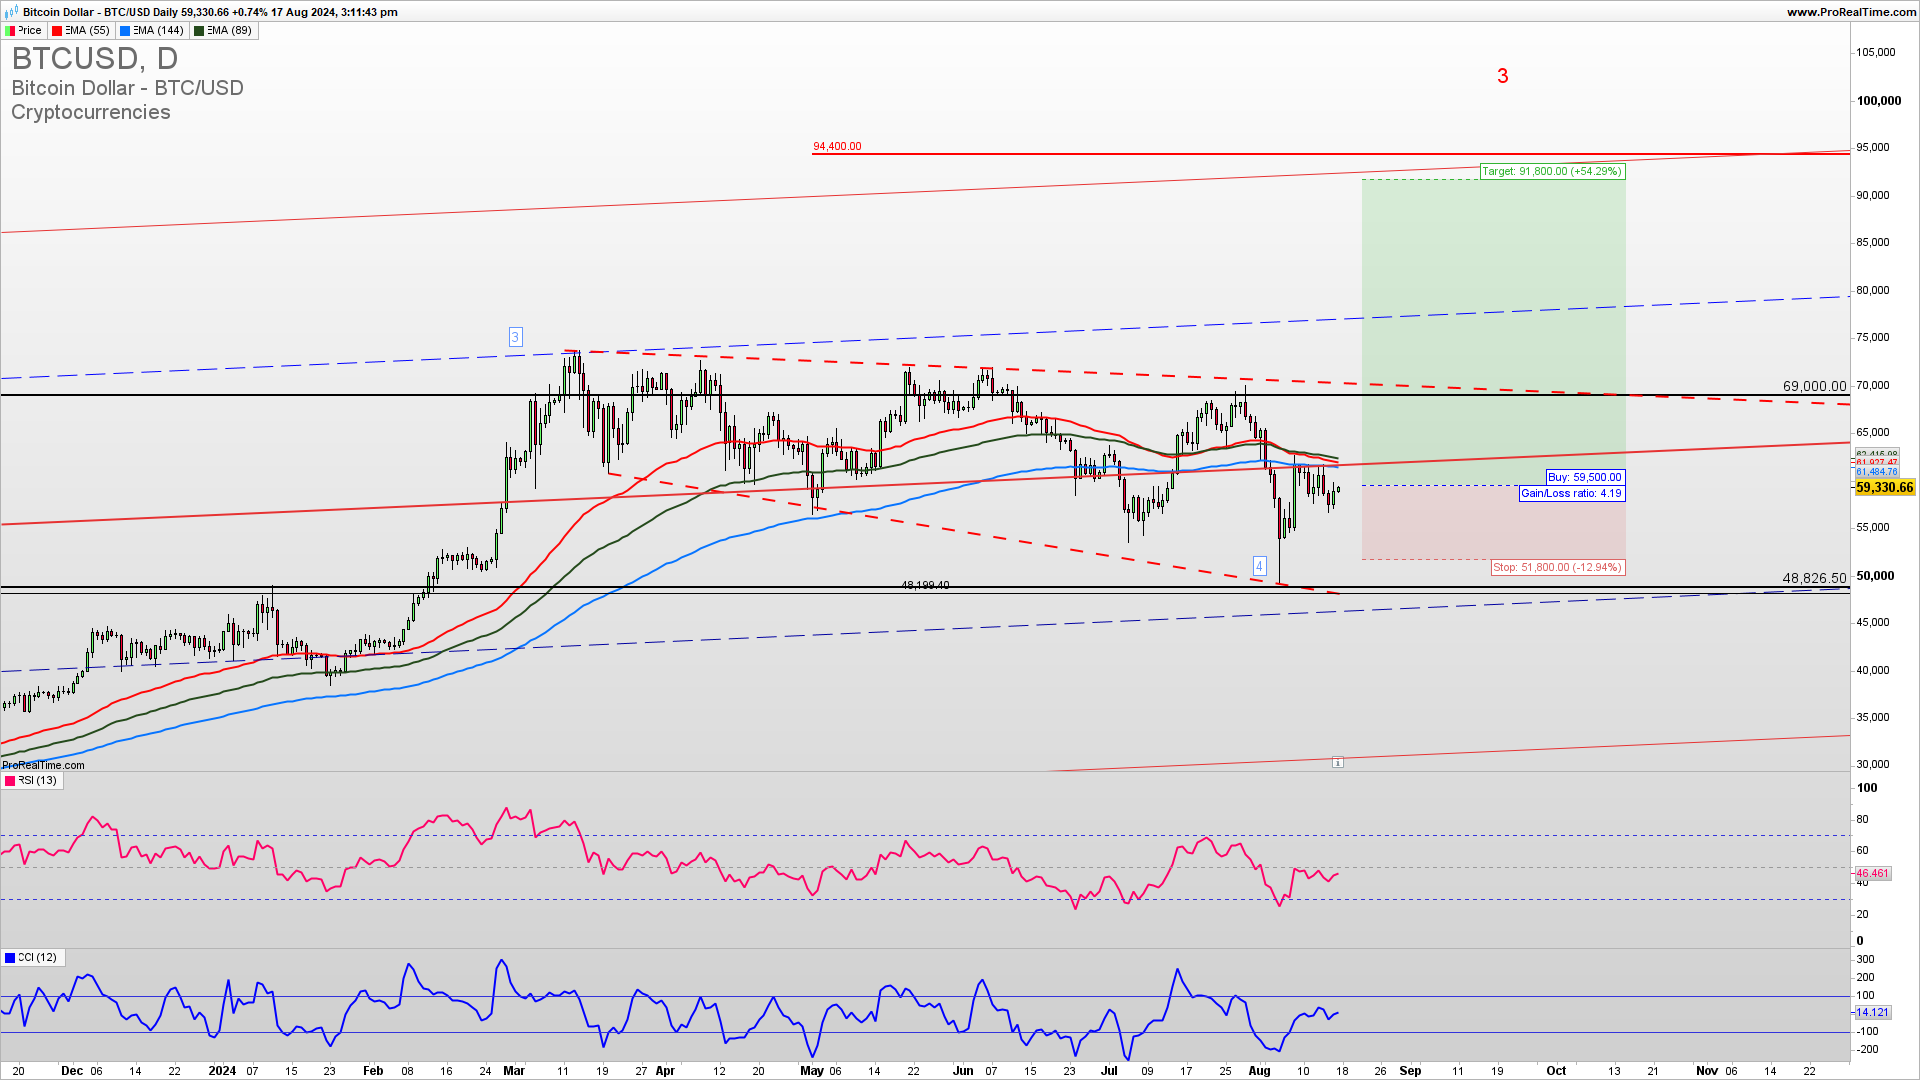
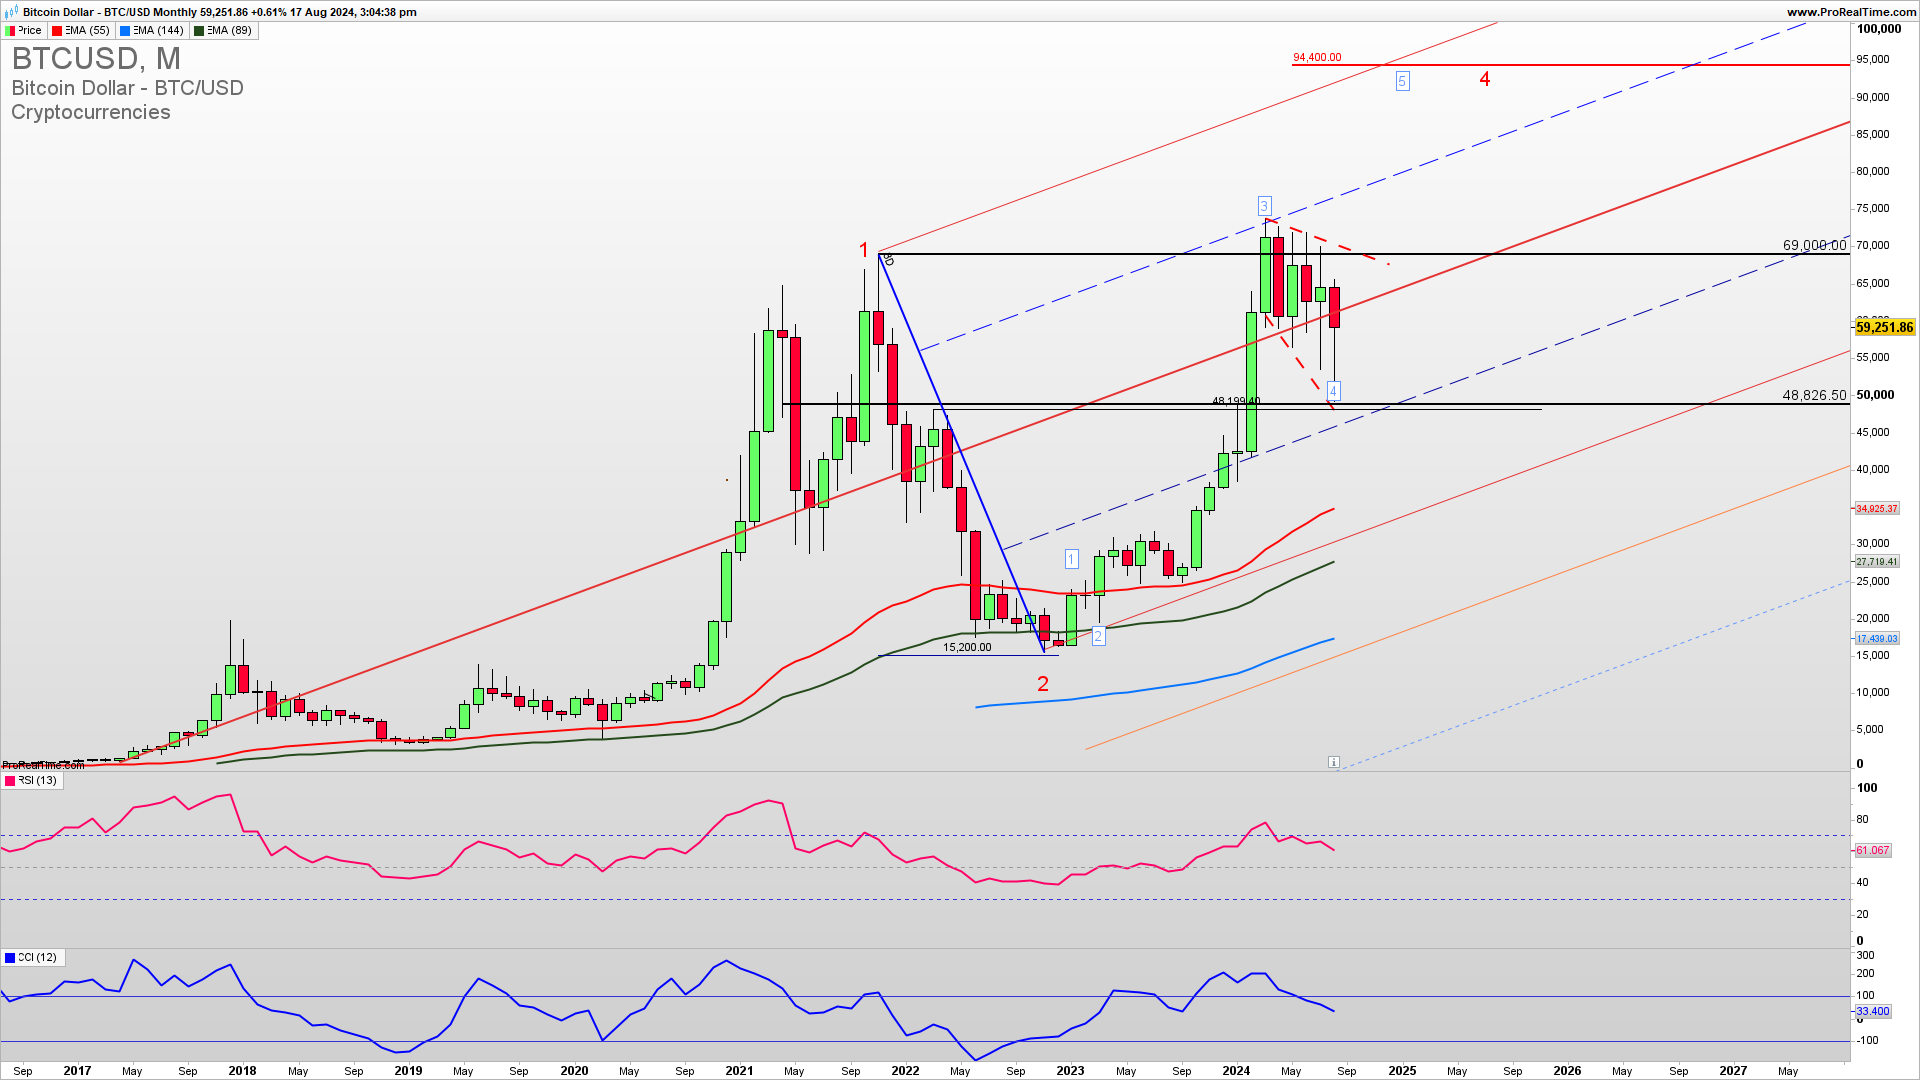
Bitcoin pulled back for a test of 49000 a previous strong upside resistance. This level should be now established as a long-term support for a continuation higher in a fifth wave to target 100k which is also the top of the Andrews Pitchfork nice uptrend channel. Learn to Trade Crypto profitably.
MENTORING WITH FUNDED ACCOUNT 40% OFF !
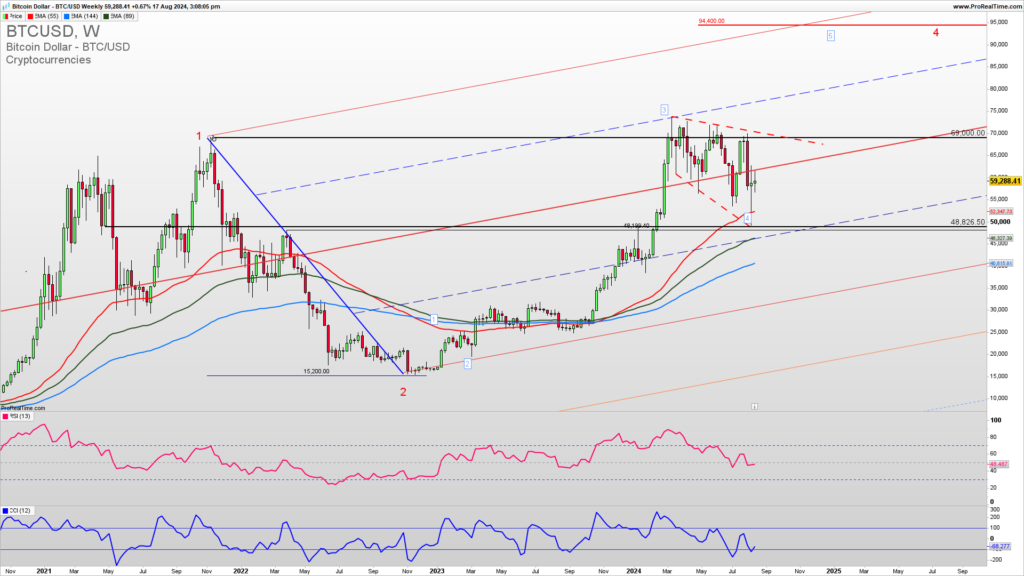
The weekly Bitcoin chart reveals a bounce from the expanding wedge support mentioned 49000 level and is going for an important upside resistance test of a 69000 level. At this point, buy positions have more probability of success as the Bitcoin is still within a recent uptrend. Overall support for the upside even if it breaks below 49000 is 40000 and that is also a final long-term support for a bullish trend invalidation. Following the price action we need to see a break above 61800 for a test of 69000.
GET THE CHART OF THE DAY EVERY DAY IN YOUR INBOX

As the famous trader says…
“Losers average losers.”
Paul Tudor Jones
How to trade this?
It is a fact that a strong upside resistance for Q3 2024 is 69000 and If we get a confirmed break above this level we could see a strong upside continuation for 100k high in a fifth long-term upside Elliott Wave. Near-term, long-trade entries have a higher probability of success. Long trade entries can be placed here with a stop loss below 52000. The short-trade entry can be tried in the case of a break below 48000. For inquiries about account management please write to [email protected].