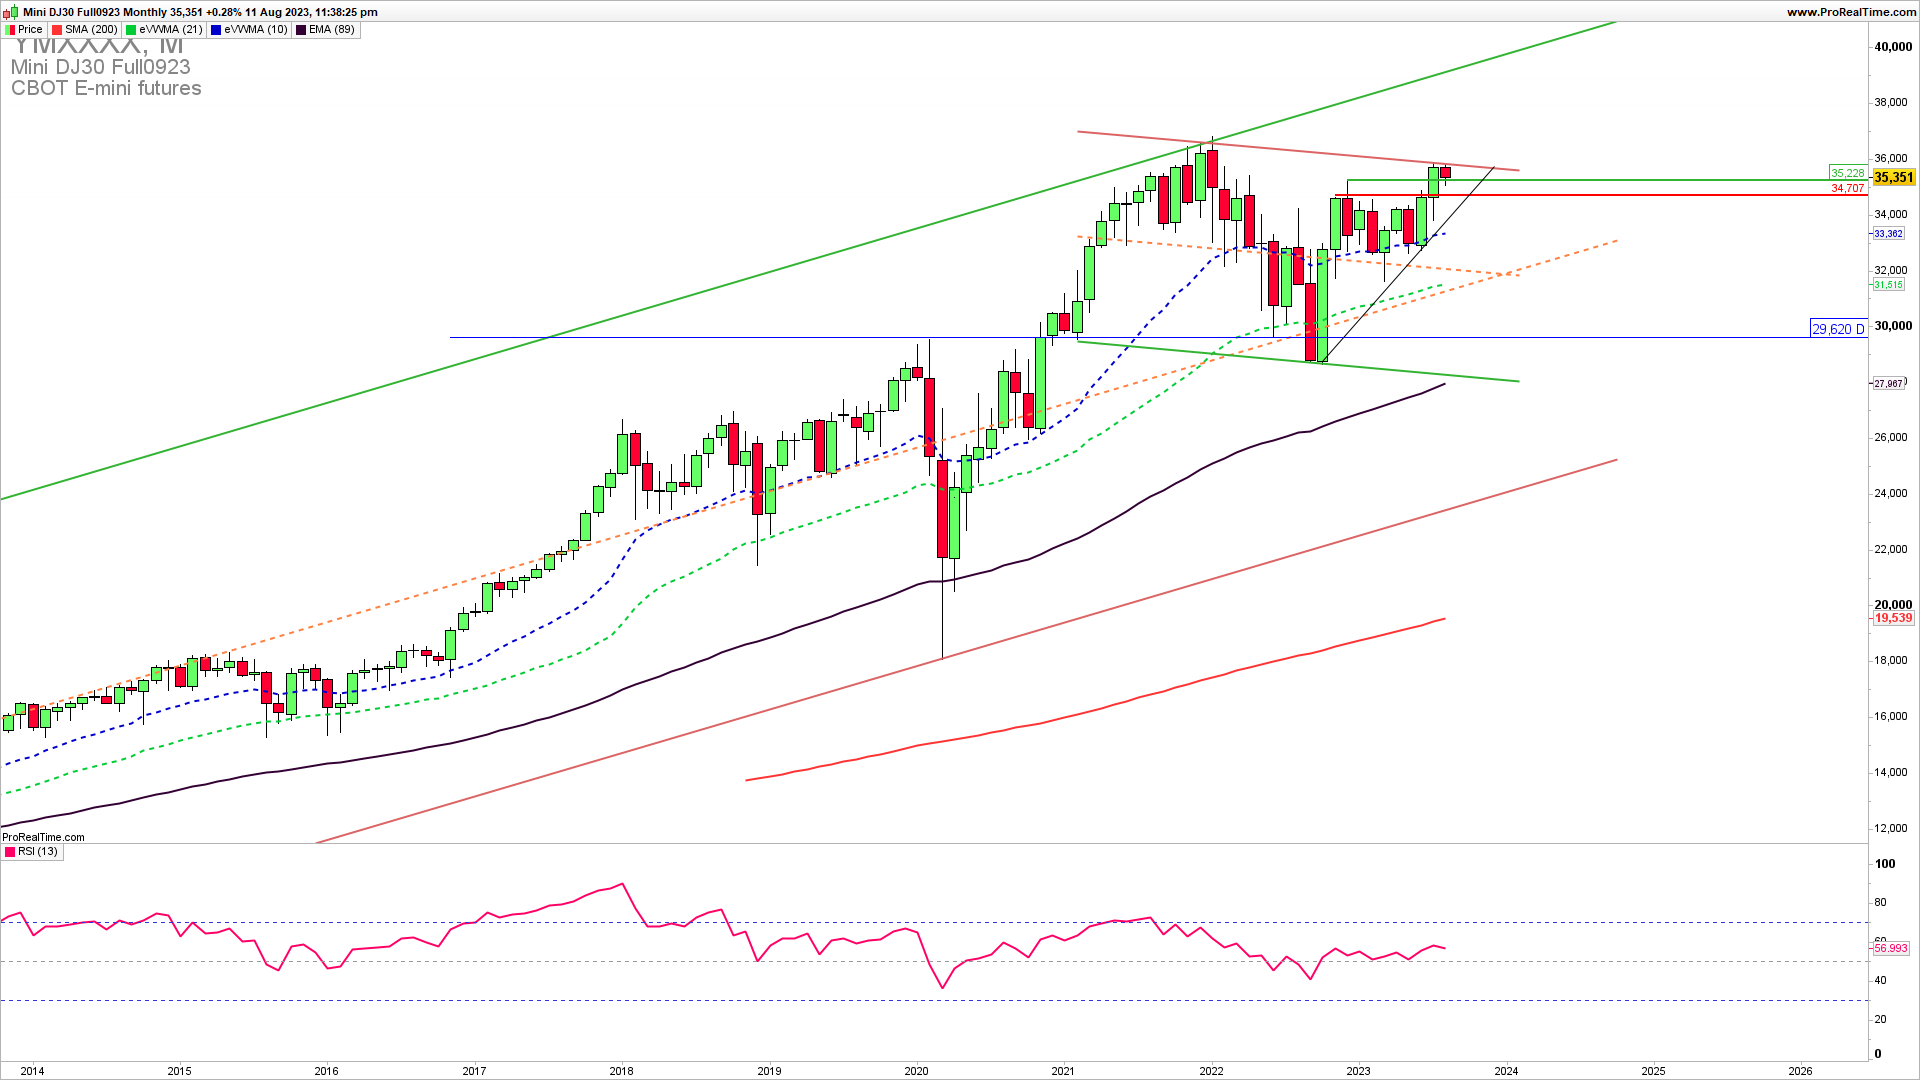
The monthly chart shows DJIA is still pressing the upside resistance of 35900. A break above this resistance will lead to a considerable breakout higher and an extension to 39300. A rejection here with a gap lower below 34600 will lead to a larger reversal to 32500.
OPTIONS TRADING INTENSIVE COURSE INTRO PRICE 30% OFF COUPON CODE JULY30
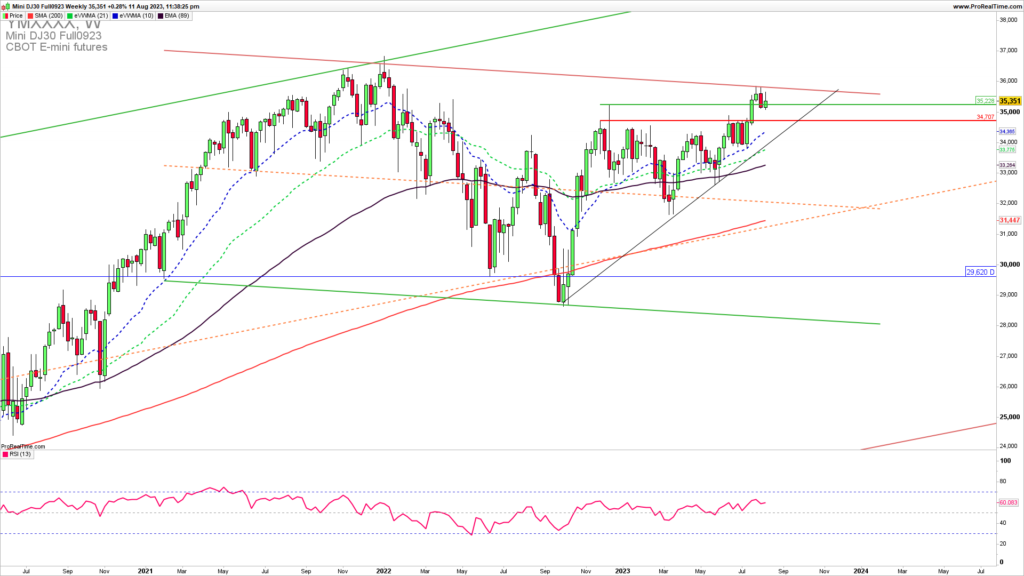
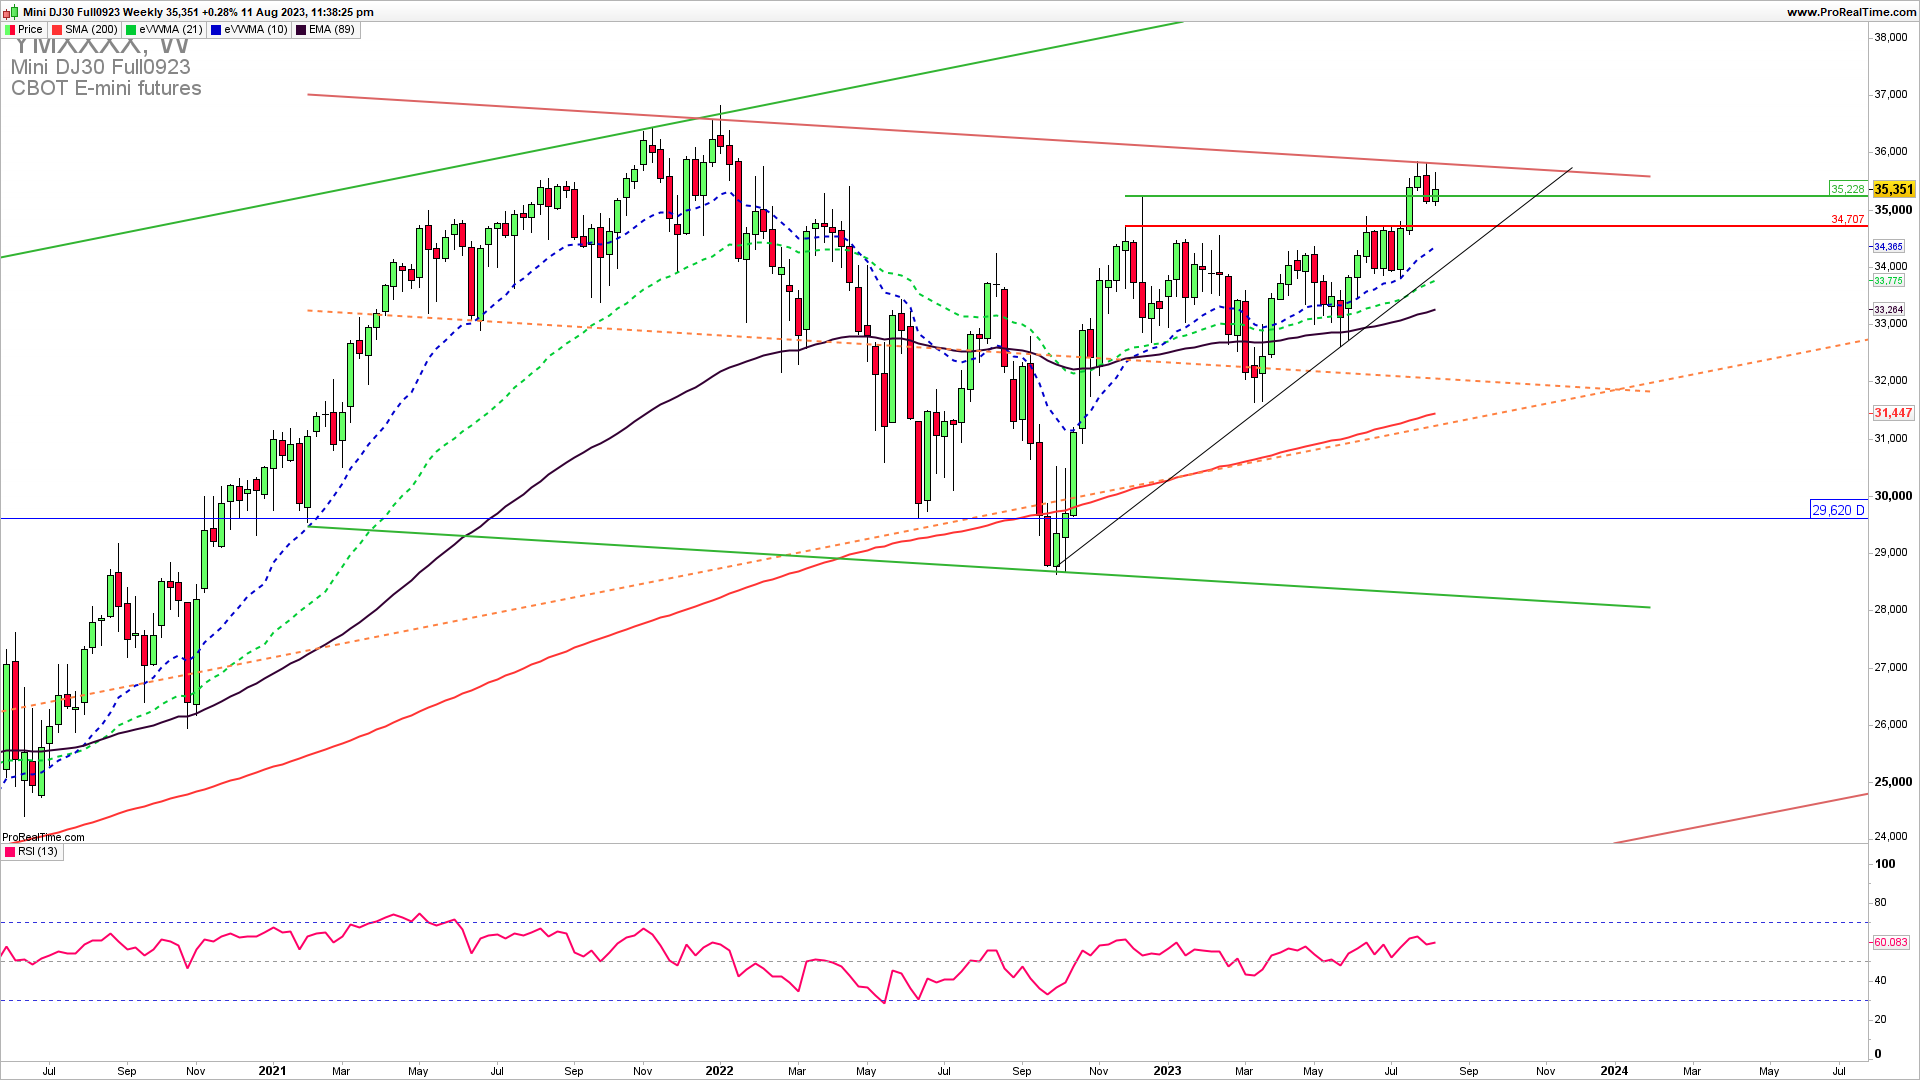
The Weekly DJIA chart reveals a strong uptrend support zone 34700-35200. This is the first strong line of defense for the existing uptrend supported by a strong uptrend line and a horizontal support line. This zone should hold for the extension higher. A break below 34700 followed by a break below 34000 would lead to a complete downside reversal and a bounce from this ongoing zone will lead to another test of 35900.
GET THE CHART OF THE DAY EVERY DAY IN YOUR INBOX
As the famous trader says…
” When you understand what’s involved in winning, as do professional gamblers, you’ll tend to bet more during a winning streak and less during a losing streak. However, the average person does exactly the opposite: he or she bets more after a series of losses and less after a series of wins.”Van K. Tharp
How to trade this?
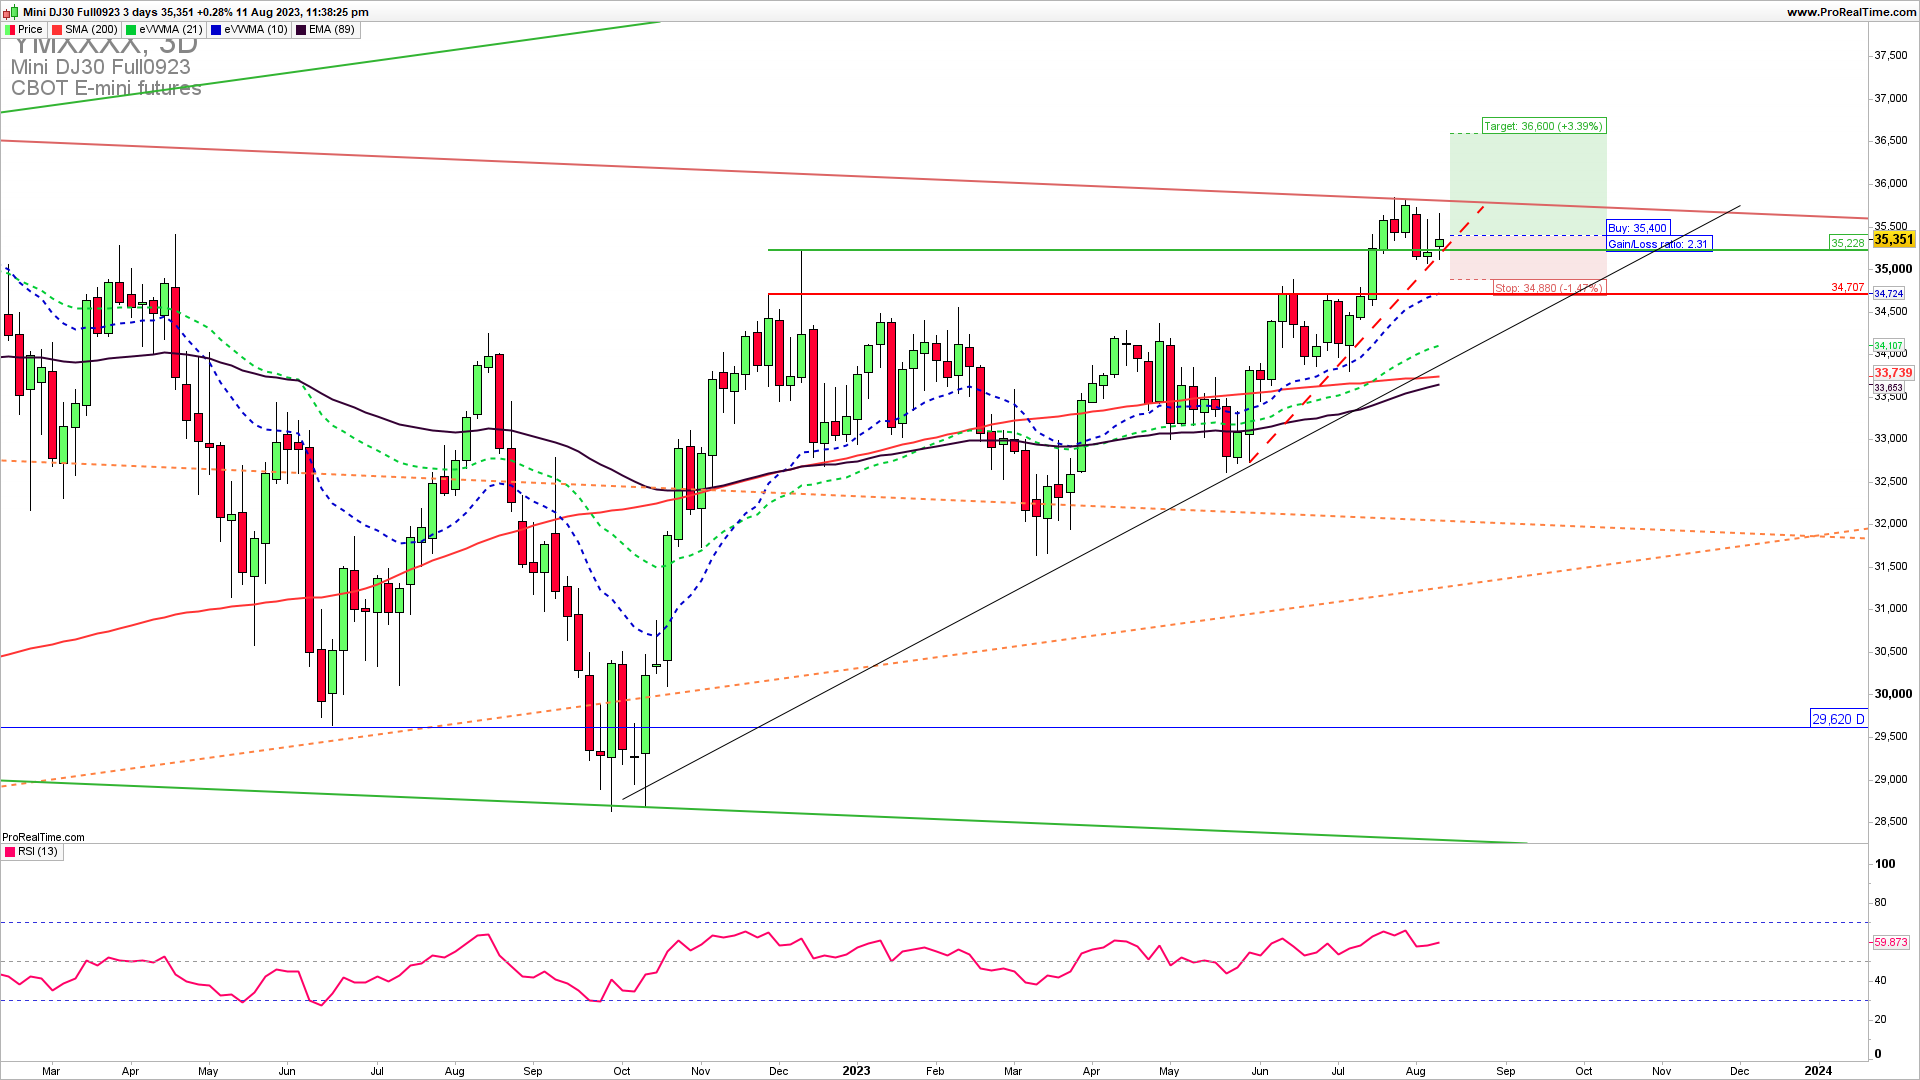
It is a fact that a strong upside resistance for Q3 is 35900 and we have seen a rejection from it. If we get a confirmed bounce from 35000 we could see an extension higher to key long-term resistance 35900. A break above this level would mean a complete turnaround. Near-term, long-trade entries have a higher probability of success. There is a possibility of long trade entry and short trade here. We can open the long trade here with a bit of risk and stop the loss below 34900 and the short trade if we get stopped from the long trade. Also, there is a trading strategy with options that can be combined.


