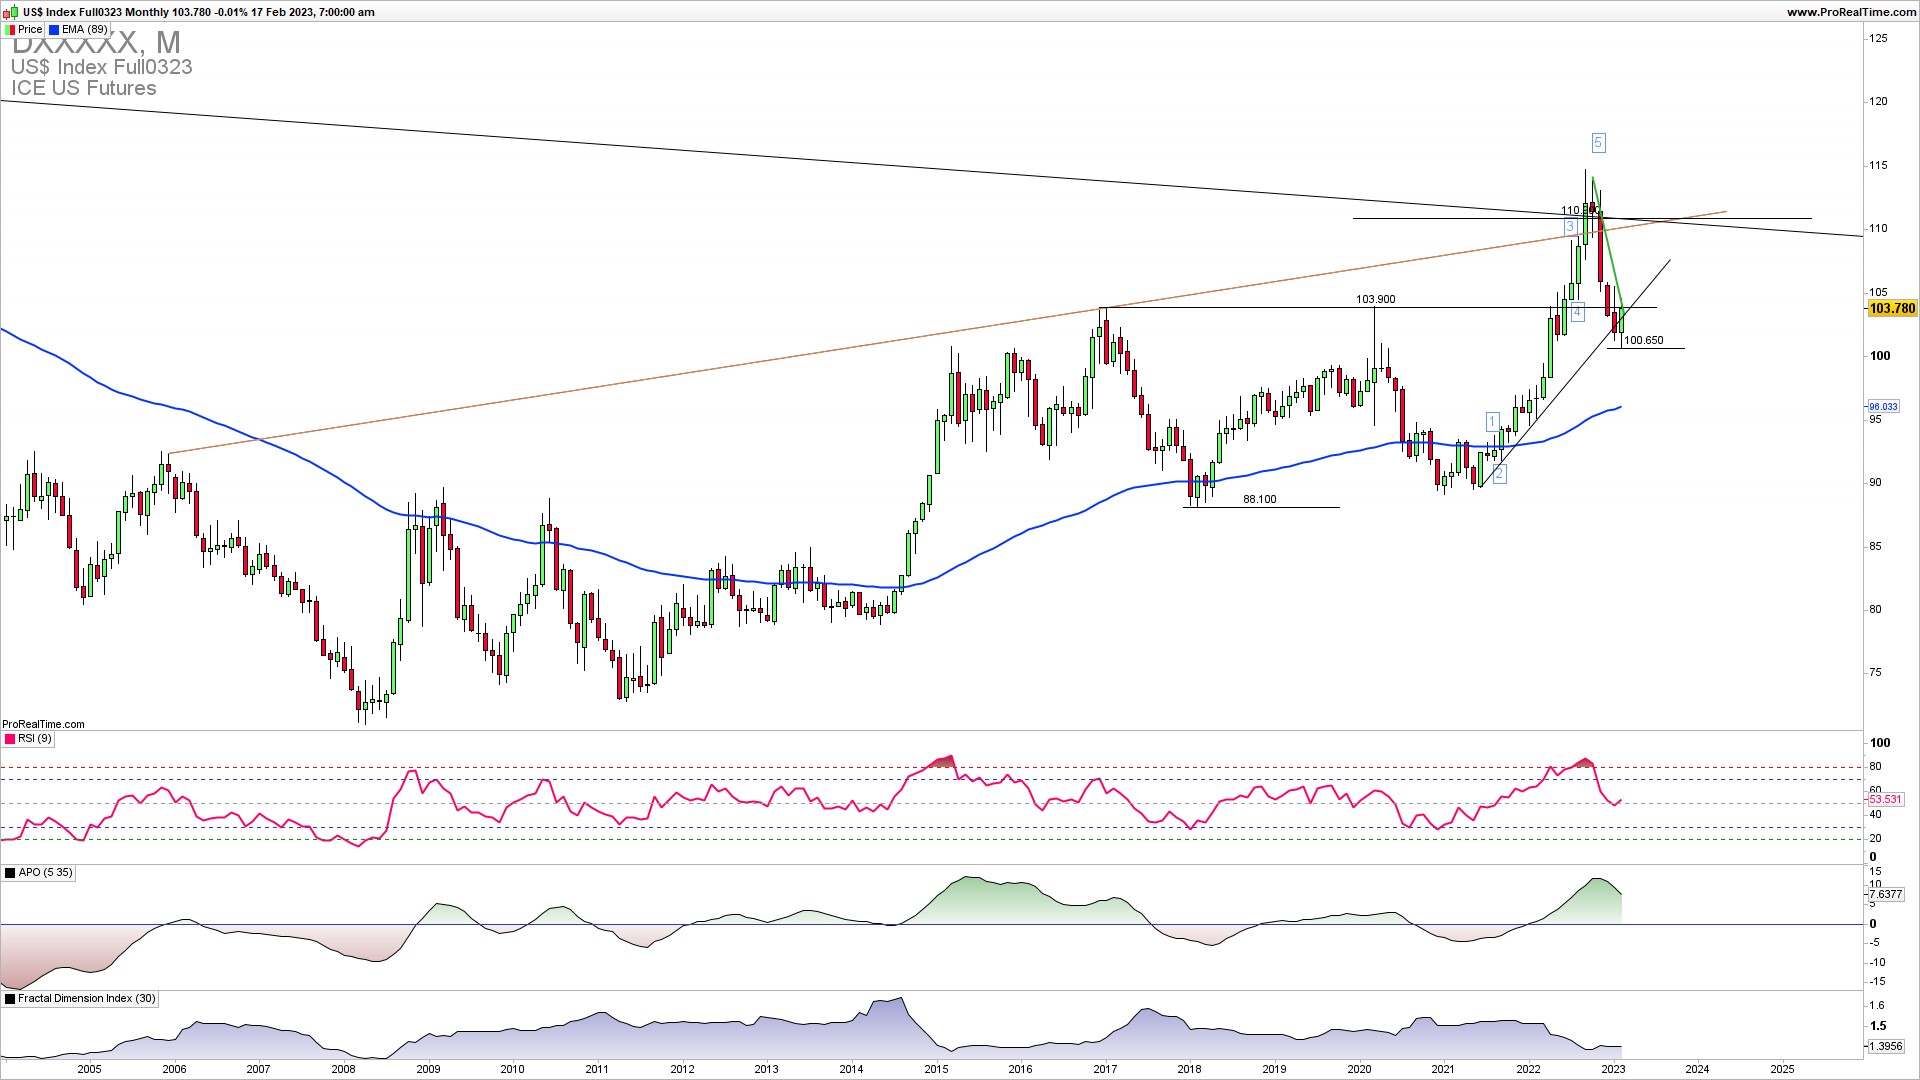
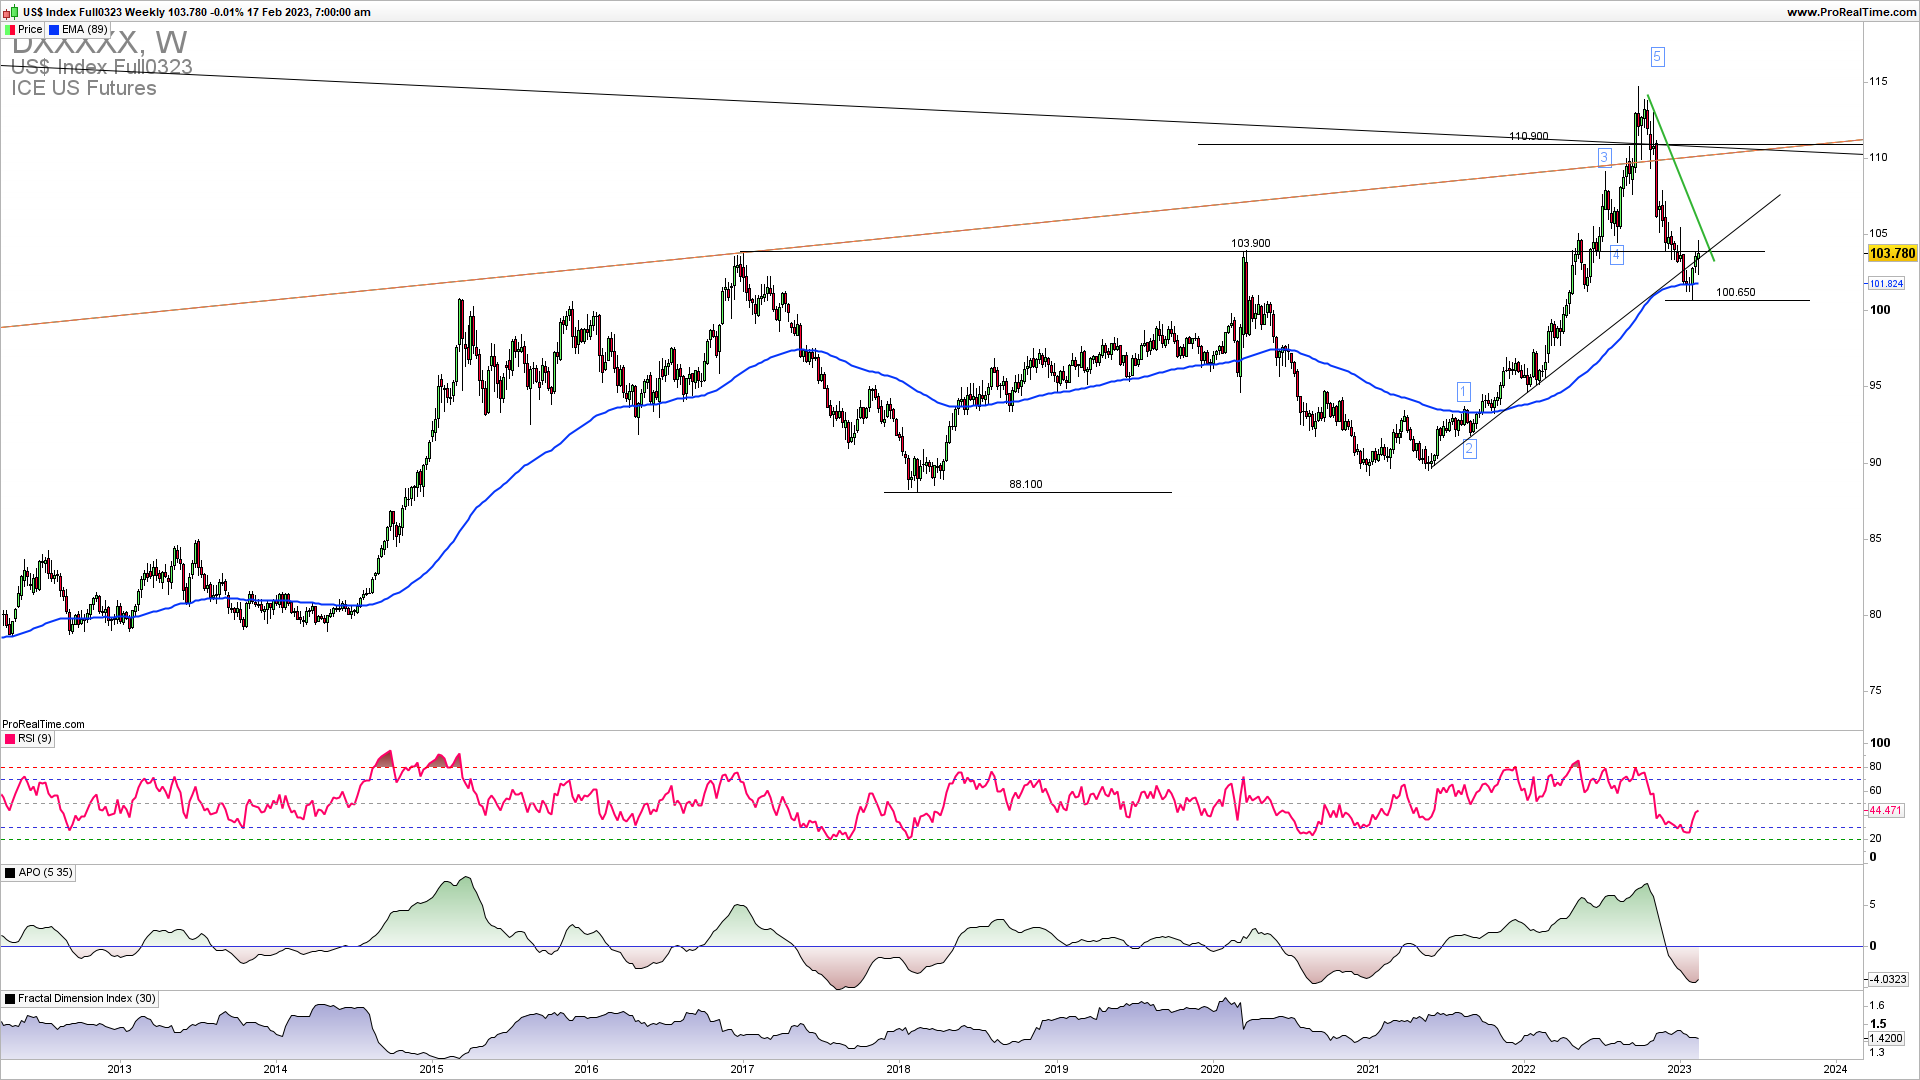
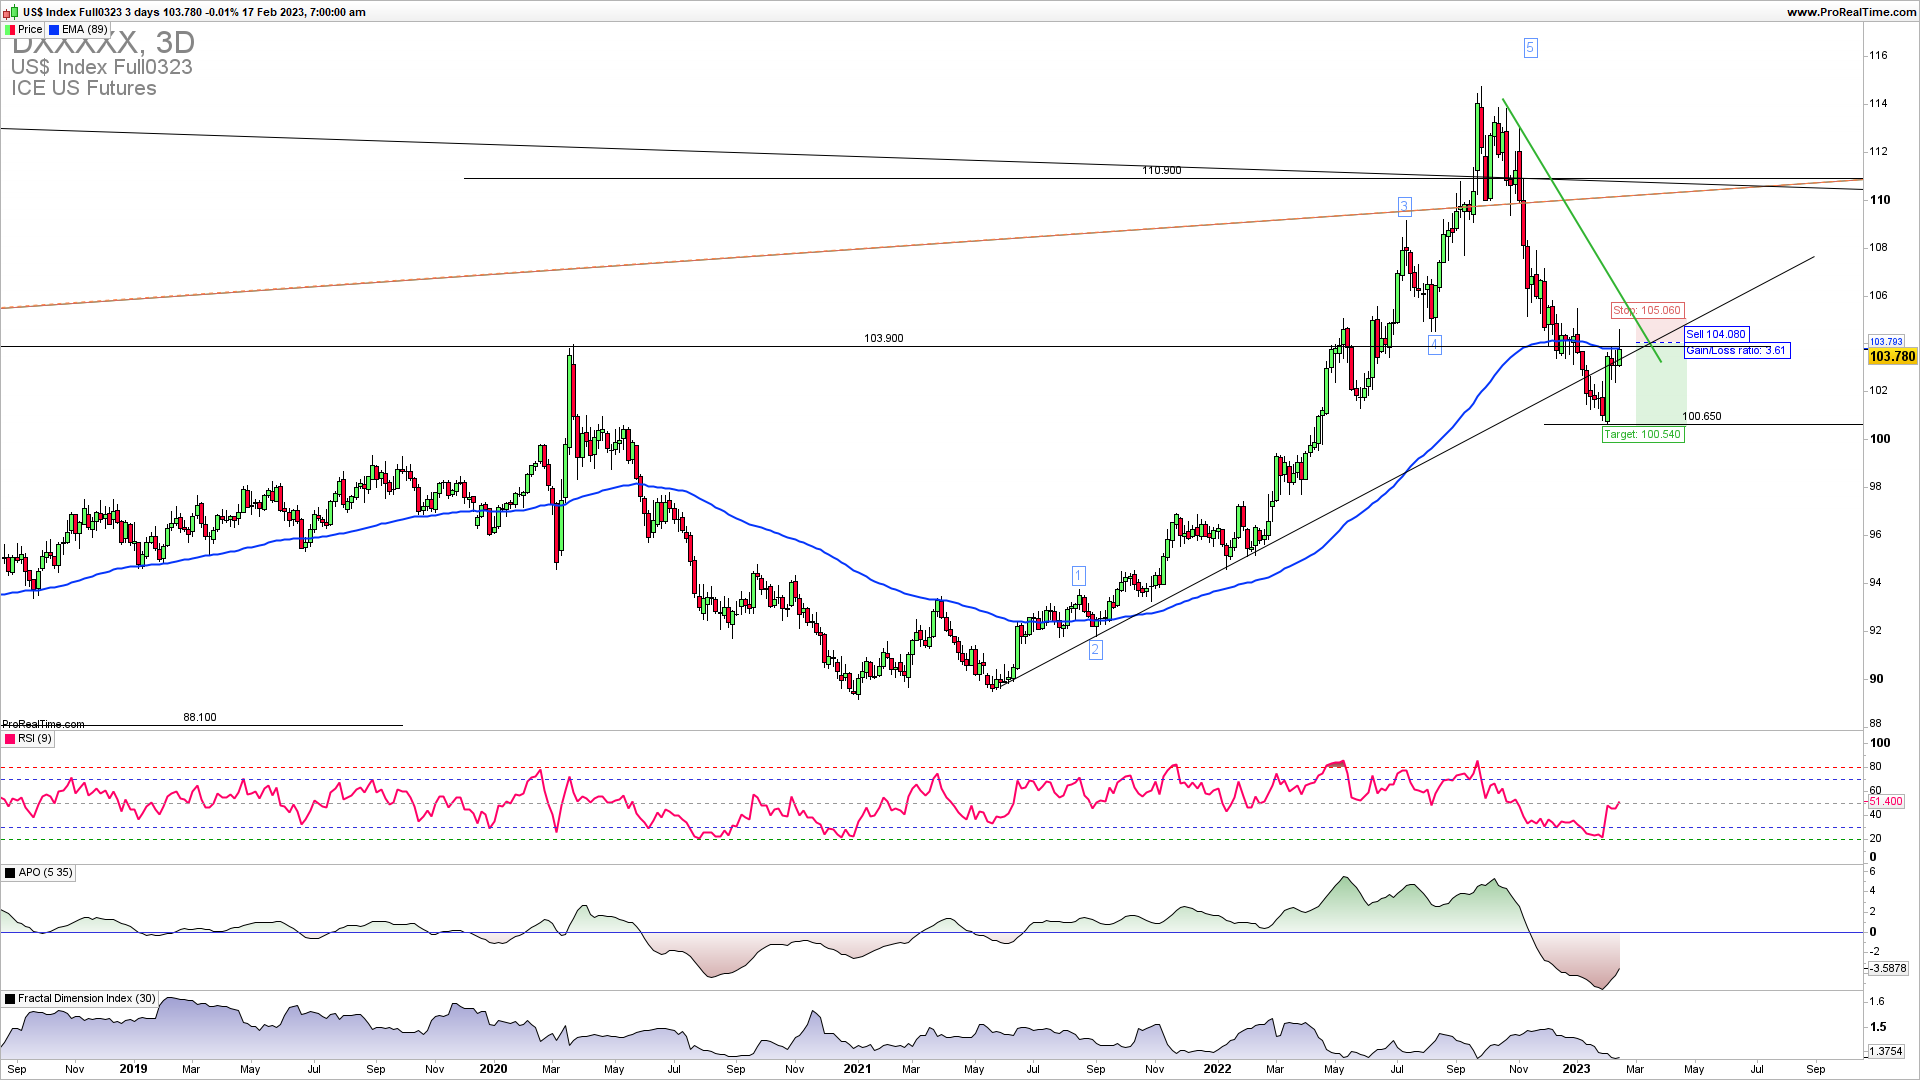
DXY pulled back from 2023 low of 100.650 to test a neckline of the previous top swing formation and a strong downside resistance which was broken to the downside of 103.900. Rejection from this level would lead to a downside continuation and a break above is required for the upside reversal higher and a retest of 110.
On the weekly DXY chart, a breakout higher above the long-term downside resistance was not successfully last week but we can not exclude the spikes above 104 which then need to be confirmed for a complete downside swing reversal higher. As we saw from the monthly chart only a confirmed break above 105 at this stage would invalidate the downside continuation. Now the most important levels in the next weeks are 100.650 on the downside and 105 on the upside.
As the famous trader says…
“In trading/investing, it’s not about how much you make but rather how much you don’t lose.“
Bernard Baruch
How to trade this?
It is obvious that for Q1 2023, we have this upside resistance 105 which should be broken for an upside continuation. This means that now short trade entries have some small advantage over the long trade entries as the overall trend is still down and it will be available for the long trade entries upon a confirmed break above 105 which needs to be confirmed. You should open a short trade, not so big in size with a close stop loss order just above 105 to target 100.650. The risk to reward on this trade is higher than 2 and the timing of the trade could be Monday NY session or Tuesday European session.


