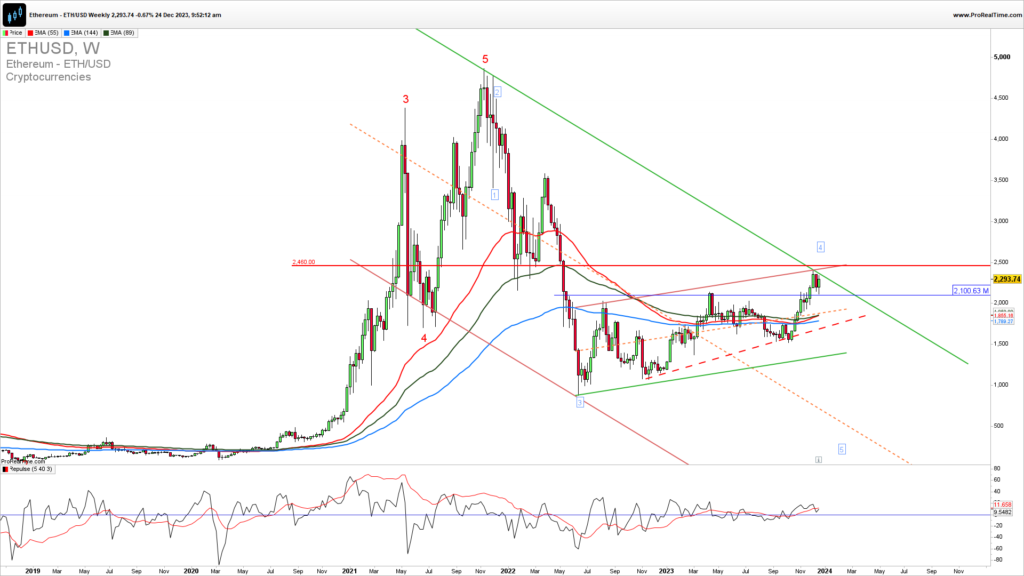
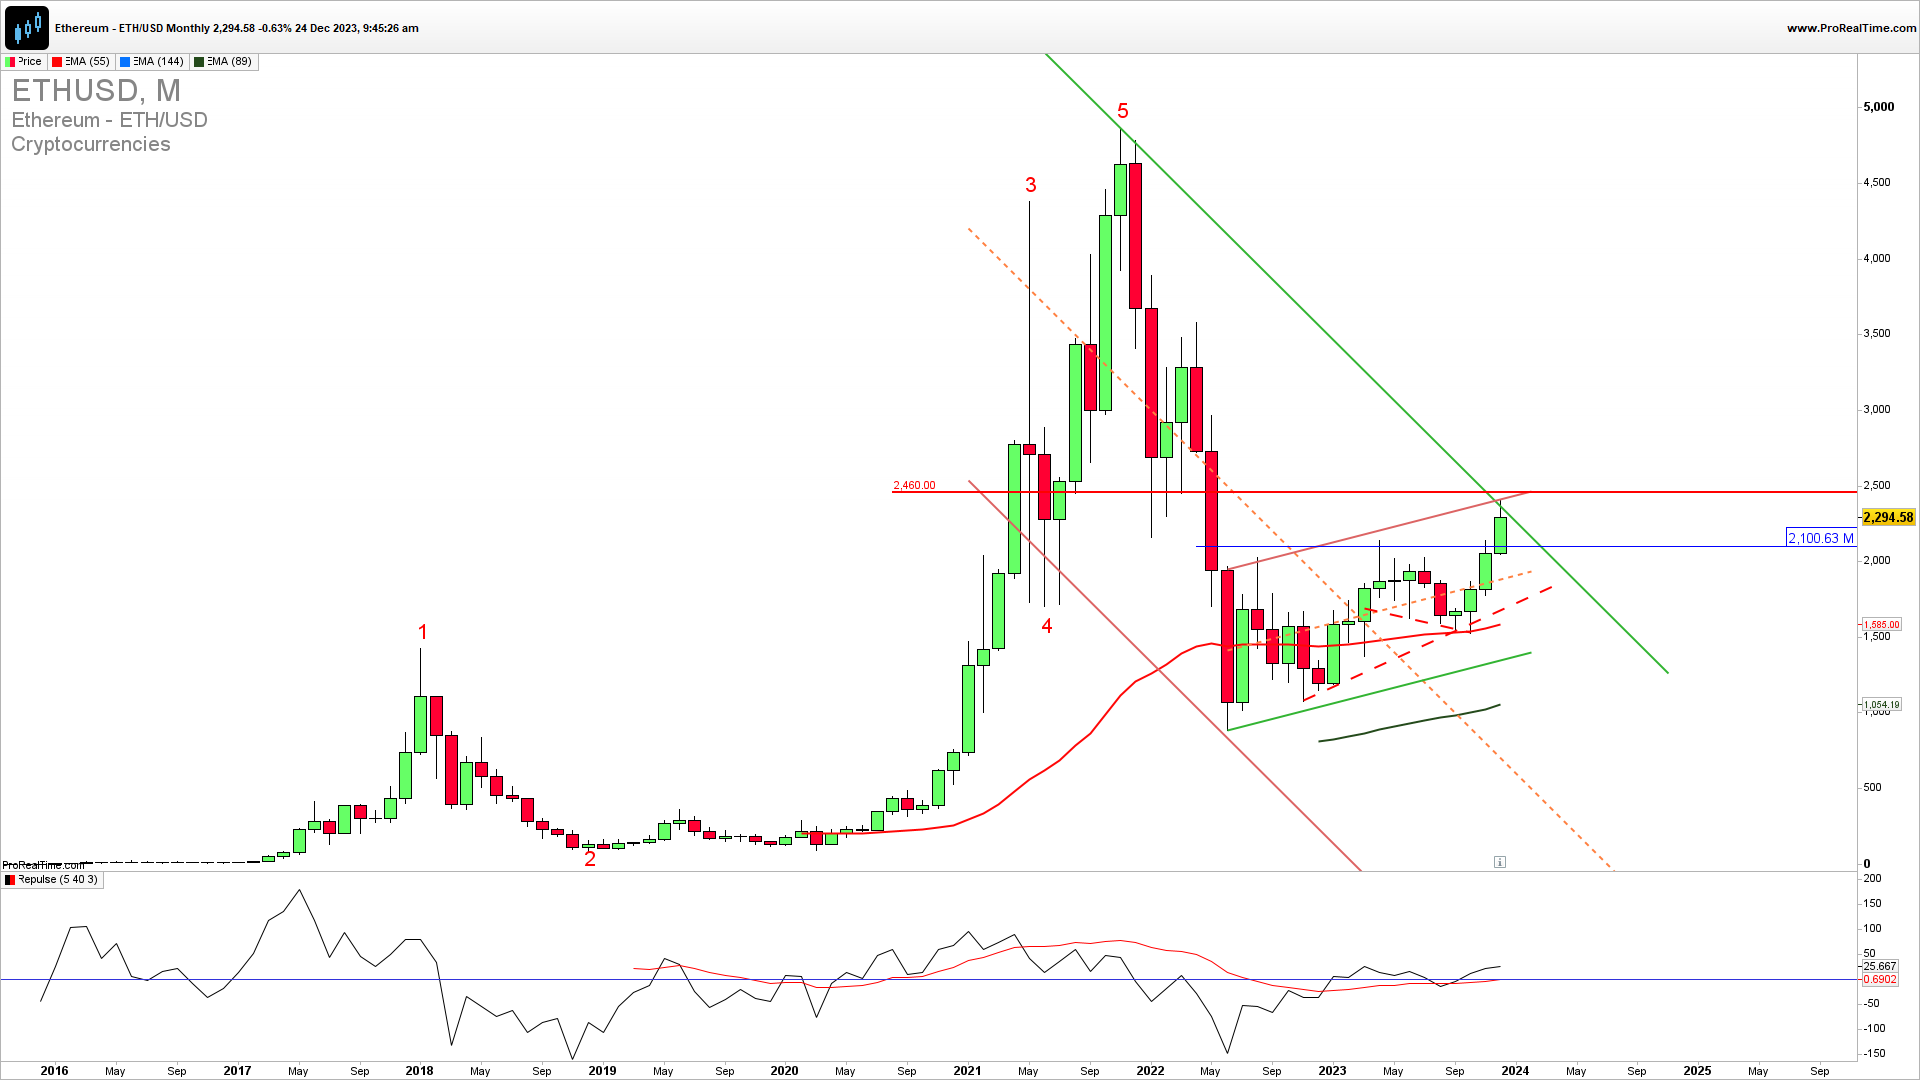
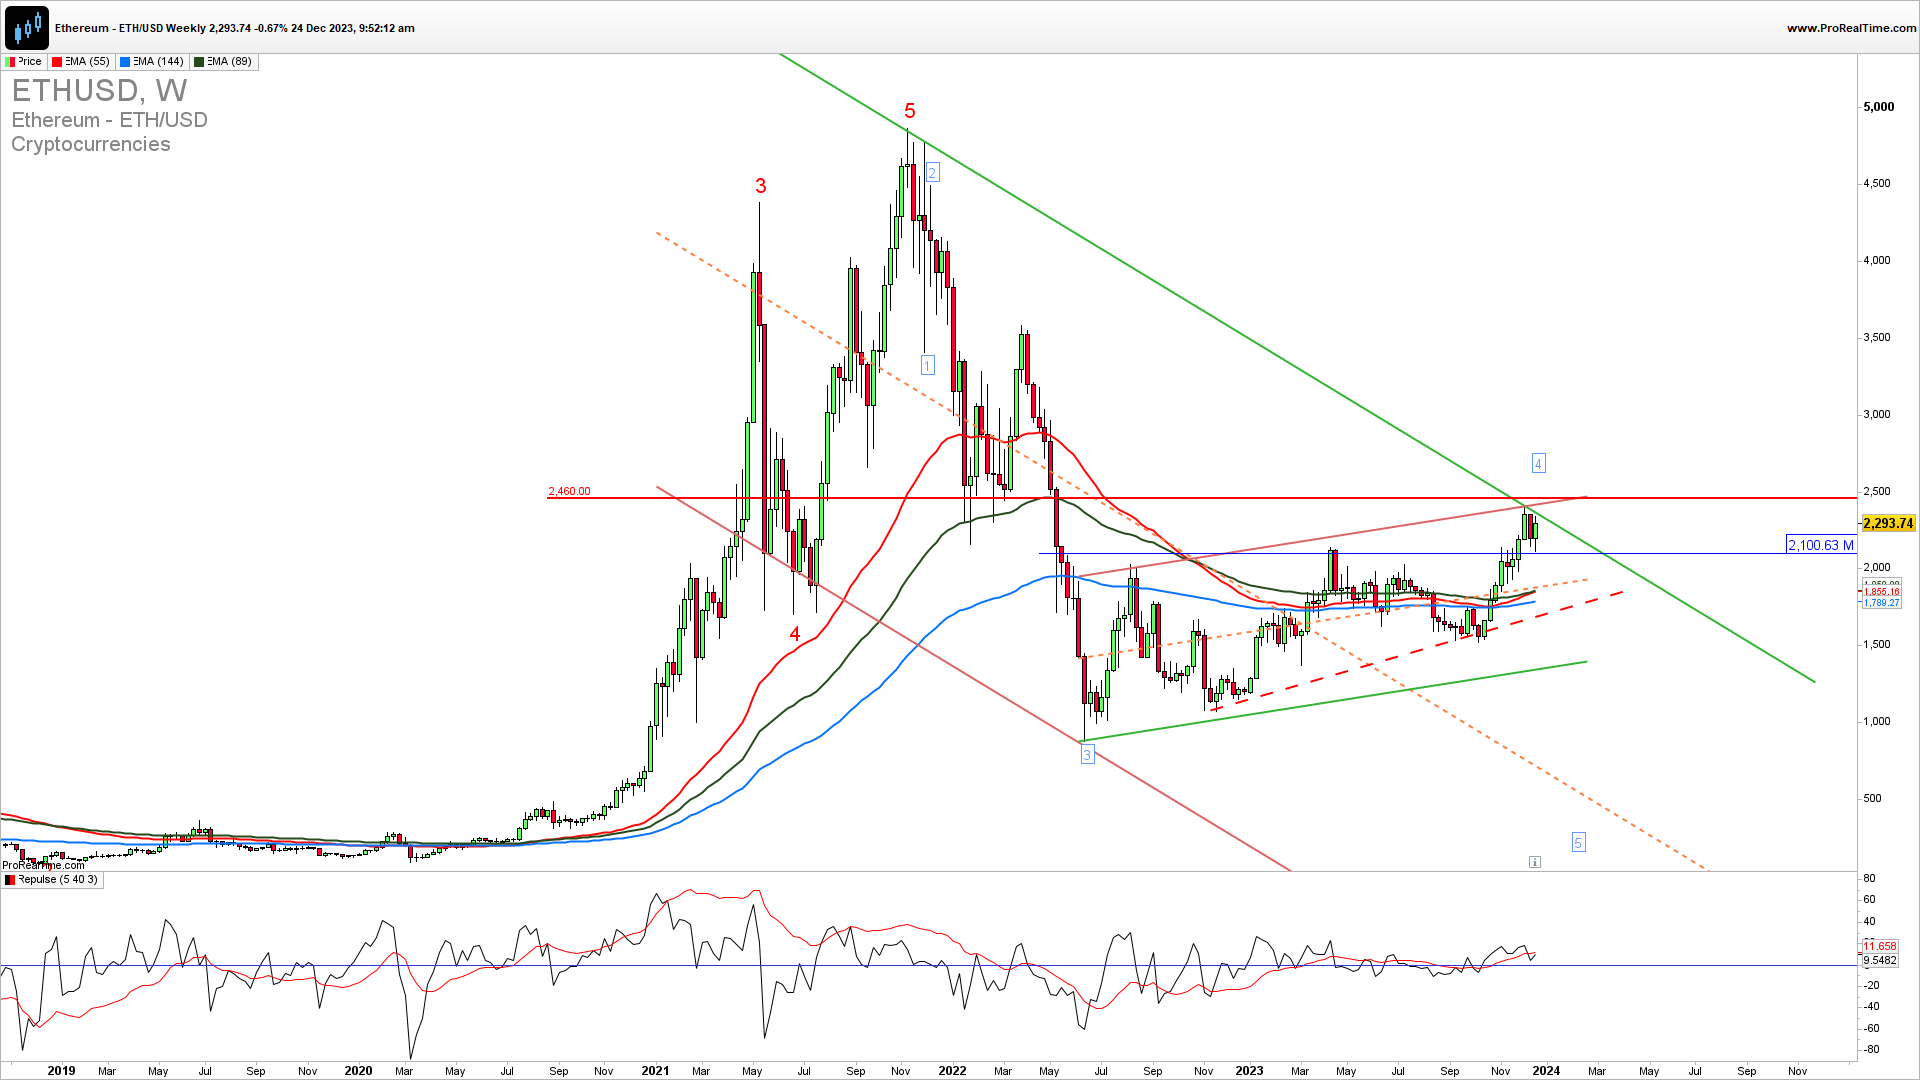
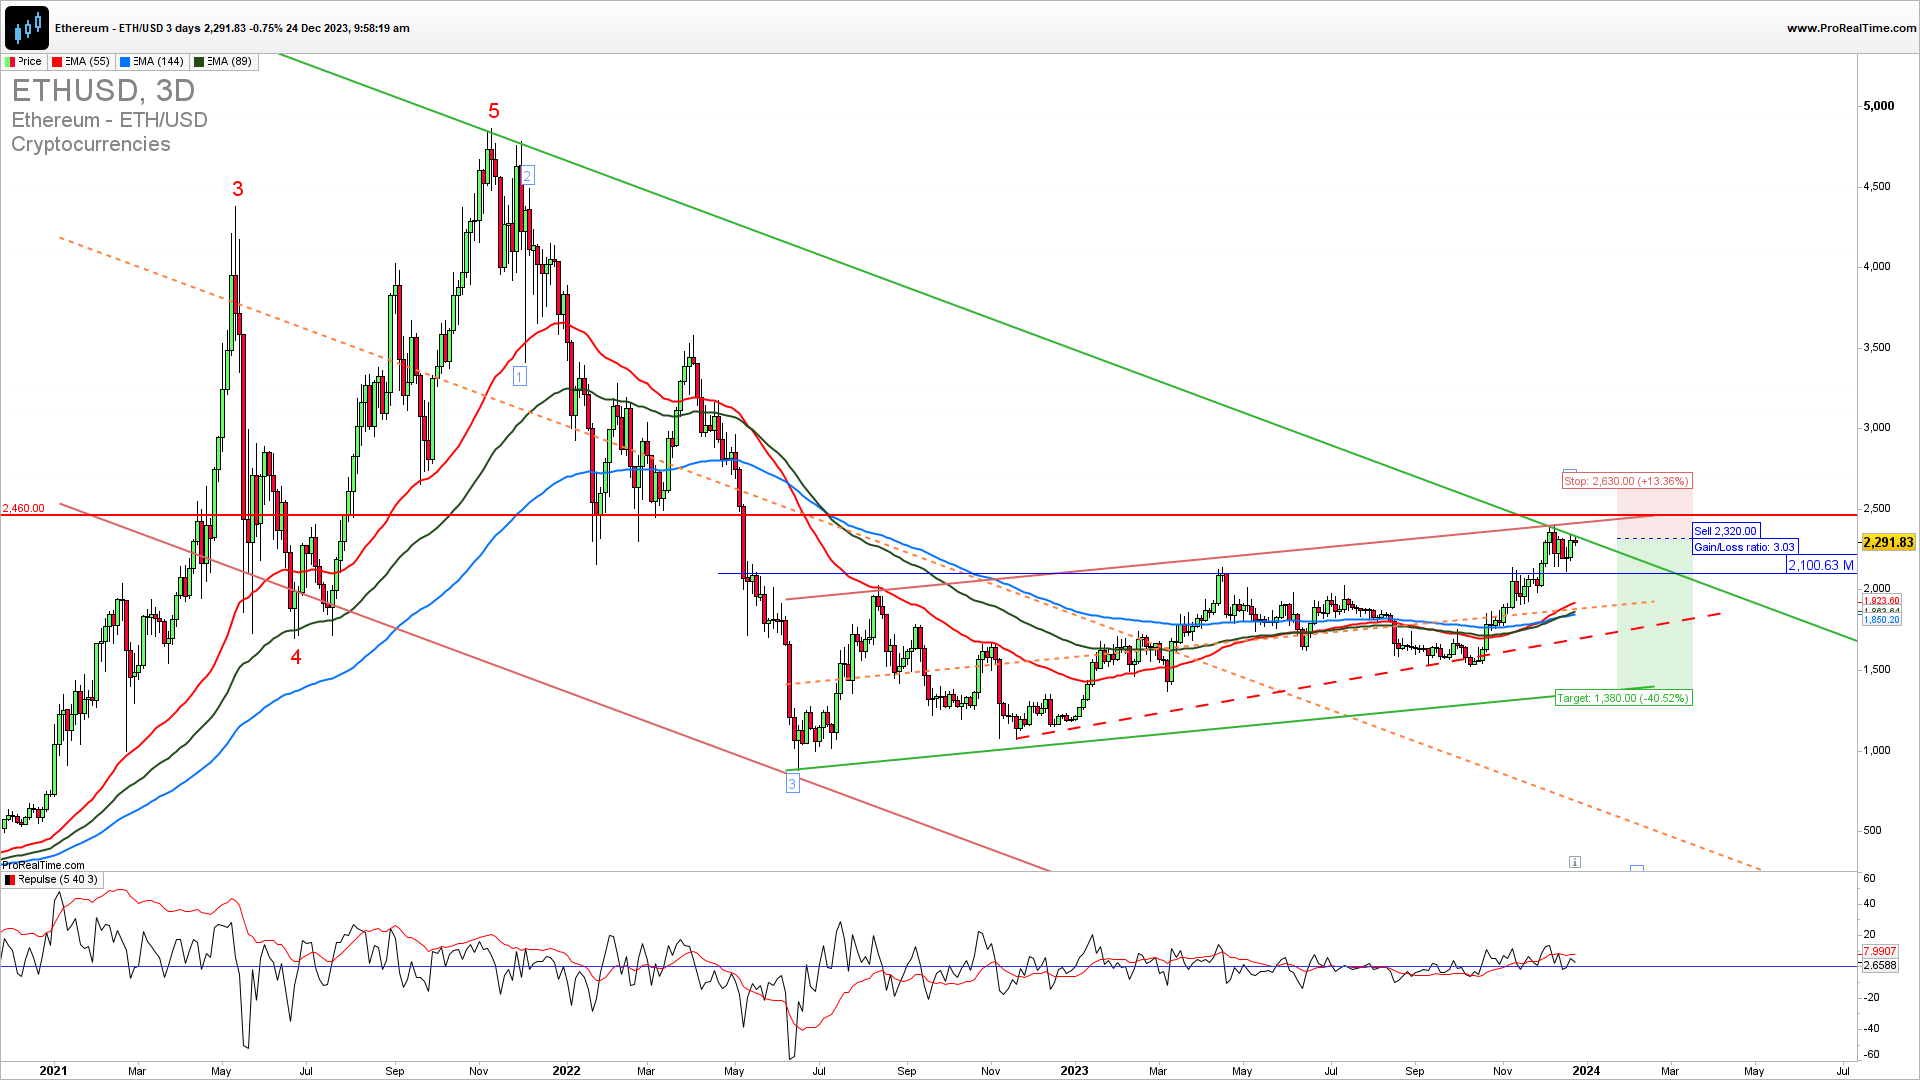
Ethereum is testing strong long-term resistance confluence 2400. This is falling long-term channel resistance and a bear flag resistance. If we get a rejection and a confirmed break above this level we can call for a stronger upside reversal extension. In the case of a rejection here and another break below 2100, the Ethereum will stay at bear flag.
The Weekly Ethereum chart reveals the rising price action flag and a test of its upside resistance and an already mentioned key level of 2400. A break below 2100 is required to invalidate the immediate upside extension, and it will lead to a deeper correction. A rejection from here will lead to a new swing down to 1700 and will indicate a new possible leg lower to 1400. Until we see a cler break above 2400 we are in the downside five waves which are not yet finished.
GET THE CHART OF THE DAY EVERY DAY IN YOUR INBOX
JOIN TRADING COMMUNITY SPECIAL CHRISTMAS OFFER
As the famous trader says…
“What is most important isn’t knowing the future — it is knowing how to react appropriately to the information available at each point in time.”Ray Dalio
How to trade this?
It is a fact that a strong upside resistance for Q1 2024 is 2400. If we get a confirmed break here we could see a strong upside continuation and a test of 3000. Near-term, short-trade entries have a higher probability of success but for the conservative traders upon a break below 2100. Long trade entries are possible as well but only on a price action confirmed break above 2400. You can try a short trade here with a stop loss above 2500 and if you will be stopped out then reverse to long. For the inquiries about account management please write to [email protected].


