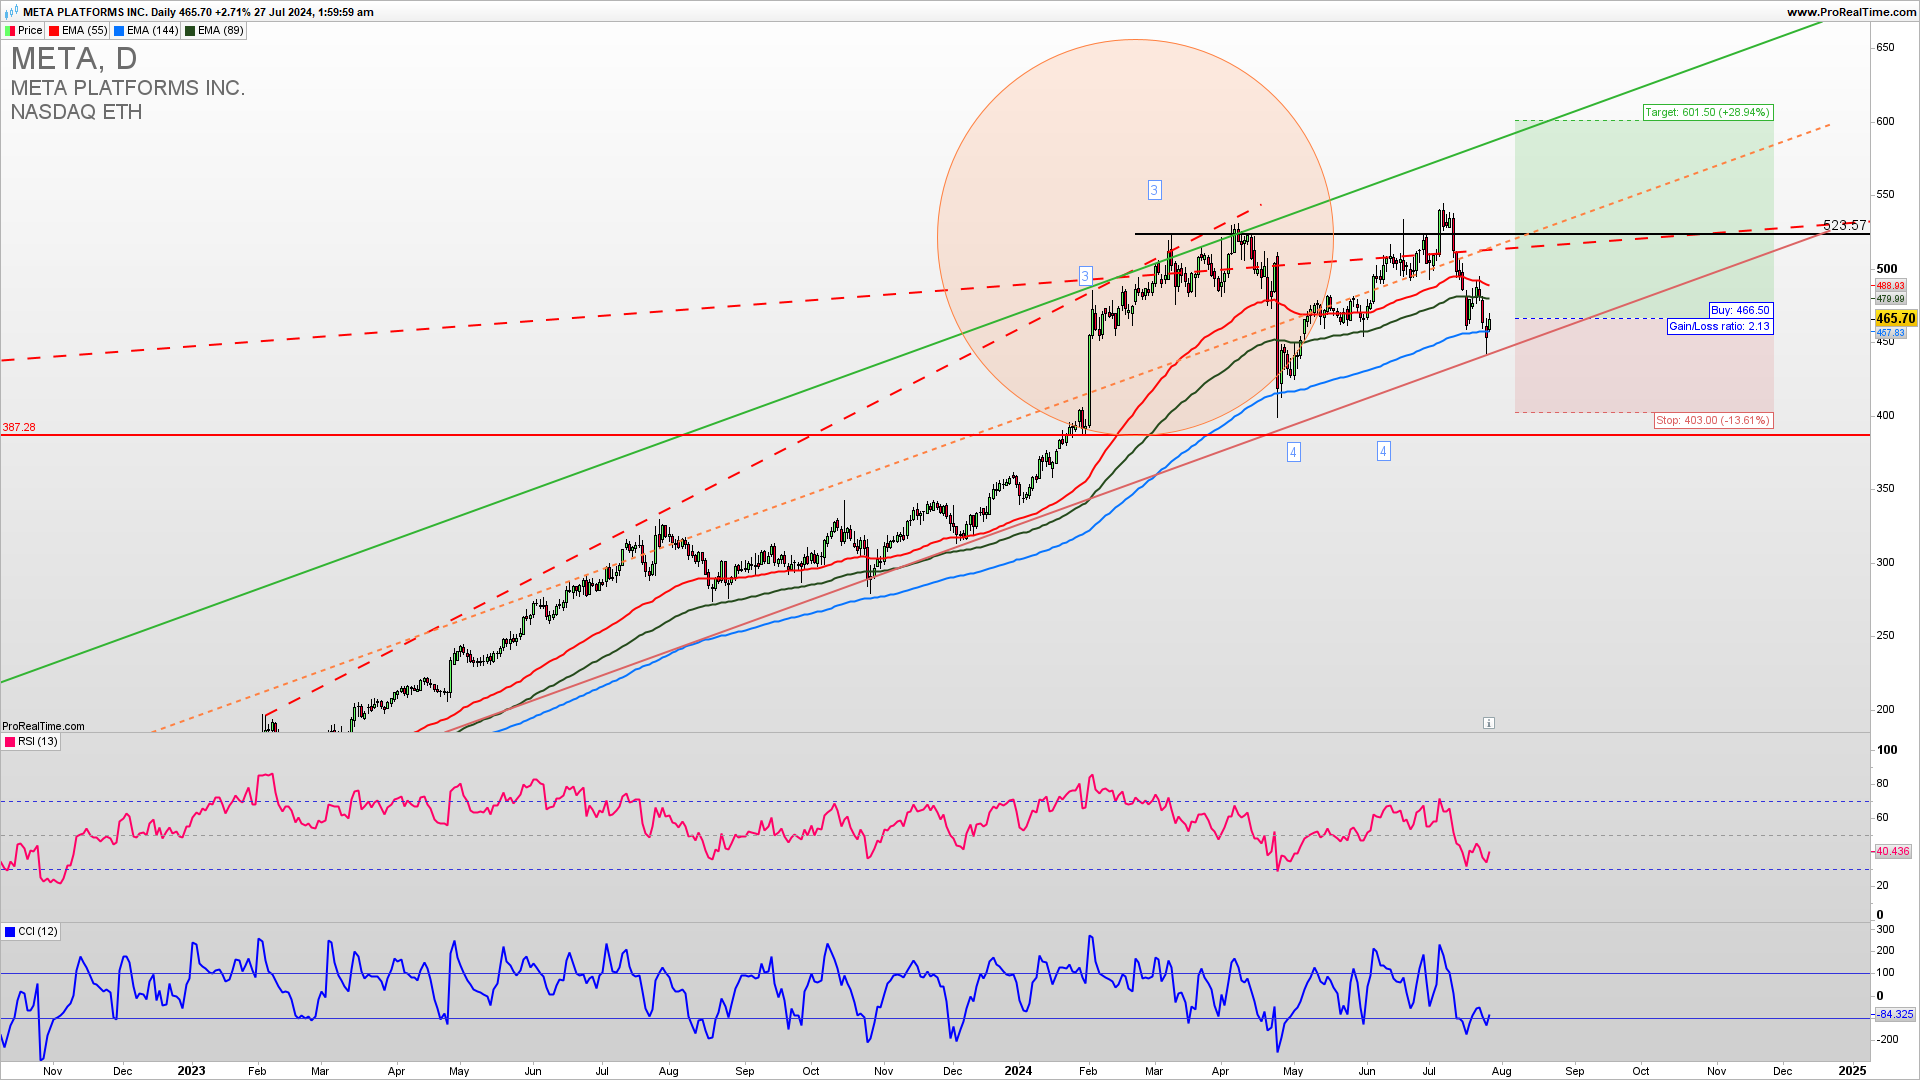
META is pulling back to test the upside channel support 440 level. This should hold for an extension higher in the final short-term and long-term fifth wave. The next big resistance is 524. This should be a fifth-wave extension and an invalidation will come upon a break below 460. Learn to Trade Stocks profitably.
MENTORING WITH FUNDED ACCOUNT 40% OFF TILL MONDAY!
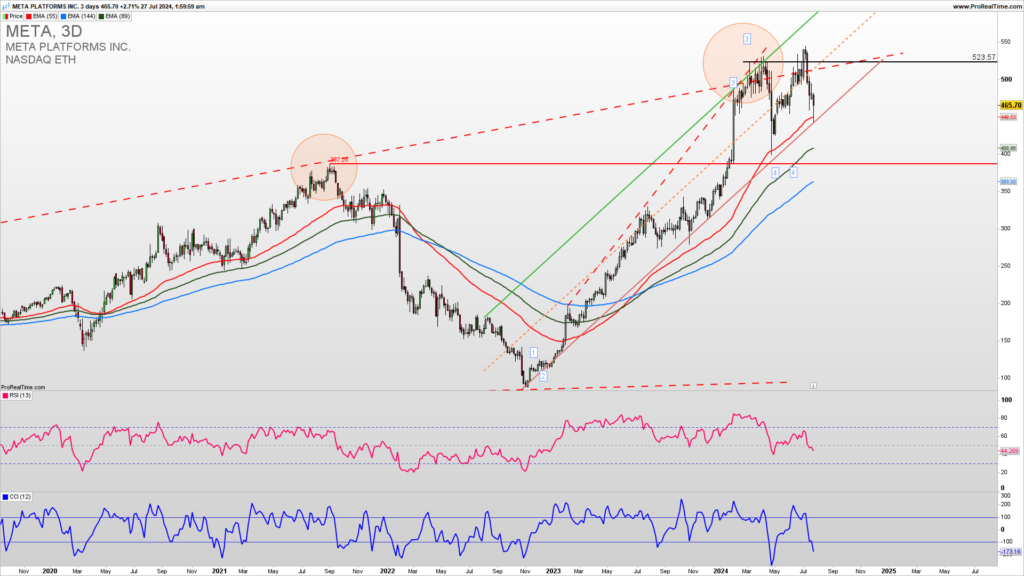
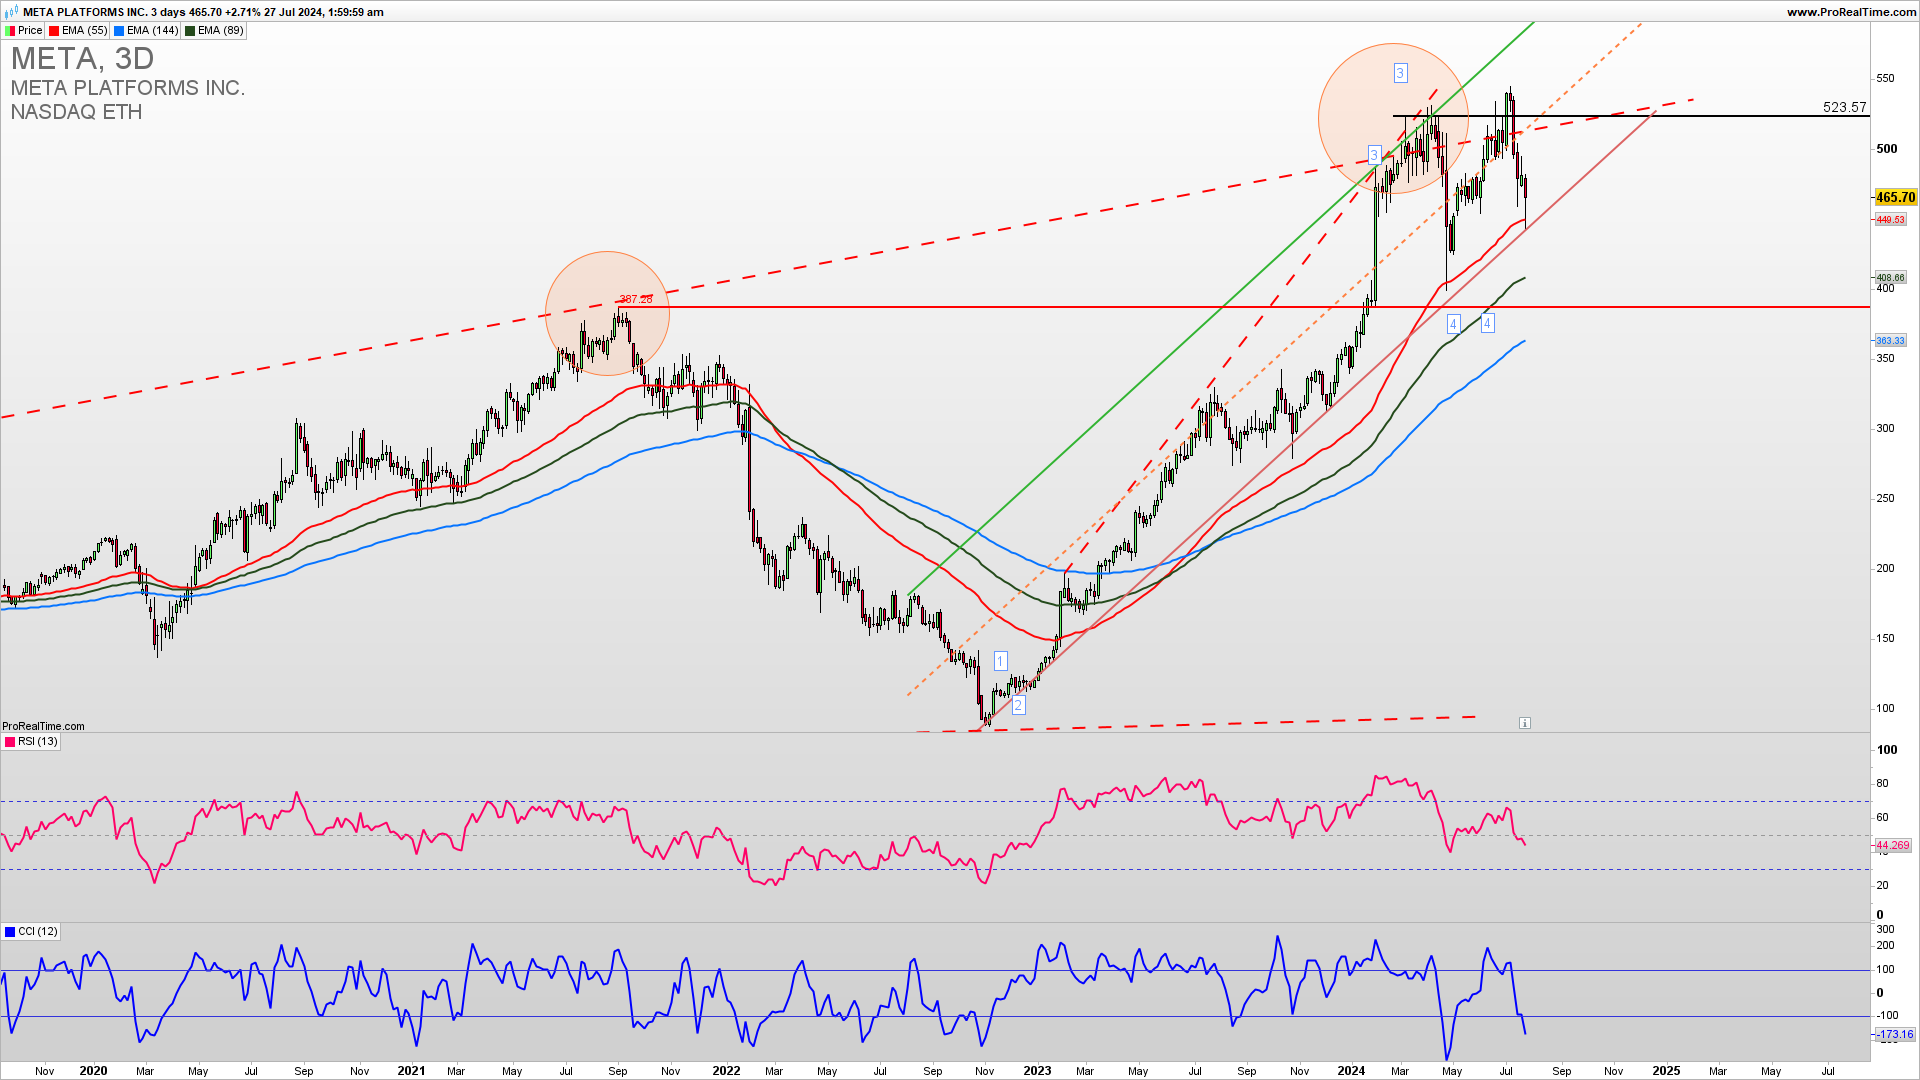
The 3-day META chart reveals a bounce from the channel support 450. At this point, buy positions are possible as META is still holding the medium-term support. Overall support for the upside even if it breaks below 450 is 387 and the final long-term support for a bullish trend invalidation is 360.
GET THE CHART OF THE DAY EVERY DAY IN YOUR INBOX
As the famous trader says…
“The hard work in trading comes in the preparation. The actual process of trading, however, should be effortless.”
Jack Schwager
How to trade this?
It is a fact that a strong upside resistance for Q3 2024 is 523 and If we get a confirmed break above this level we could see a strong upside continuation in a fifth long-term upside Elliott Wave. Near-term, long-trade entries have a higher probability of success. Long trade entries can be placed here or a call option buying with a stop loss below 420 with a first target of 550 and if broken second target is 620. The short-trade entry can be tried in the case of a break below 380. For inquiries about account management please write to [email protected].