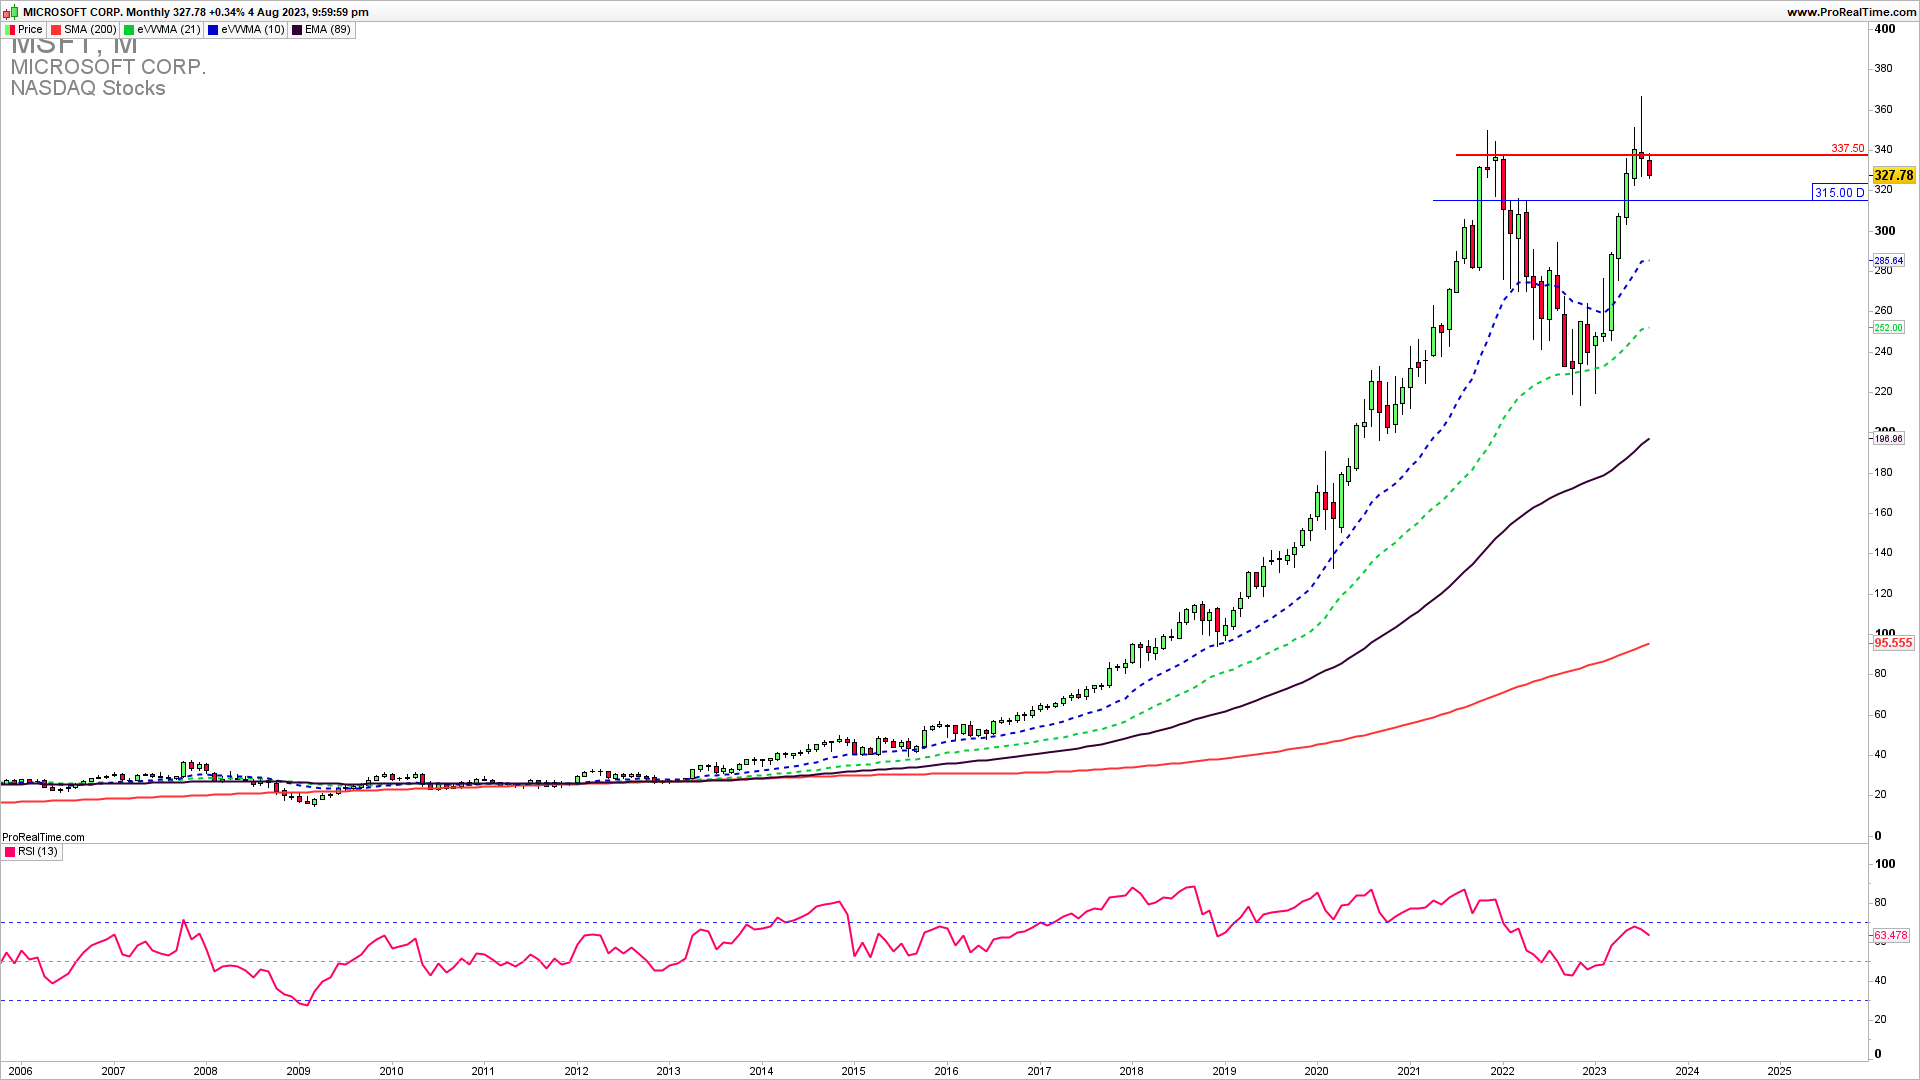
The monthly chart shows MSFT pullback lower after reaching a new high of 367 and rejection from 351. As seen on the monthly chart the support is at 315 if we get a test of that level in the medium to long-term.
OPTIONS TRADING INTENSIVE COURSE INTRO PRICE 30% OFF COUPON CODE JULY30
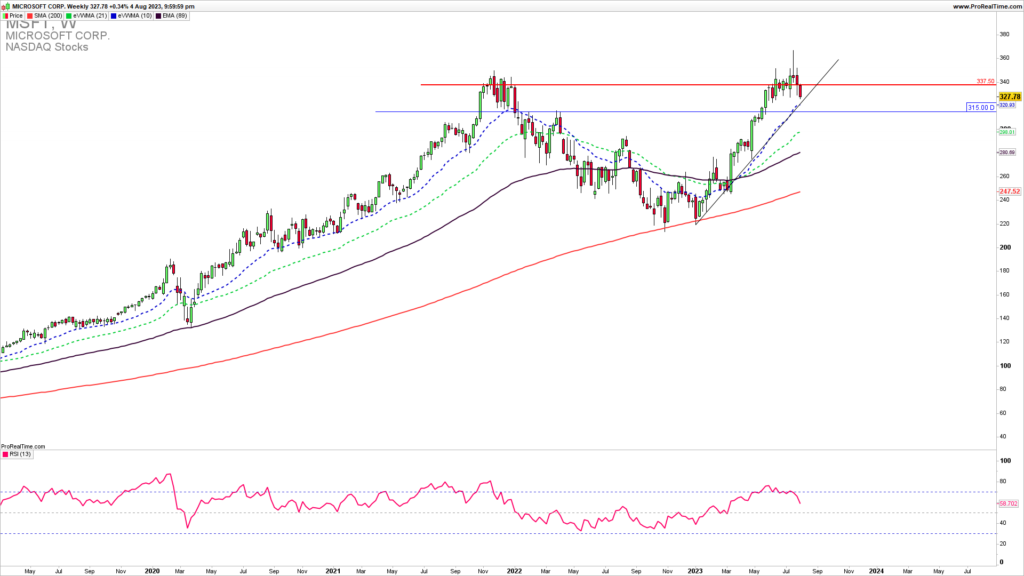
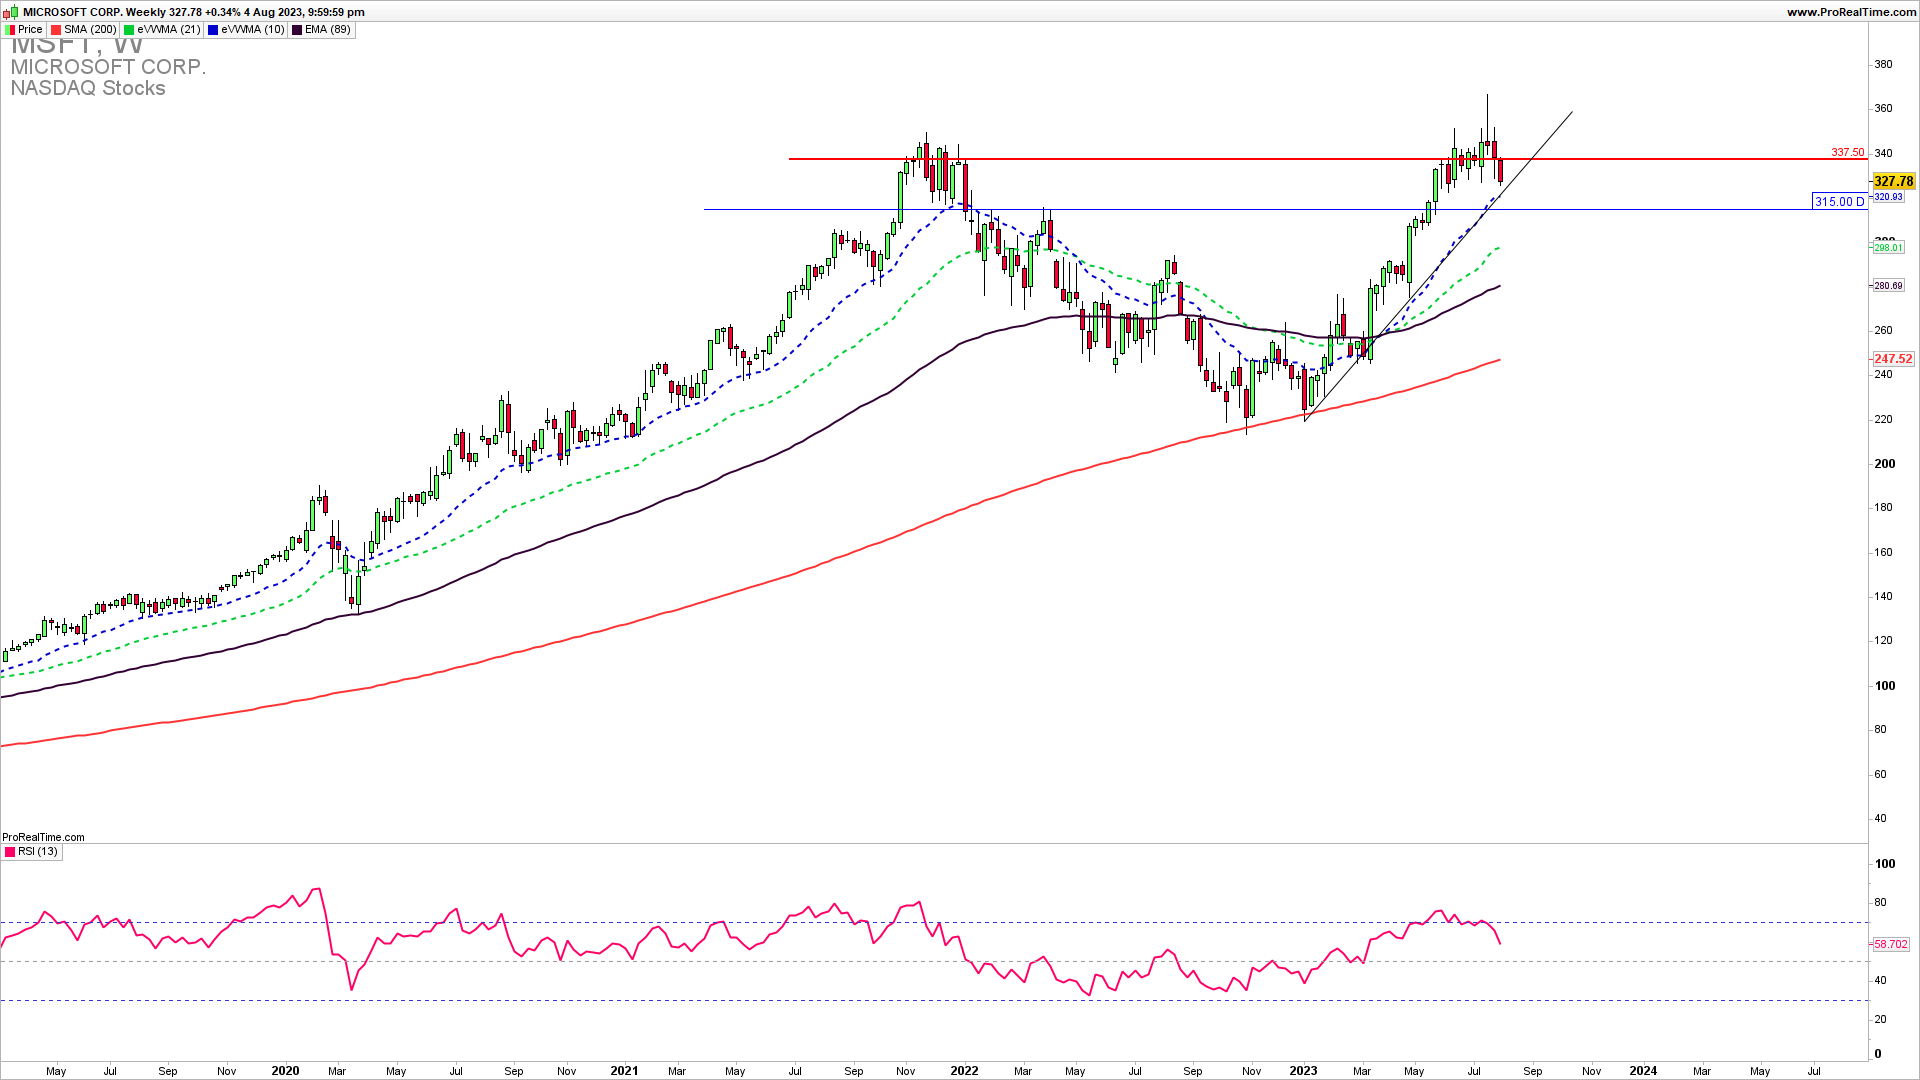
The Weekly MSFT chart reveals a strong uptrend support zone 315-325. This is the first and strong line of defense for the existing uptrend supported by a strong uptrend line and a horizontal support line. This zone should hold for the extension higher. A break below 315 would lead to a complete downside reversal.
GET THE CHART OF THE DAY EVERY DAY IN YOUR INBOX
As the famous trader says…
” Why do you think unsuccessful traders are obsessed with market analysis? They crave the sense of certainty that analysis appears to give them. Although few would admit it, the truth is that the typical trader wants to be right on every single trade. He is desperately trying to create certainty where it just doesn’t exist.”Mark Douglas
How to trade this?
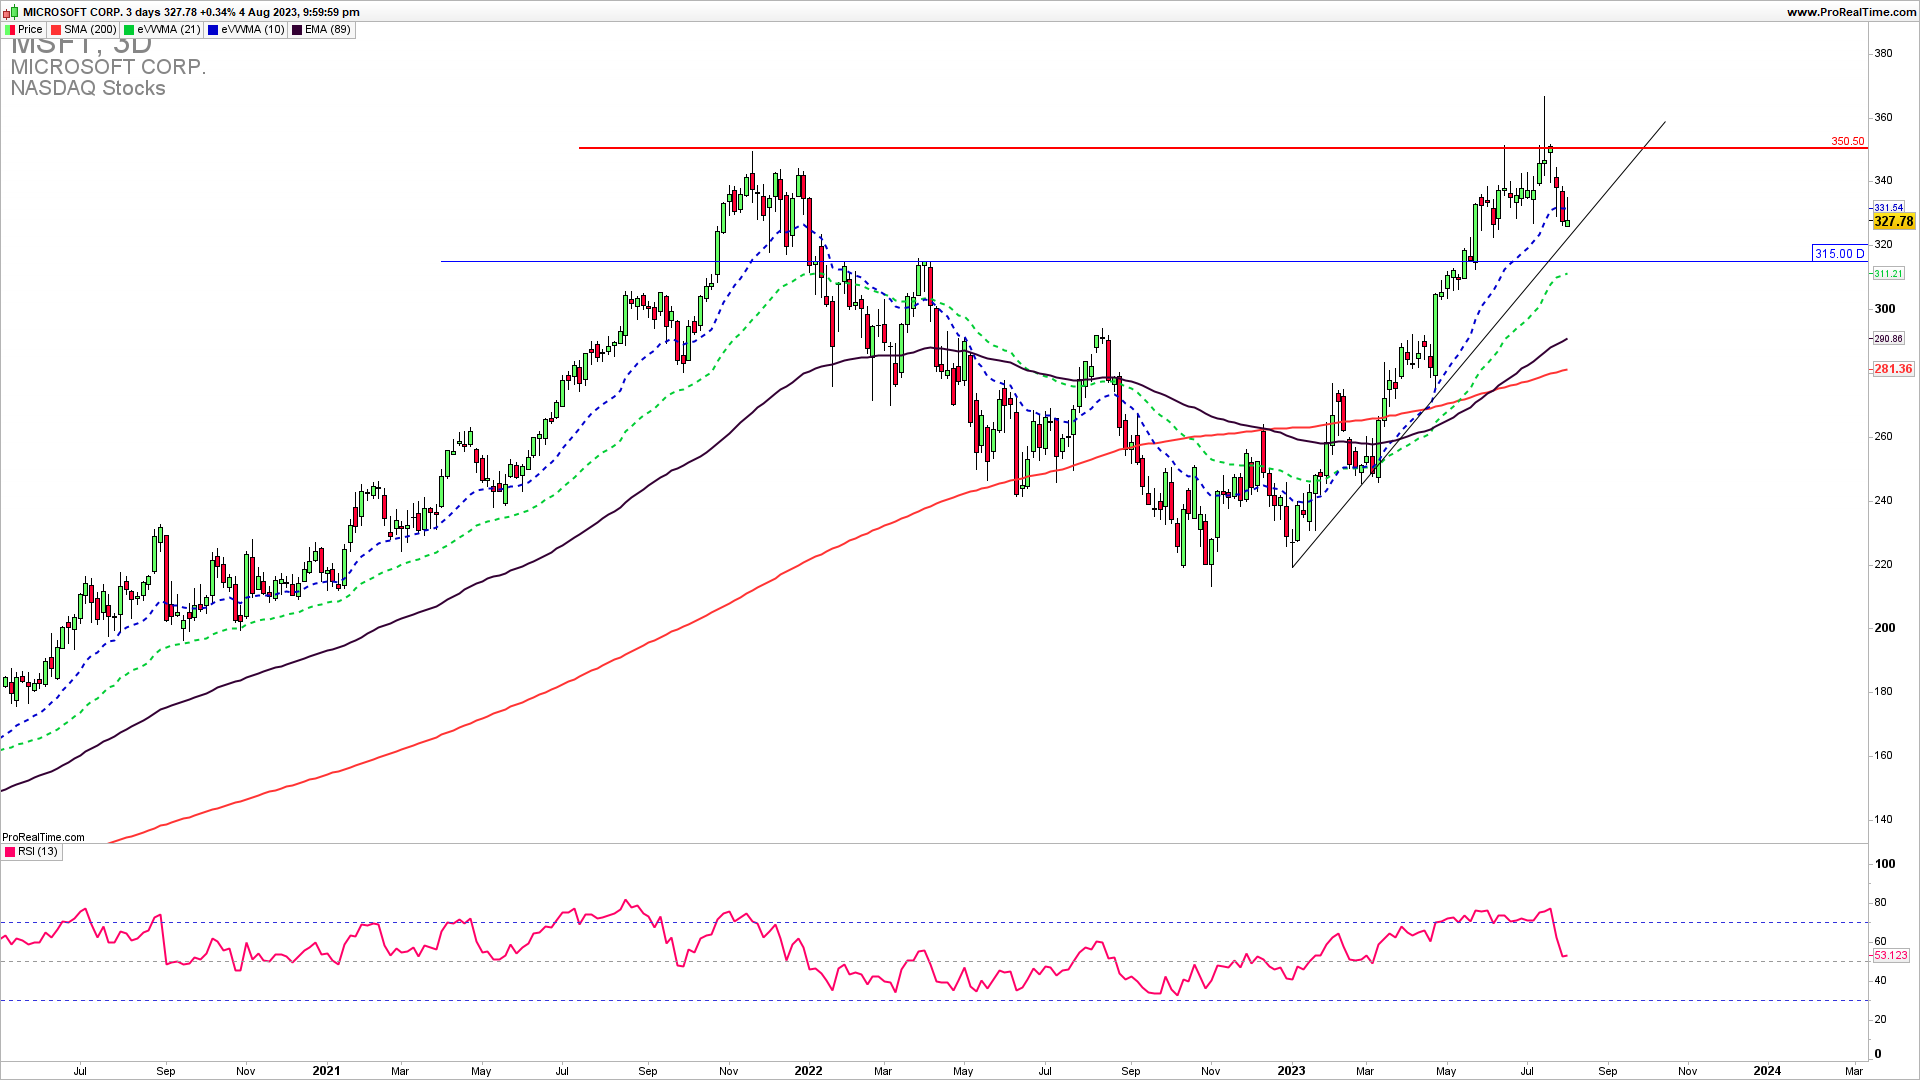
It is a fact that a strong upside resistance for Q3 is 350 and we have seen a rejection from it. If we get a confirmed break below 315 we could see an extension lower to key medium-term to long-term support 290. A break below this level would mean a complete turnaround. Near-term, long-trade entries have a higher probability of success. There is a possibility of long trade entry and short trade here. We can open the long trade here with a little risk and stop the loss below 315 and the short trade if we get stopped from the long trade. Also, there is a trading strategy with options that can be combined.


