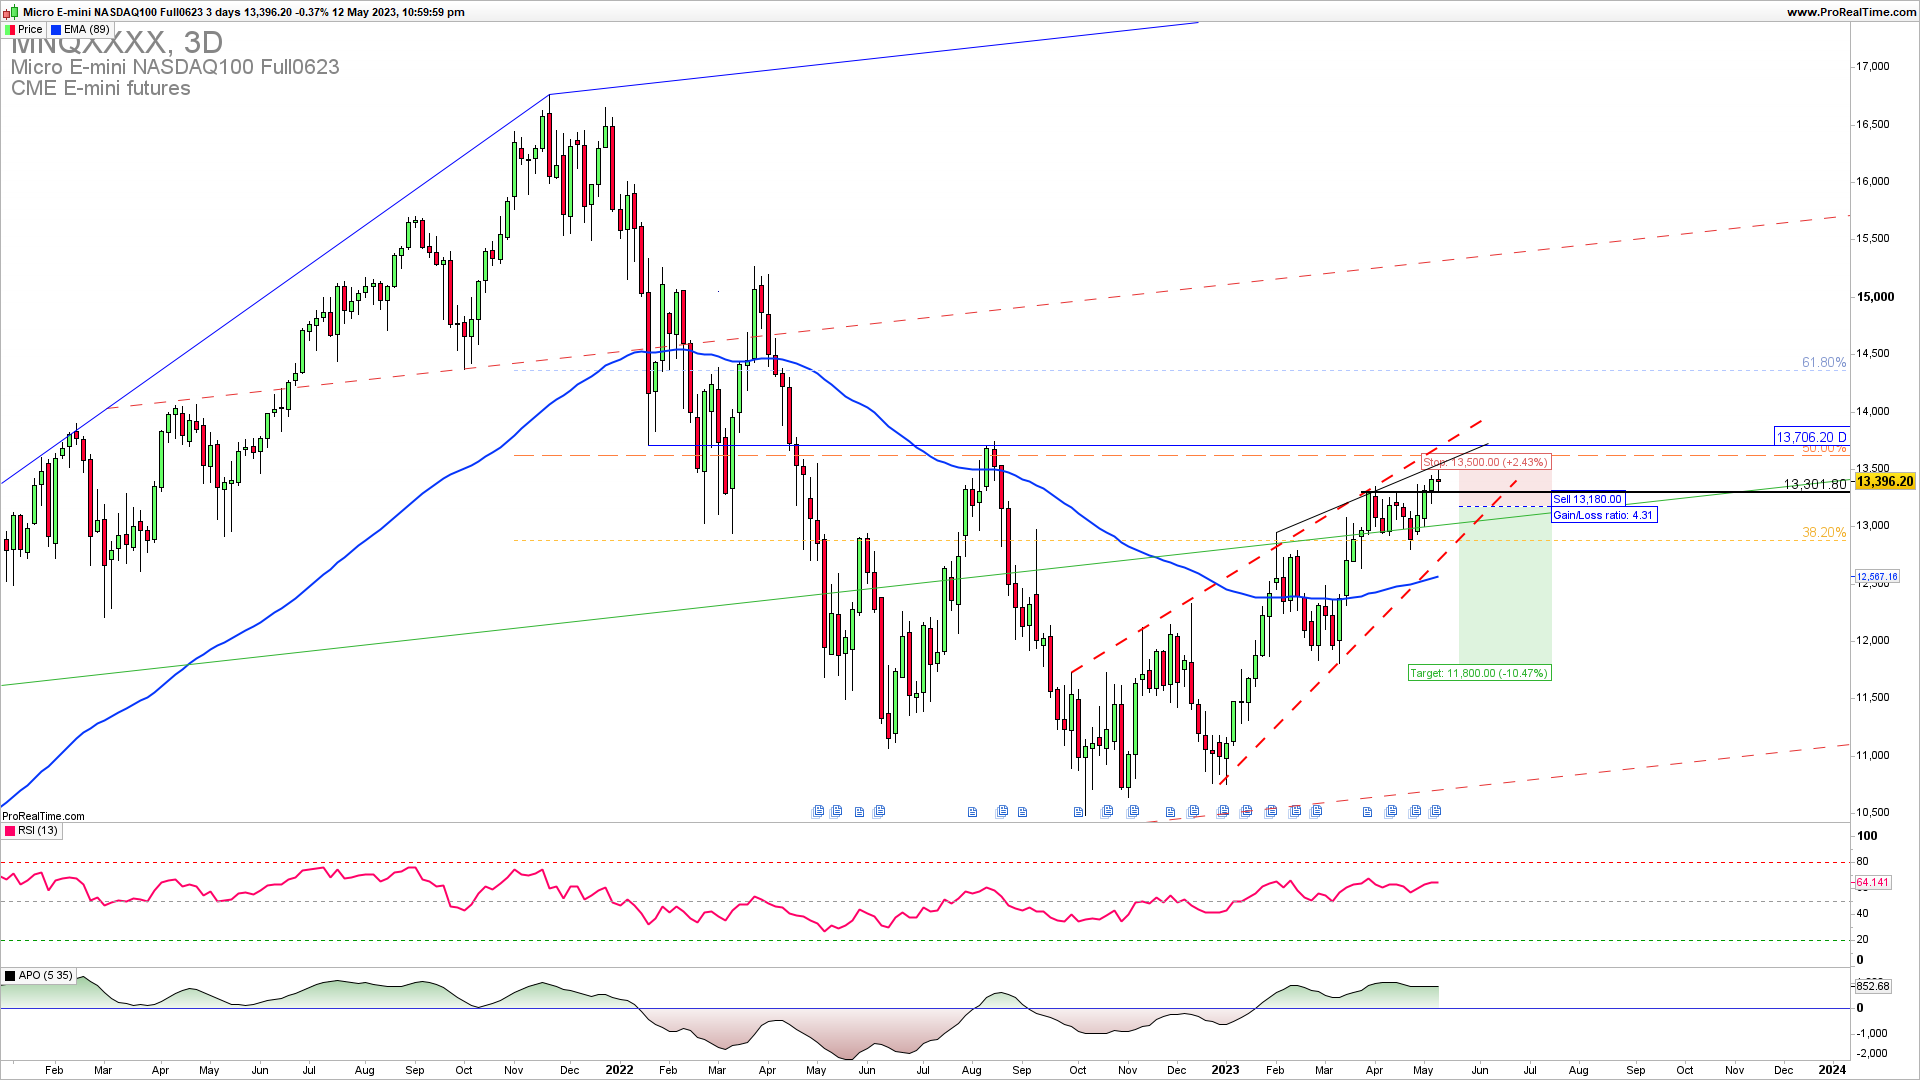
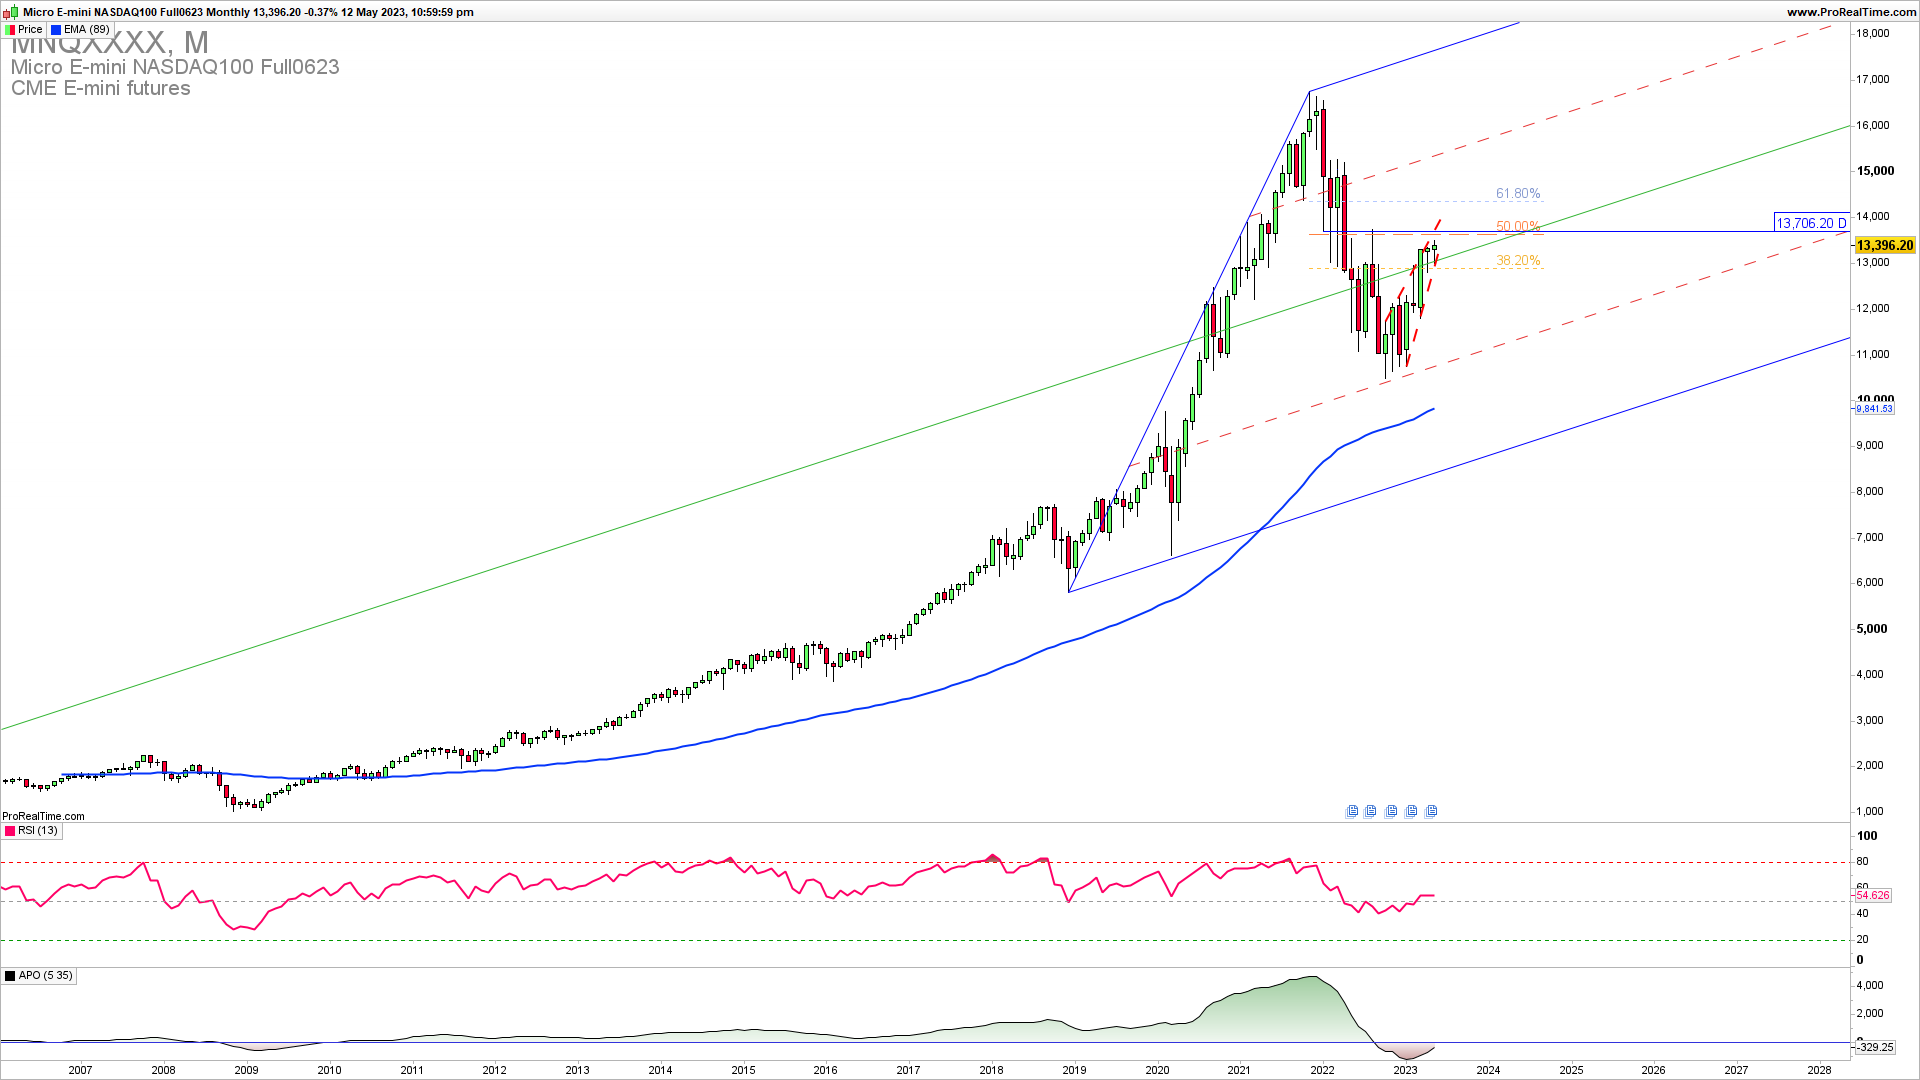
It has been six months of the upside without a new low for the NASDAQ. We are seeing on the monthly chart now a well defined rising wedge just beneath the Fibonacci retracement of the latest swing down from October 2021 to October 2022. The key level for an upside extension or the downside reversal stays at 13700.
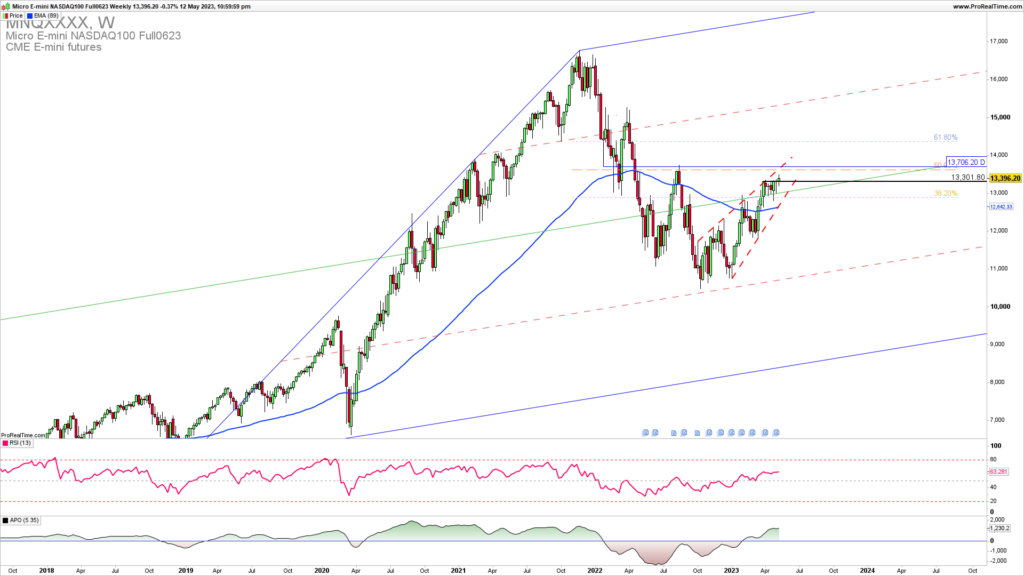
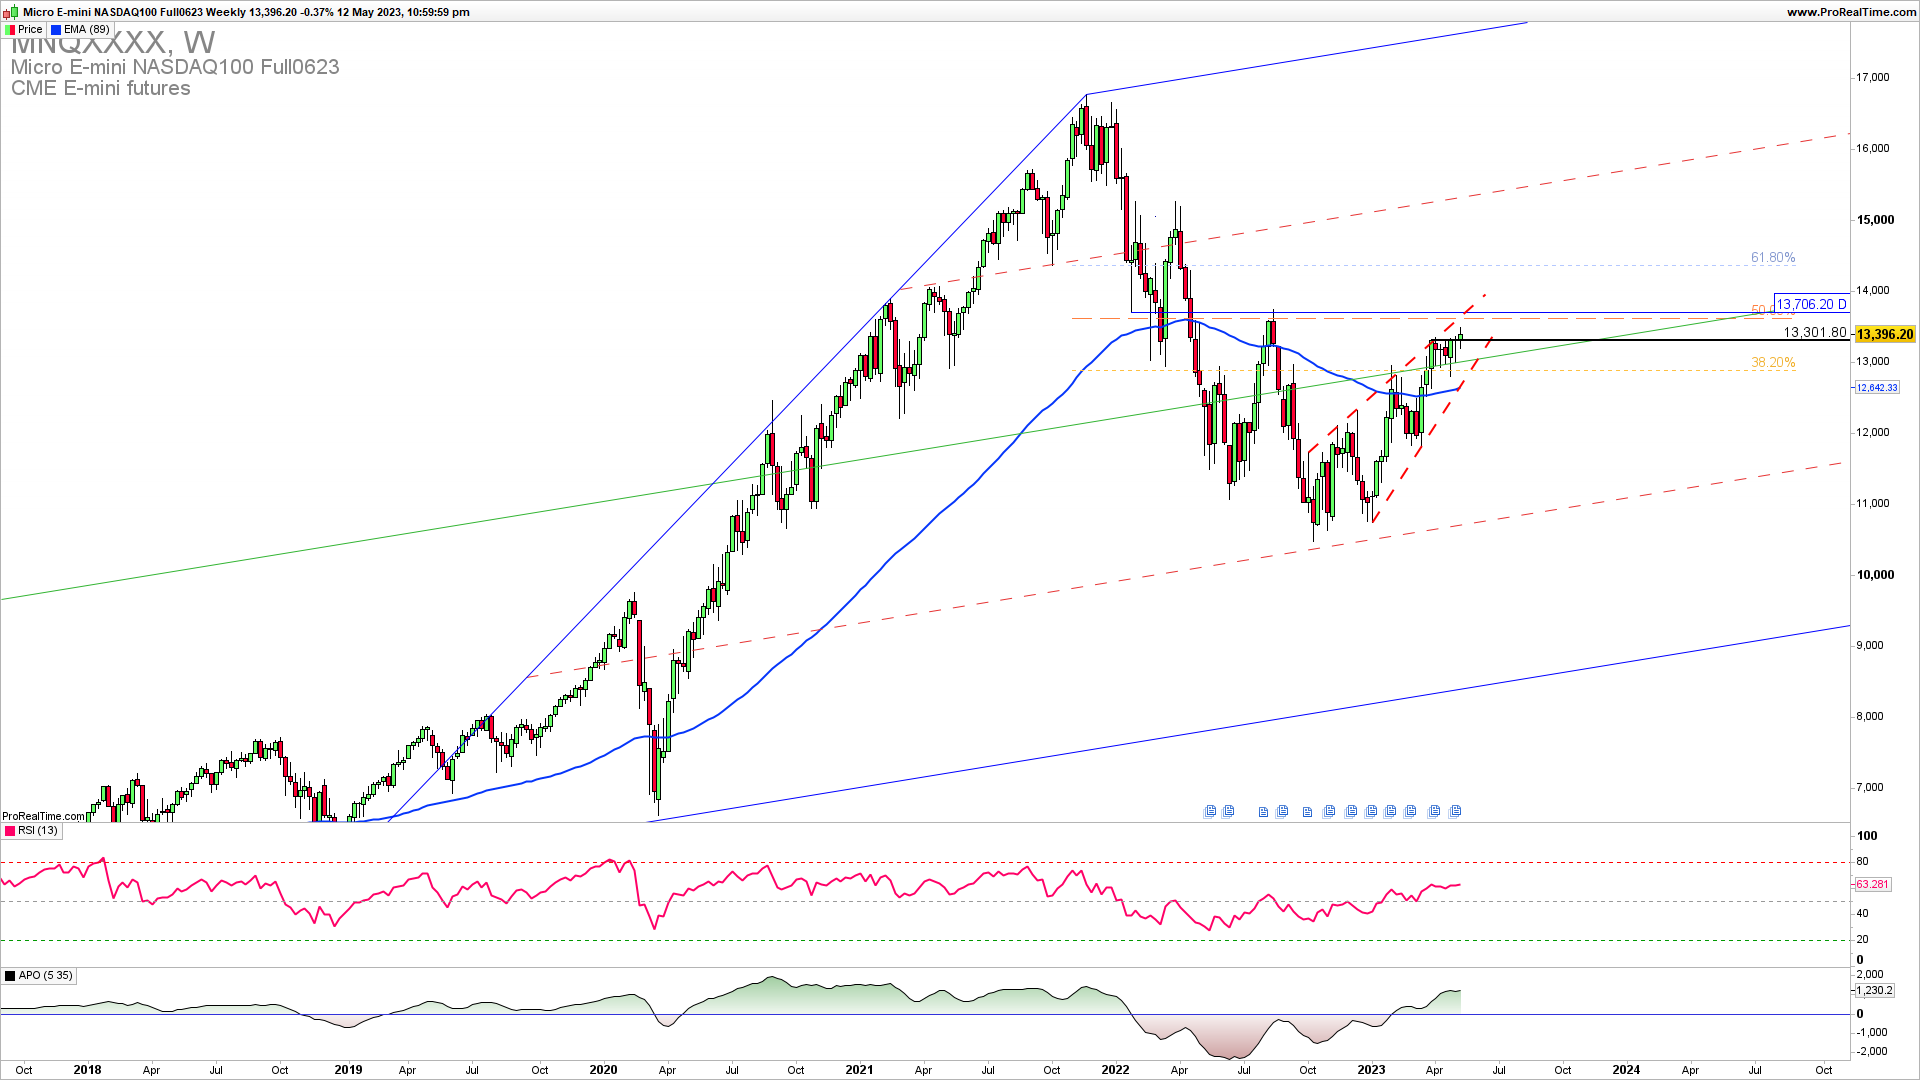
The weekly NASDAQ chart is showing a consolidation at the top of the rising wedge. The lack of a significant break above 13700 could open the door for a possible reversal lower and a test of 12960 which is a downside resistance and a support of the rising wedge. Now only a break above 13700 will invalidate the short-term downside reversal, and a break below 13300 is required for a nice short trade in the coming week.
As the famous trader says…
“What is most important isn’t knowing the future — it is knowing how to react appropriately to the information available at each point in time.”
Ray Dalio
How to trade this?
Obviously, for Q2 2023, we have this upside resistance of 13700 which should be broken higher for an upside continuation. This means that now short trade entries have some advantage over long trade entries as the overall long-term trend is still in a downtrend and there is a substantial upside resistance zone with increasingly slowing price action. It would be best if you opened a short trade here first. The risk to reward on this trade is higher than 1 and the timing of the trade could be on Monday or Tuesday NY session upon a break below 13300 with the stop loss above 13400 to target first 12900 and if broken 11800.


