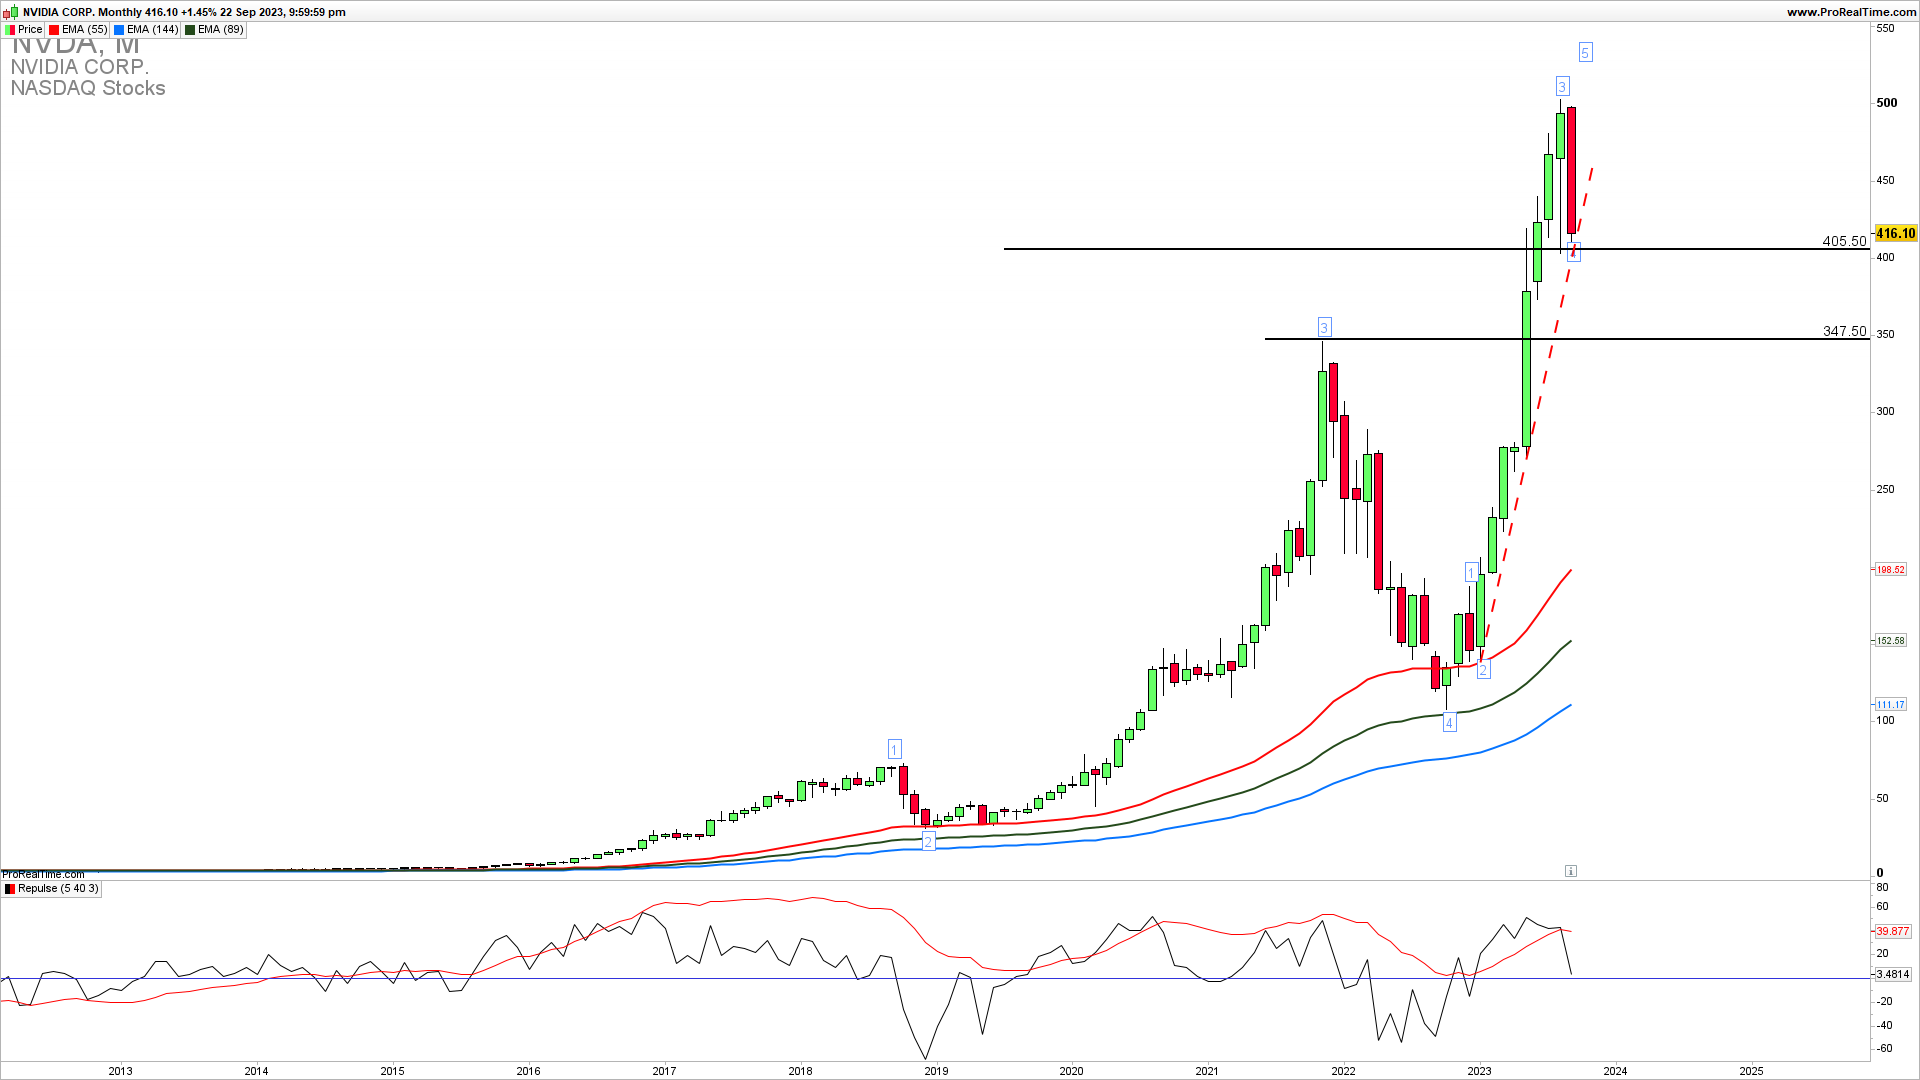
The monthly chart shows that Nividia is testing strong support of an uptrend long-term line and the previous monthly low 400 level. On the chart, you can see a strong monthly pullback but it is hitting the support and a strong downside resistance. For a continuation higher we need to see a confirmed bounce off this support.
SPECIAL LAST SEPTEMBER OFFER MENTORING WITH PORTFOLIO OPTIMIZATION $300
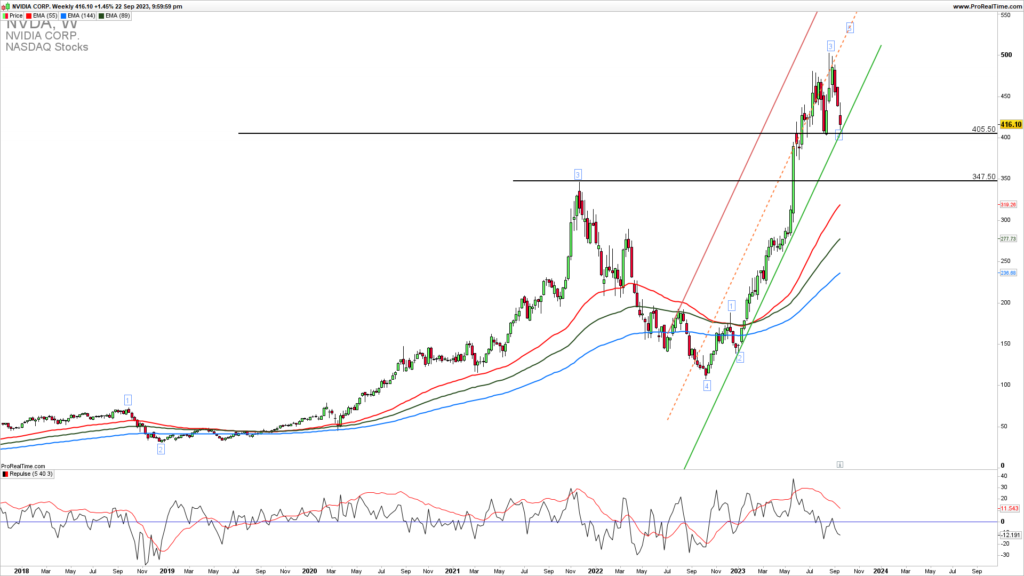
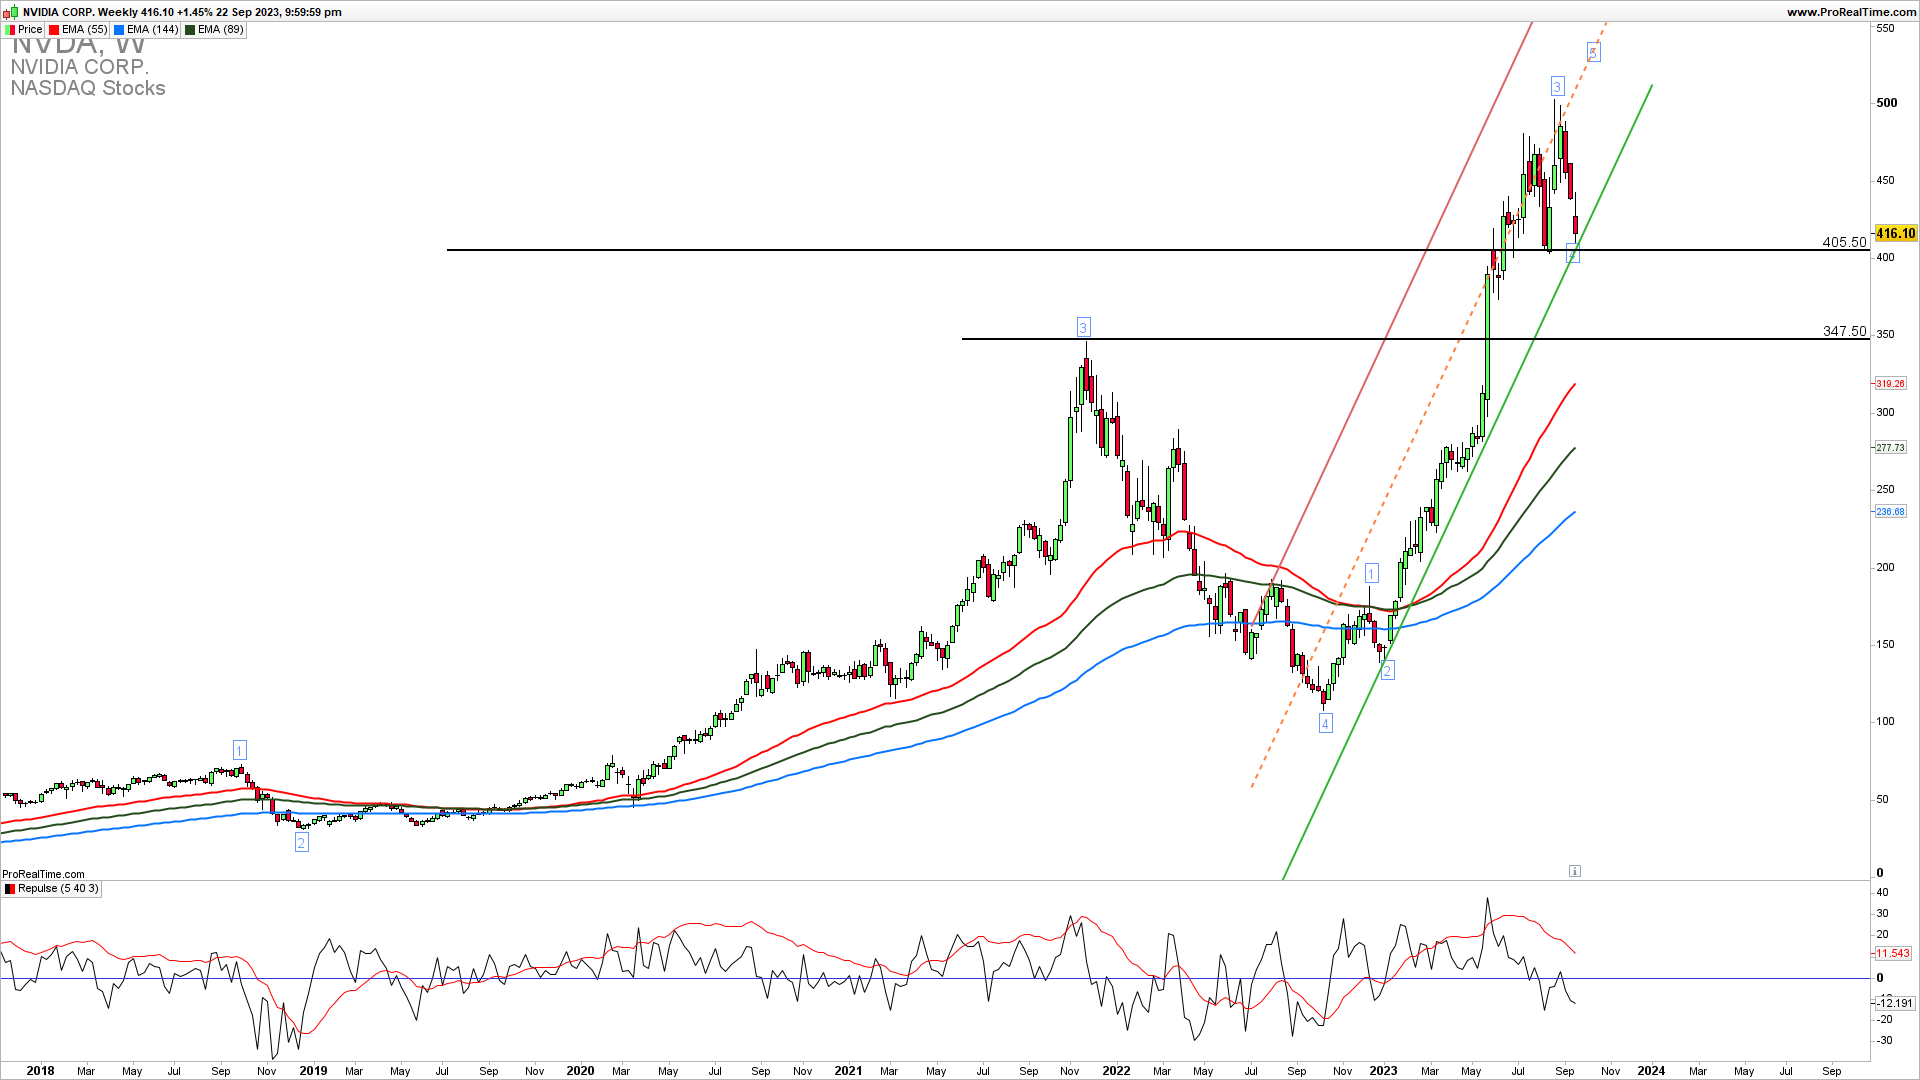
The Weekly Nividia chart reveals a strong uptrend channel and horizontal support confluence of 400. This is the first vital line of defense for the existing uptrend supported by a rising uptrend channel and a horizontal support line and it is also a breakout point in the case we got a confirmed break below for a deeper pullback into 347. This zone should hold for the extension higher. A bounce here followed by a break above 430 could lead to an upside continuation.
GET THE CHART OF THE DAY EVERY DAY IN YOUR INBOX
As the famous trader says…
“If you personalise losses, you can’t trade.”BRUCE KOVNER
How to trade this?
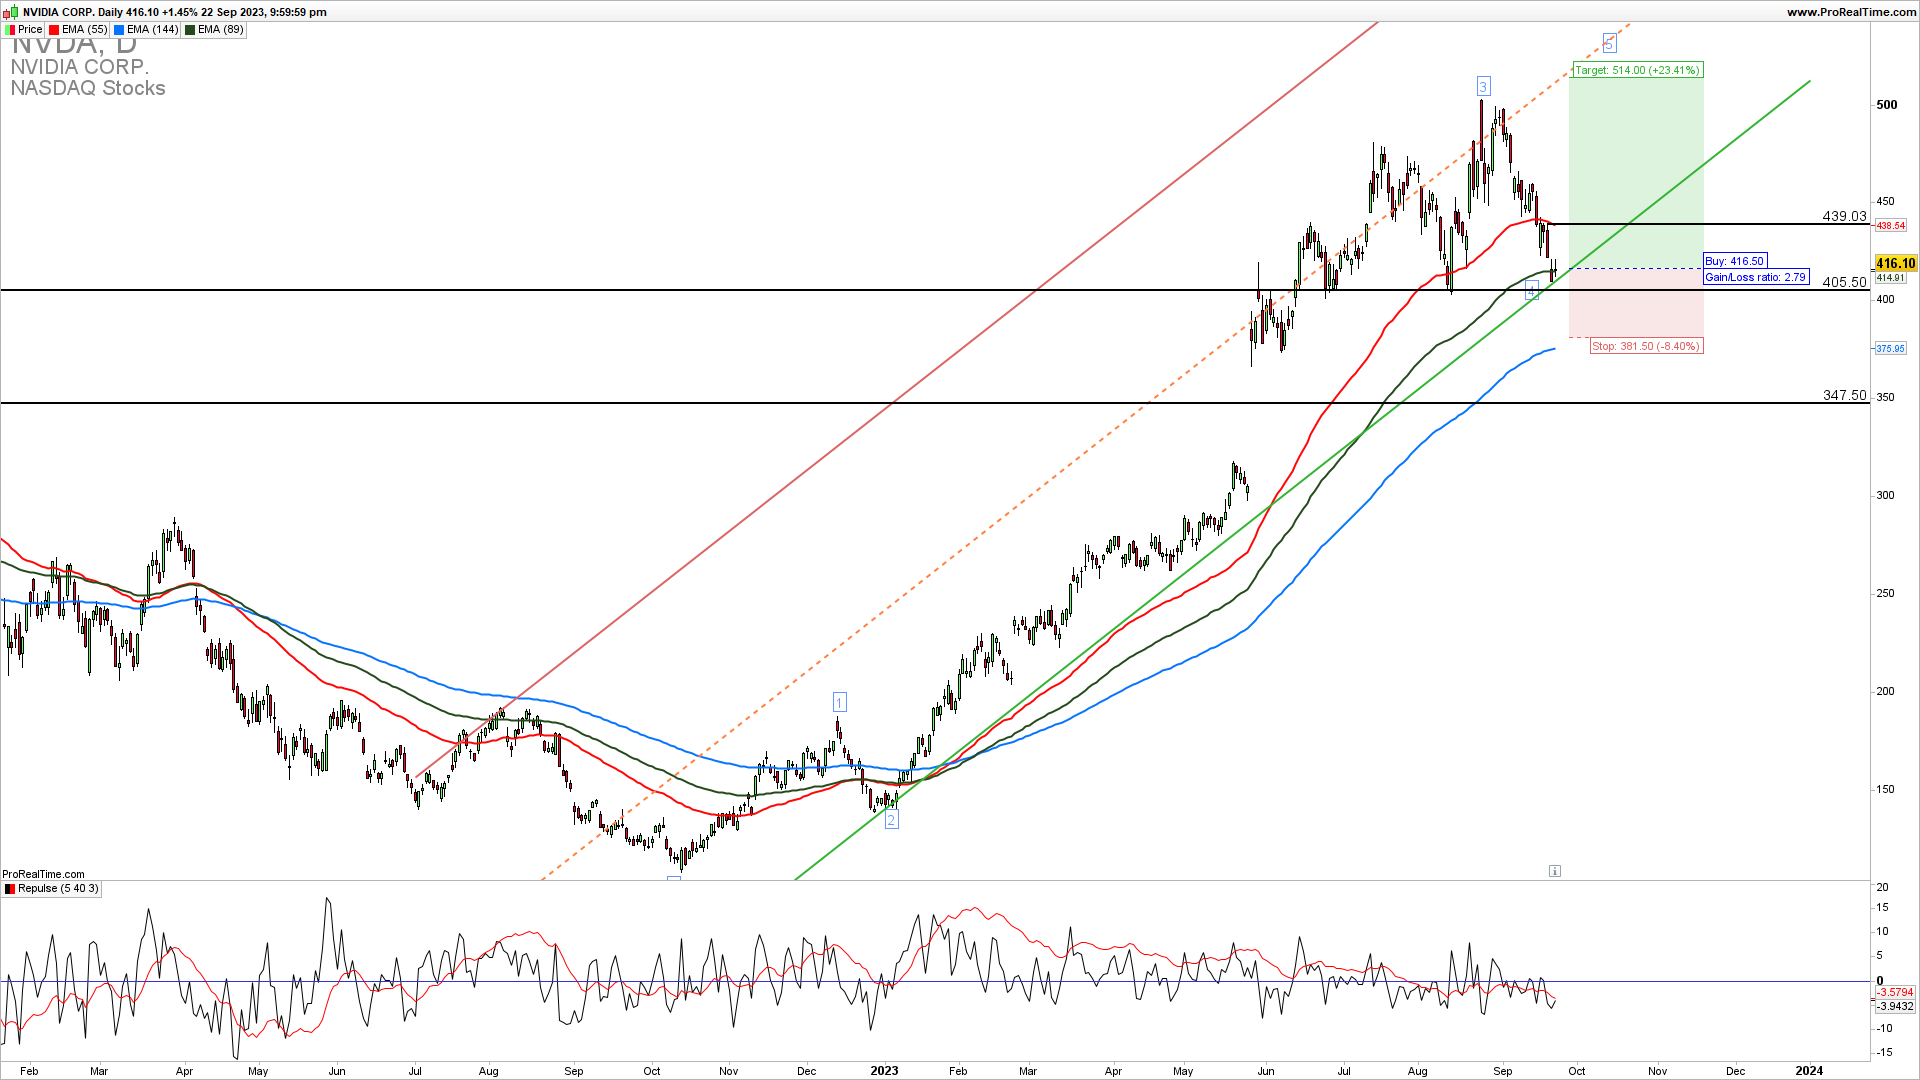
It is a fact that a strong upside support for Q3 is 400. If we get a confirmed extension higher in the coming weeks above 450 we could see an upside continuation and a test of 500 soon. A break below 400 would mean a complete turnaround. Near-term, long-trade entries have a higher probability of success. There is a possibility of long trade entry and short trade here. We can open the long trade here with a bit of risk and stop the loss below 400 and the short trade if we get stopped from the long trade. You can trade this price action with the options as well.

