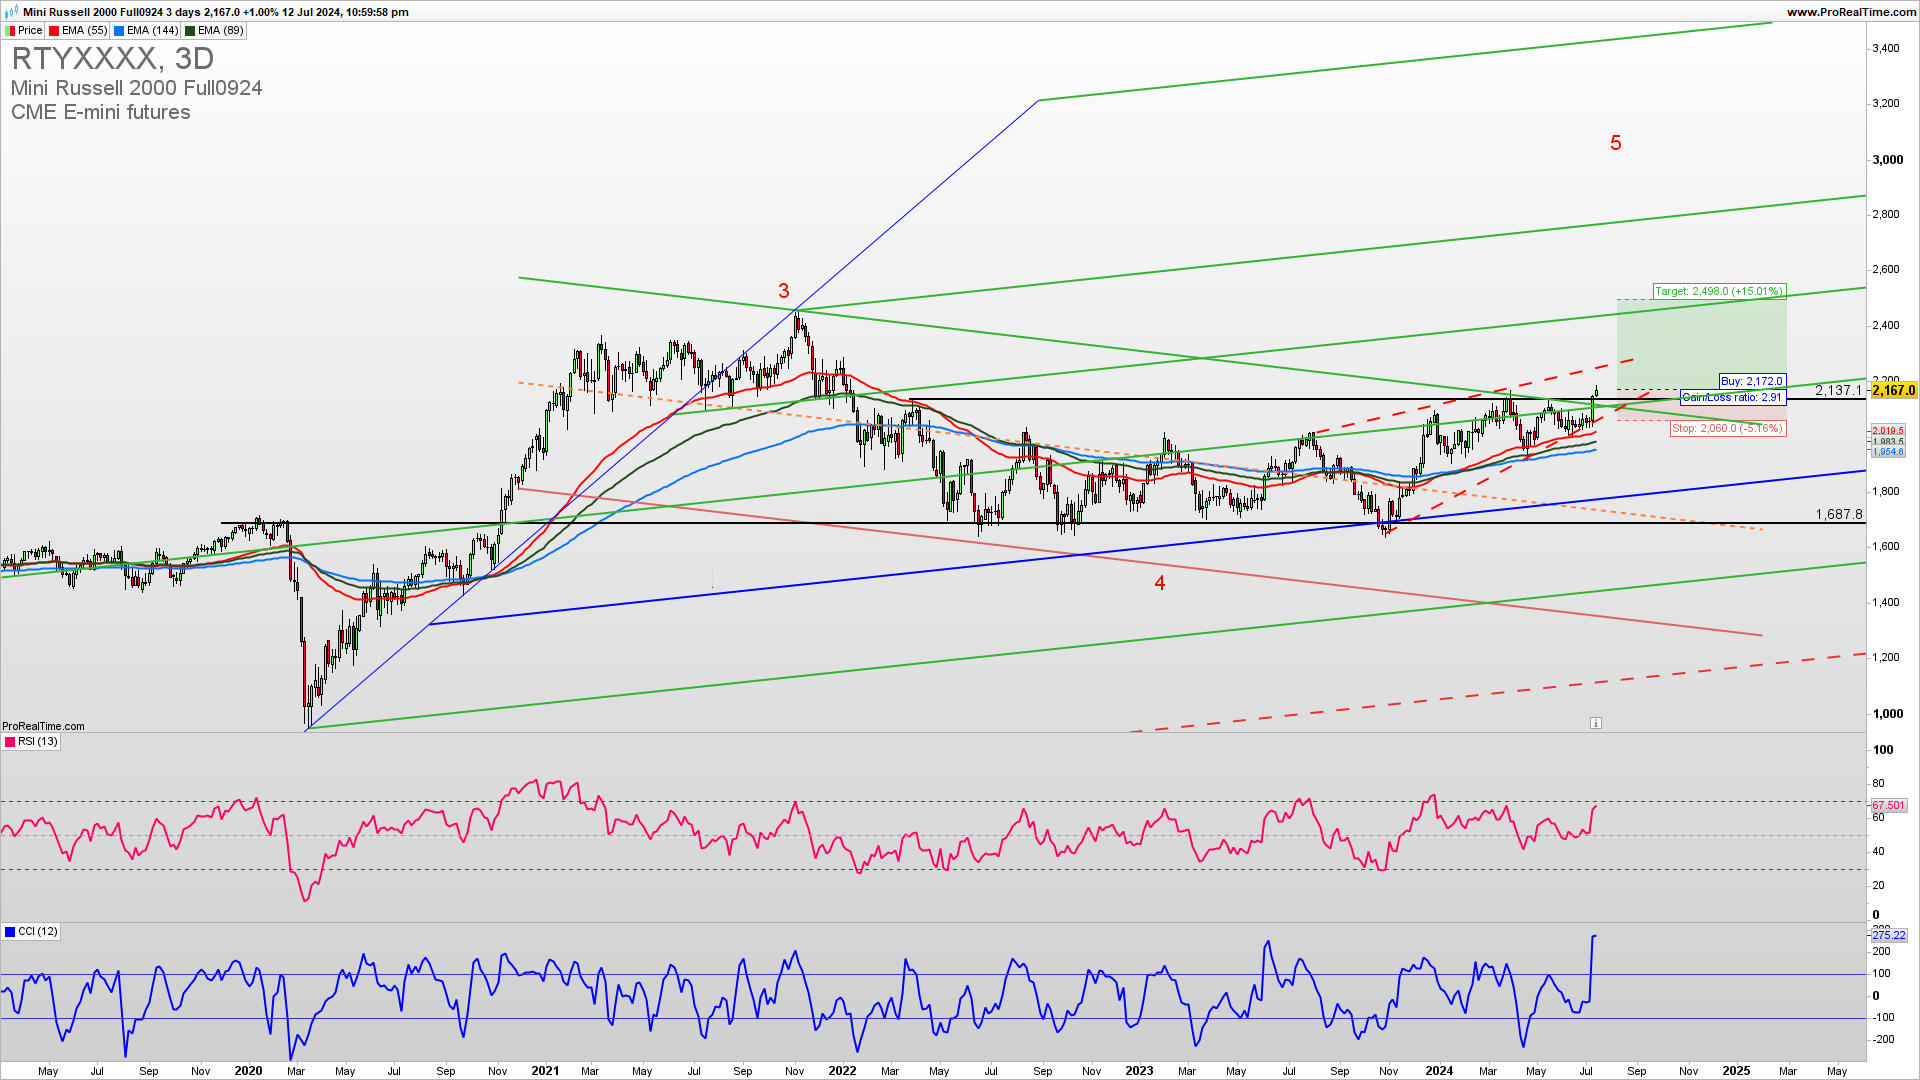
Russell2000 is in the process of breaking above the 2130. This should confirm a break for the fifth extension higher to 3000. The next big resistance is 2200. This should be a fifth-wave extension. Learn to Trade Indices profitably.

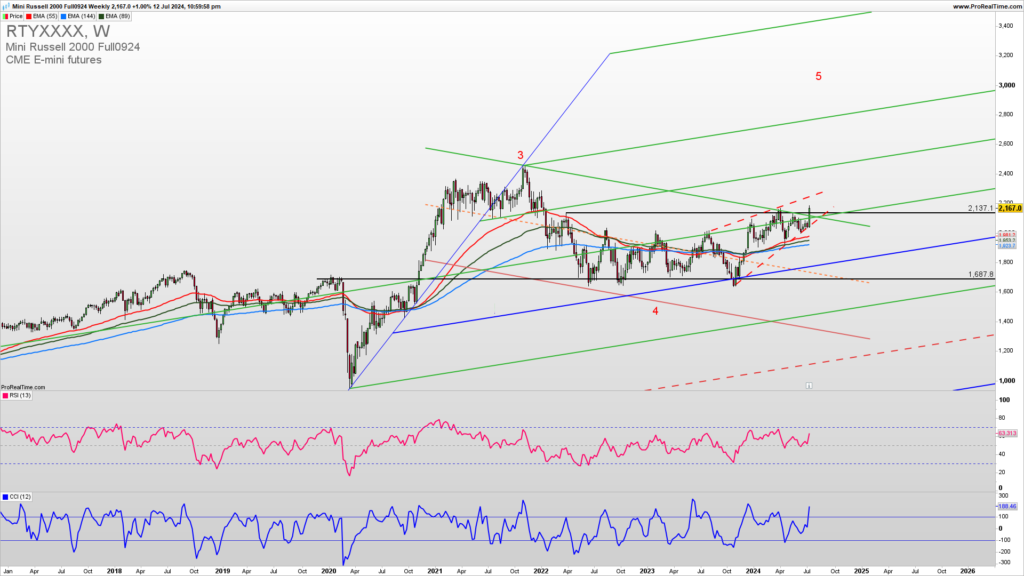
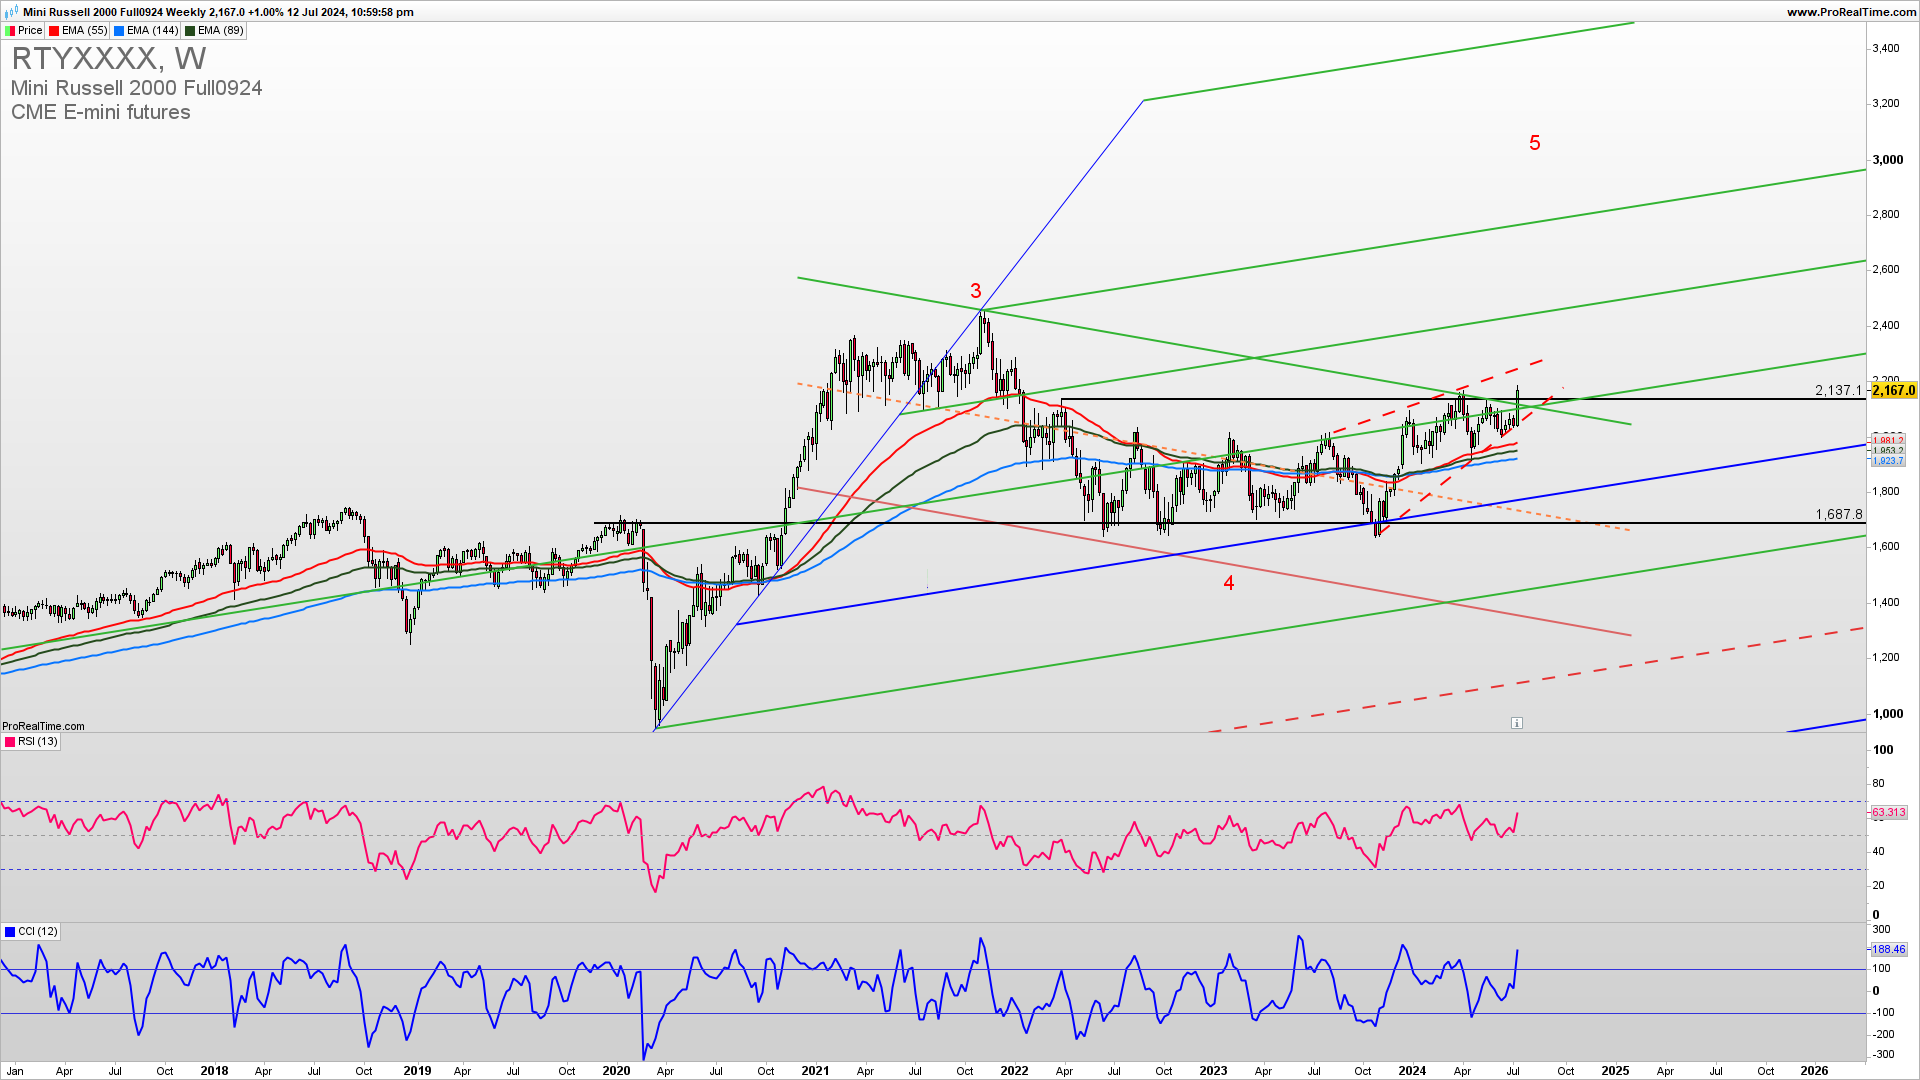
The Weekly Russell2000 chart reveals a bounce from the wedge support 2040. At this point, buy positions are possible as the Russell2000 is breaking above the strong upside resistance 2138. Overall support for the upside even if it breaks below 2034 is 1900 and long-term support for a bullish trend invalidation is 1780.
GET THE CHART OF THE DAY EVERY DAY IN YOUR INBOX
As the famous trader says…
“If you can learn to create a state of mind that is not affected by the market’s behaviour, the struggle will cease to exist.”
Mark Douglas
How to trade this?
It is a fact that a strong upside resistance for Q3 2024 is 2250 and If we get a confirmed break above this level we could see a strong upside continuation in a fifth long-term upside Elliott Wave. Near-term, long-trade entries have a higher probability of success. Long trade entries can be placed here or a call option buying with a stop loss below 2060 with a first target of 2250 and if broken second target is 2456. The short-trade entry can be tried in the case of a break below 2060. For inquiries about account management please write to [email protected].