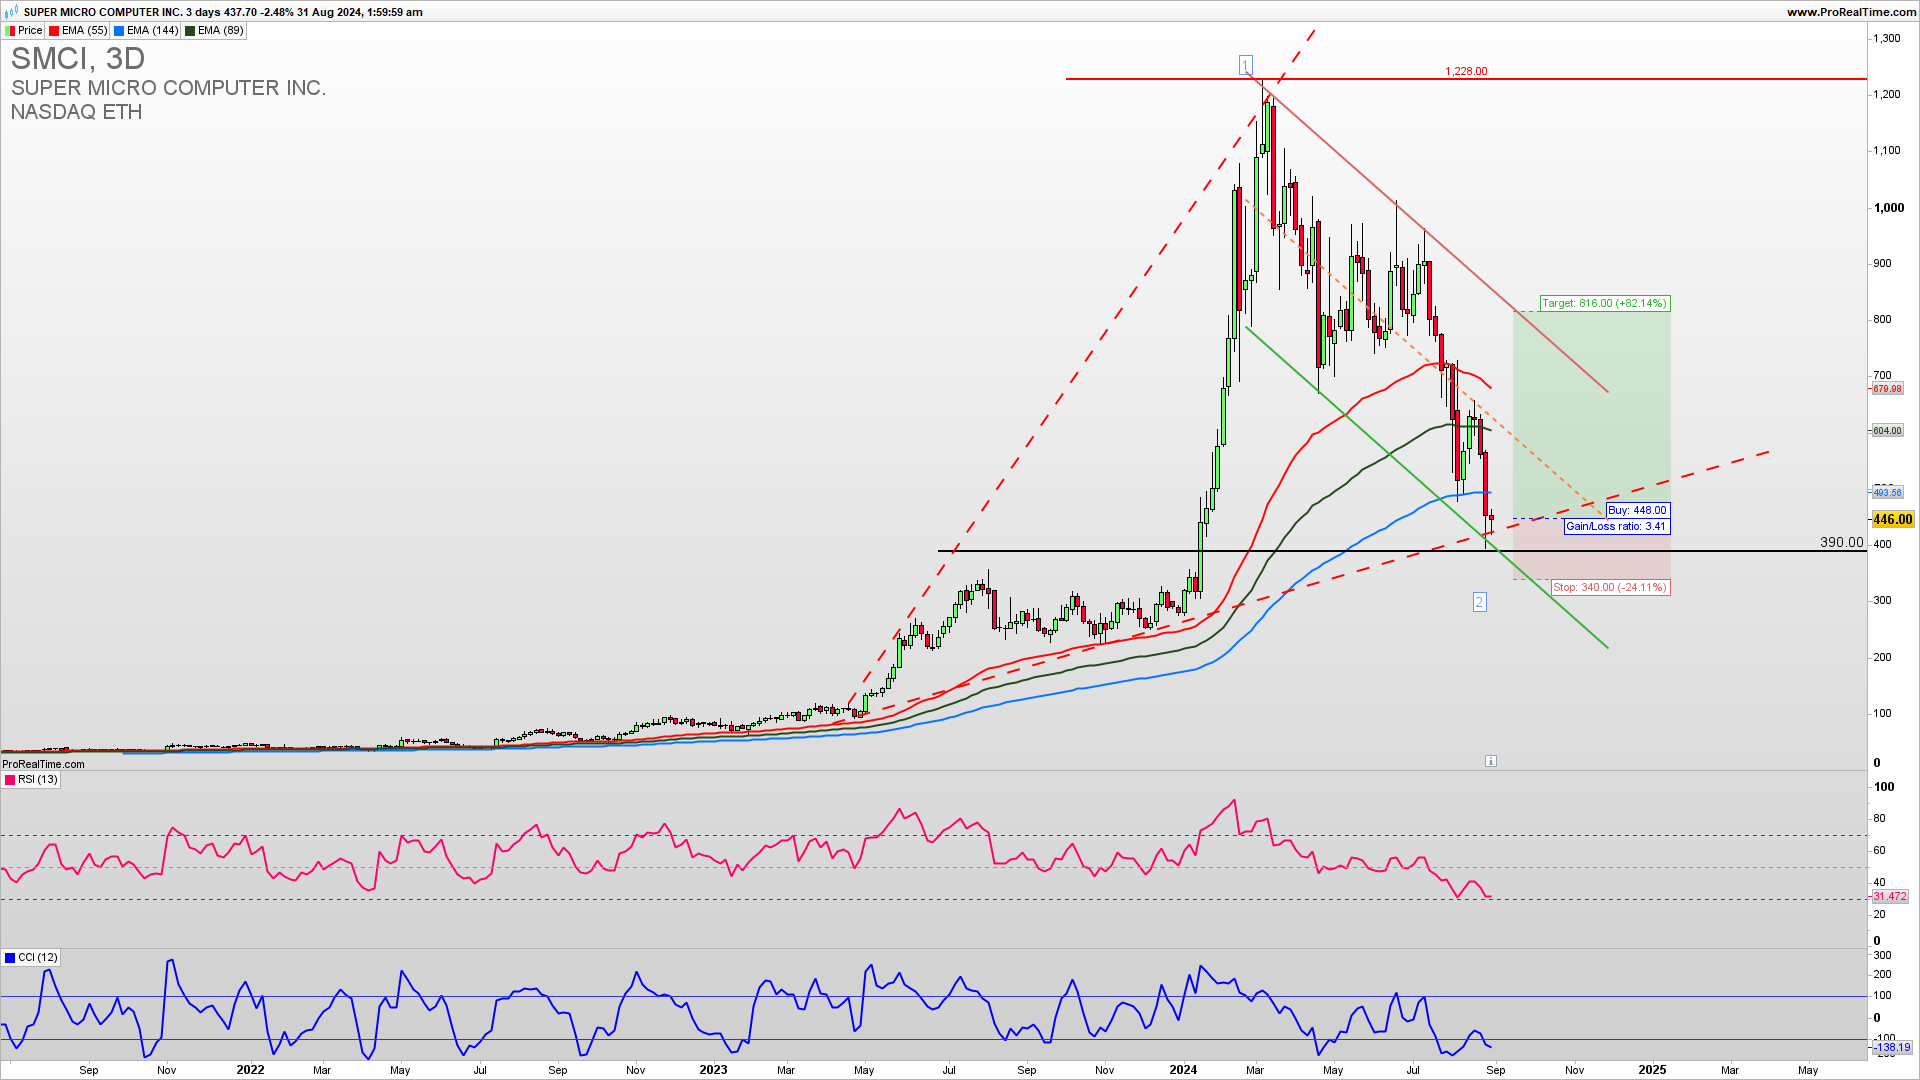
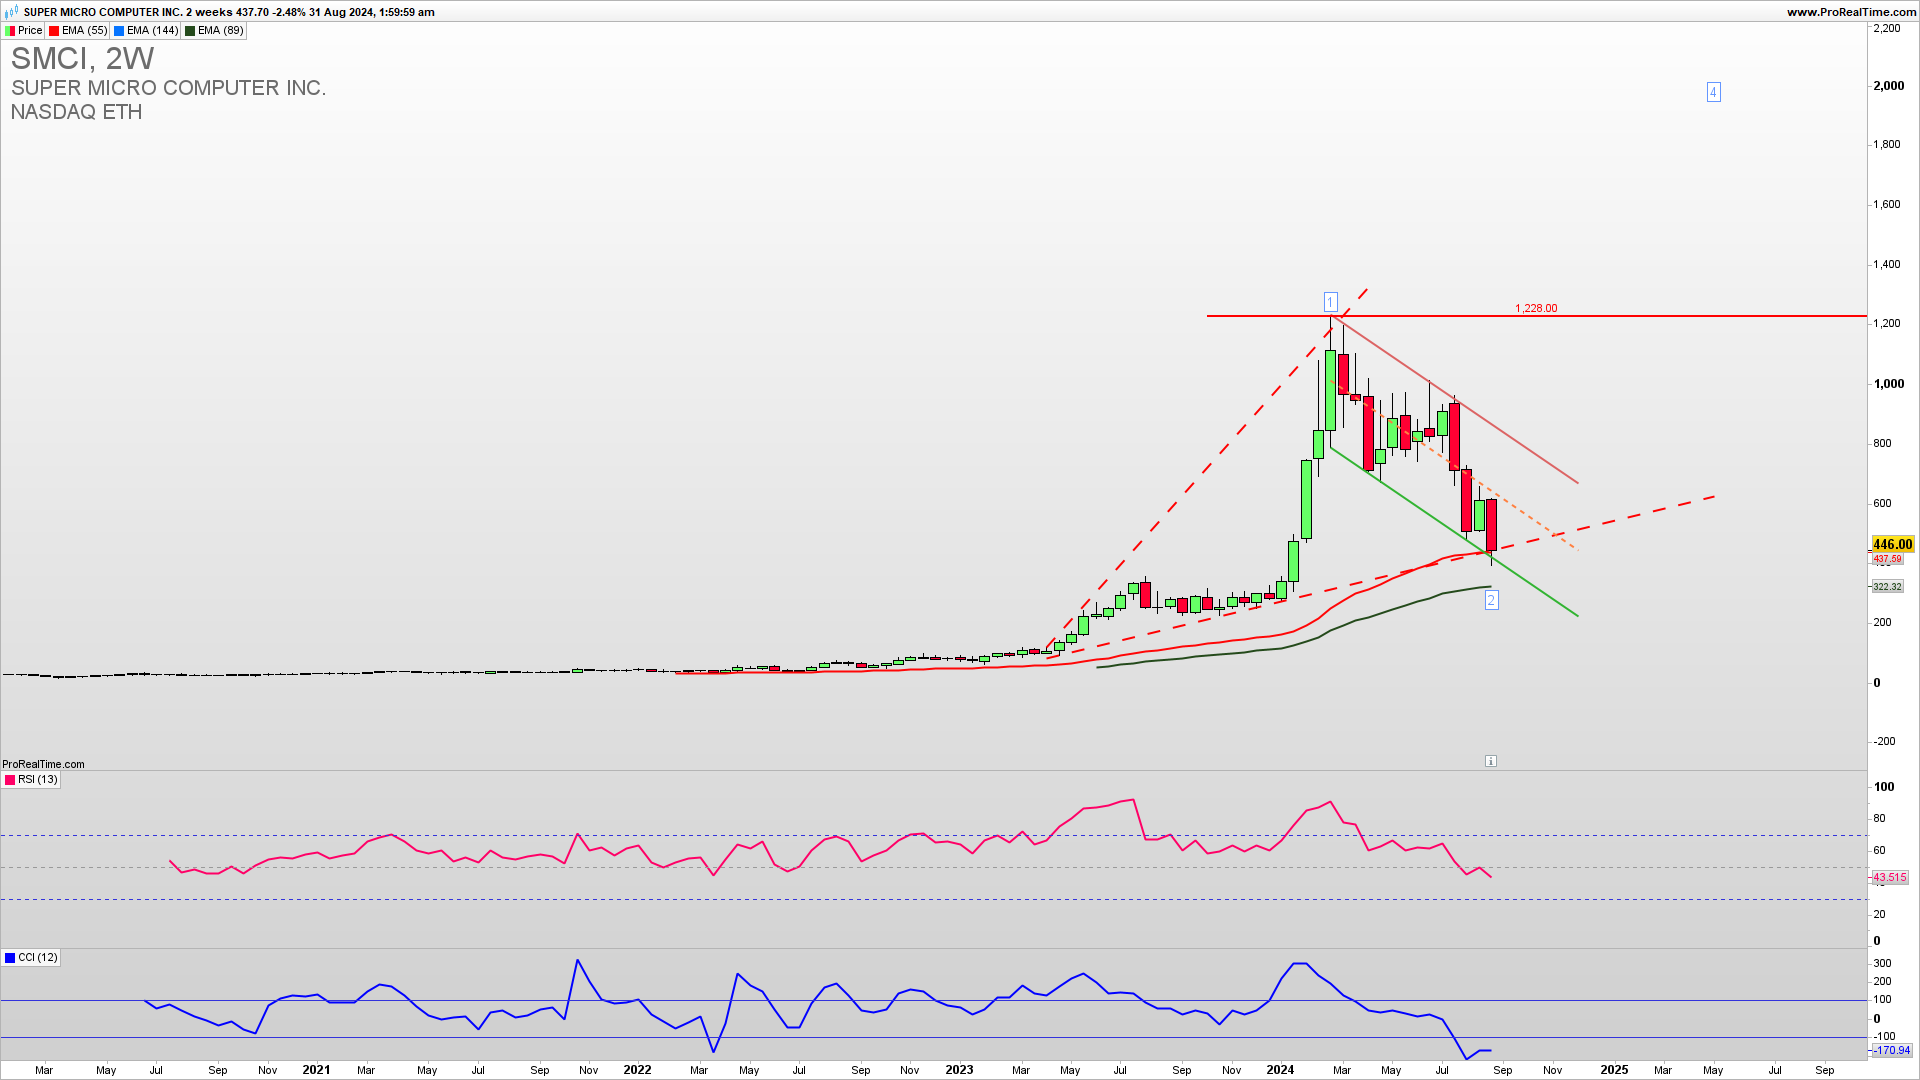
SMCI reversed strongly from the 1228 top recently because of the SEC investigation from 1000 to 400 which is the broadening wedge support. This was the ABC pullback in the second long-term uptrend medium-term wave. Despite the SEC investigation analysts expect a strong net profit and revenue increase in 2024 and 2025. A break above 770 is required for the extension higher in the third wave which will be confirmed only upon a break above 1228. Learn to Trade stocks profitably.
MENTORING WITH FUNDED ACCOUNT 40% OFF !
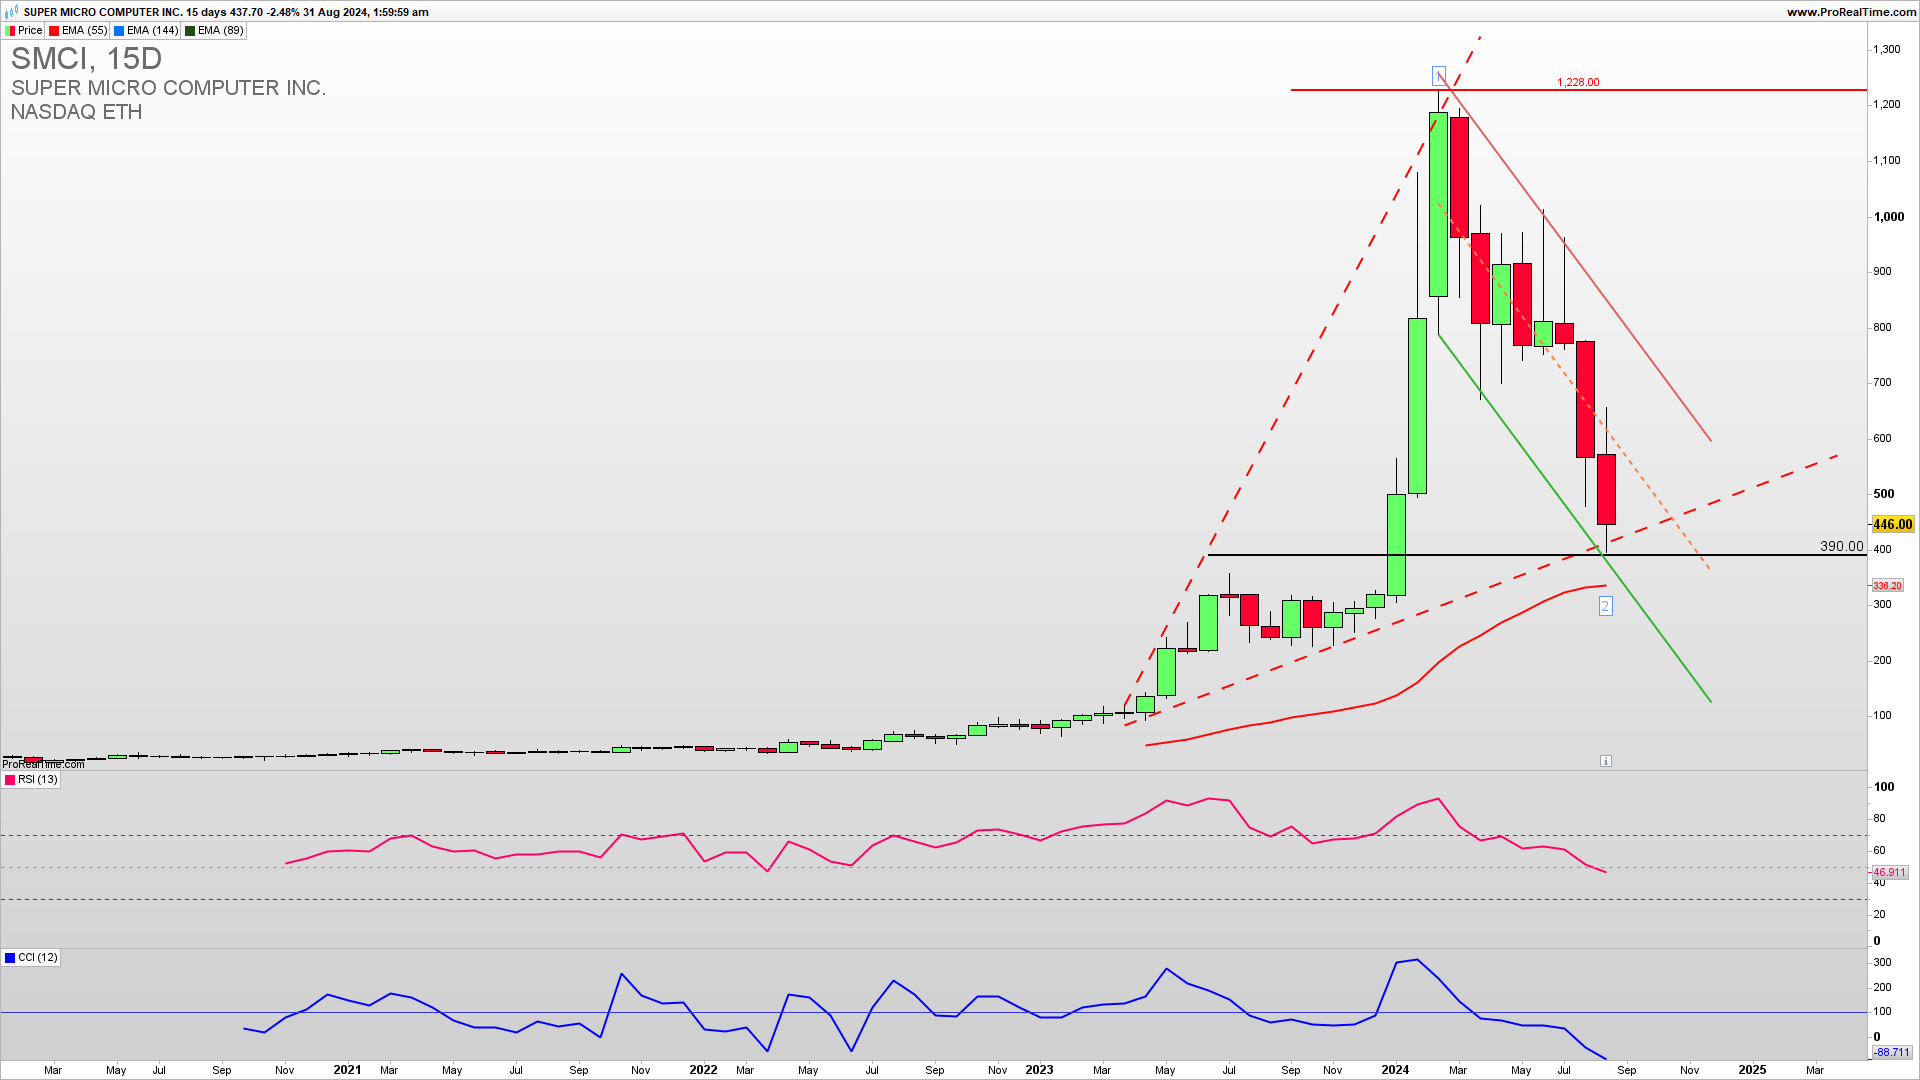
The 15-day SMCI chart reveals a bounce from the broadening wedge 390 support. At this point, buy positions have a higher probability of success as the SMCI had a big downside reversal which is not uncommon after the strong parabolic rise. Overall support for the upside even if it breaks below 390 is 336 and the final long-term support for a bullish trend invalidation is much lower at 300 which means that it still can develop a long and profitable third impulse wave higher. Following the price action we need to see a break above 570 for a test of 700 which is the falling channel resistance.
GET THE CHART OF THE DAY EVERY DAY IN YOUR INBOX
As the famous trader says…
“If most traders would learn to sit on their hands 50 percent of the time, they would make a lot more money. I don’t think you can consistently be a winning trader if you’re banking on being right more than 50 percent of the time. You have to figure out how to make money being right only 20 to 30 percent of the time.”
Bill Lipshutzc
How to trade this?
It is a fact that a strong upside resistance for Q3 2024 is 600 and If we get a confirmed break above this level we could see a strong upside continuation for 700 to begin a third long-term upside Elliott Wave. Near-term, long-trade entries have a higher probability of success. Long trade entries can be placed here with a stop loss below 350. RSI and CCI indicators are supportive of the bounce as they are showing signs of positive divergence. For inquiries about account management please write to [email protected].