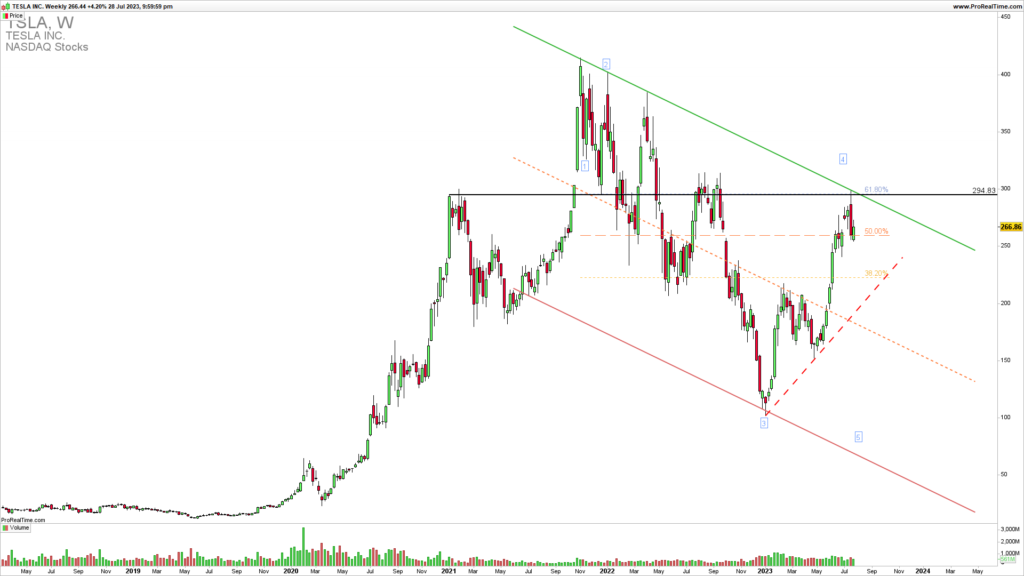
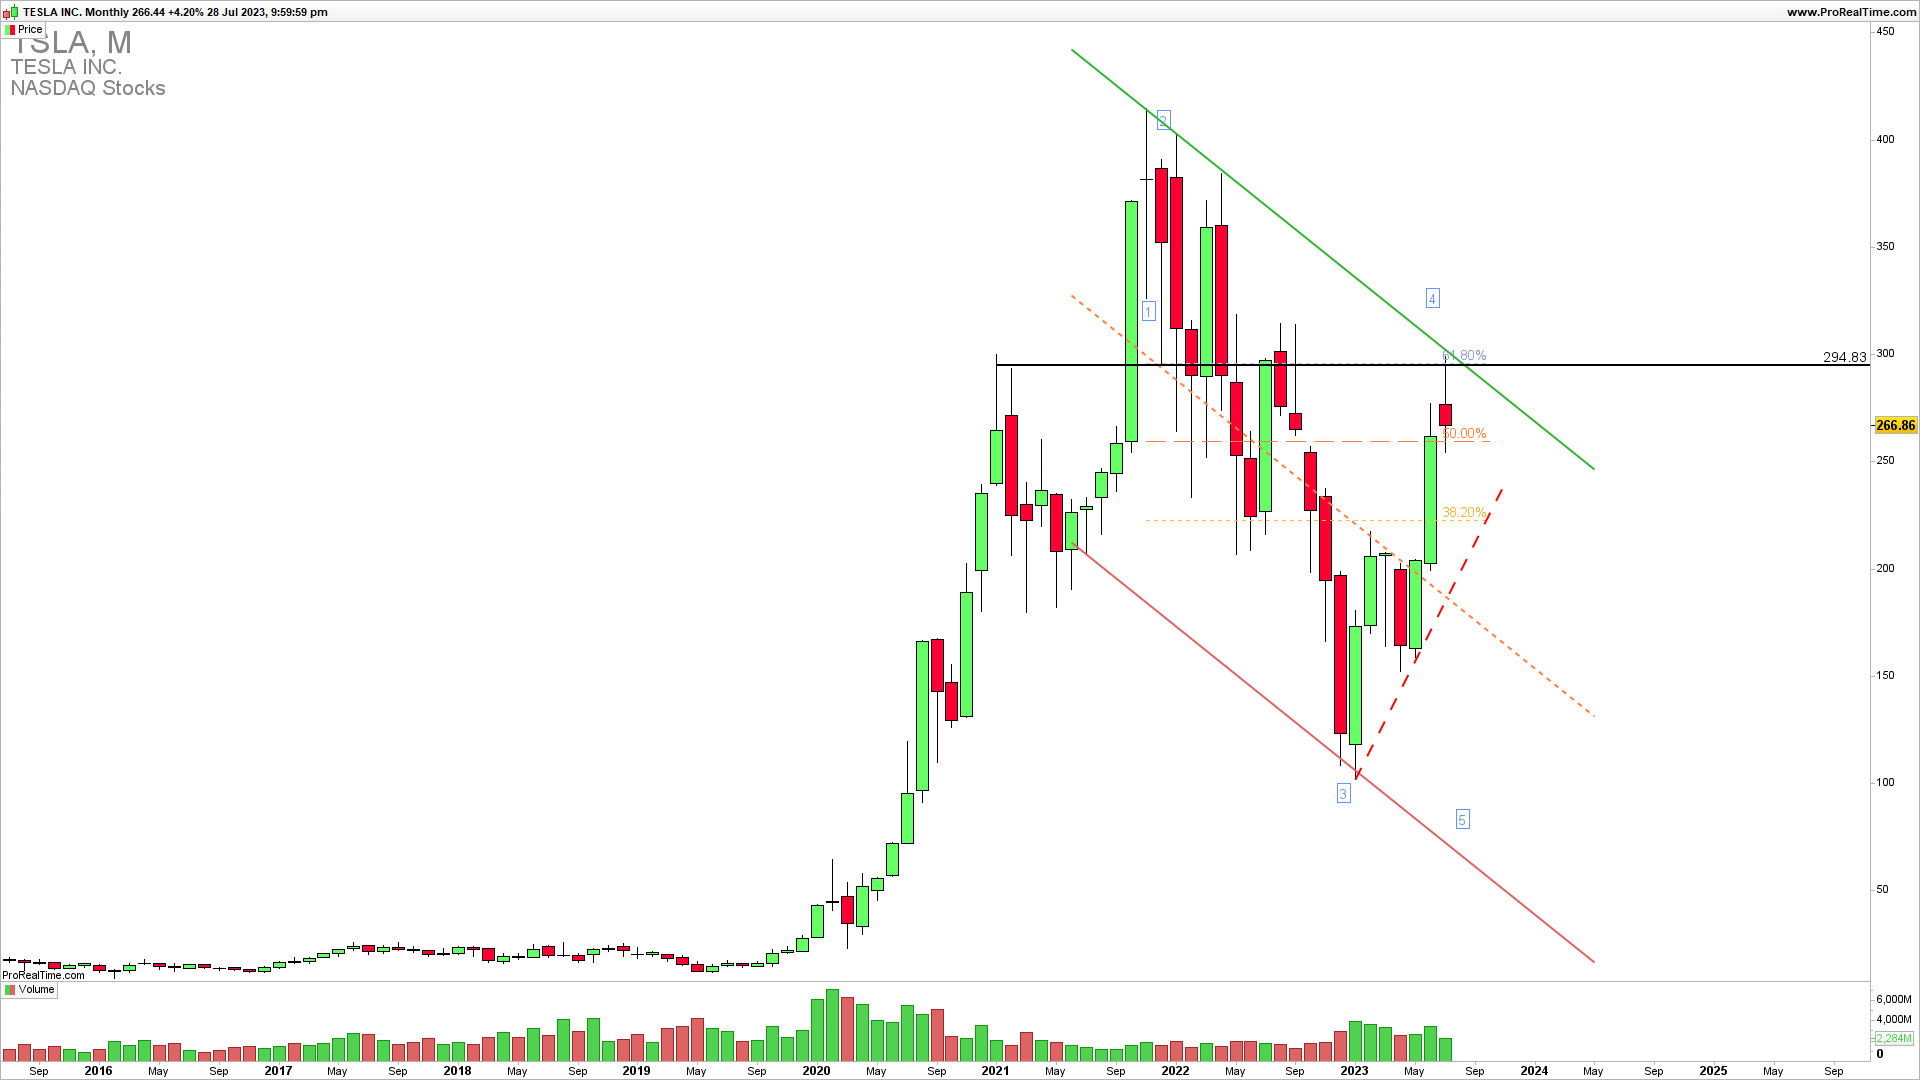
The monthly chart shows TSLA pullback lower after reaching a strong upside resistance of 300. It is testing the short-term support 254 for another attack on 300 higher or a complete reversal of lower to 220 where major support lies.
OPTIONS TRADING INTENSIVE COURSE INTRO PRICE 30% OFF COUPON CODE JULY30
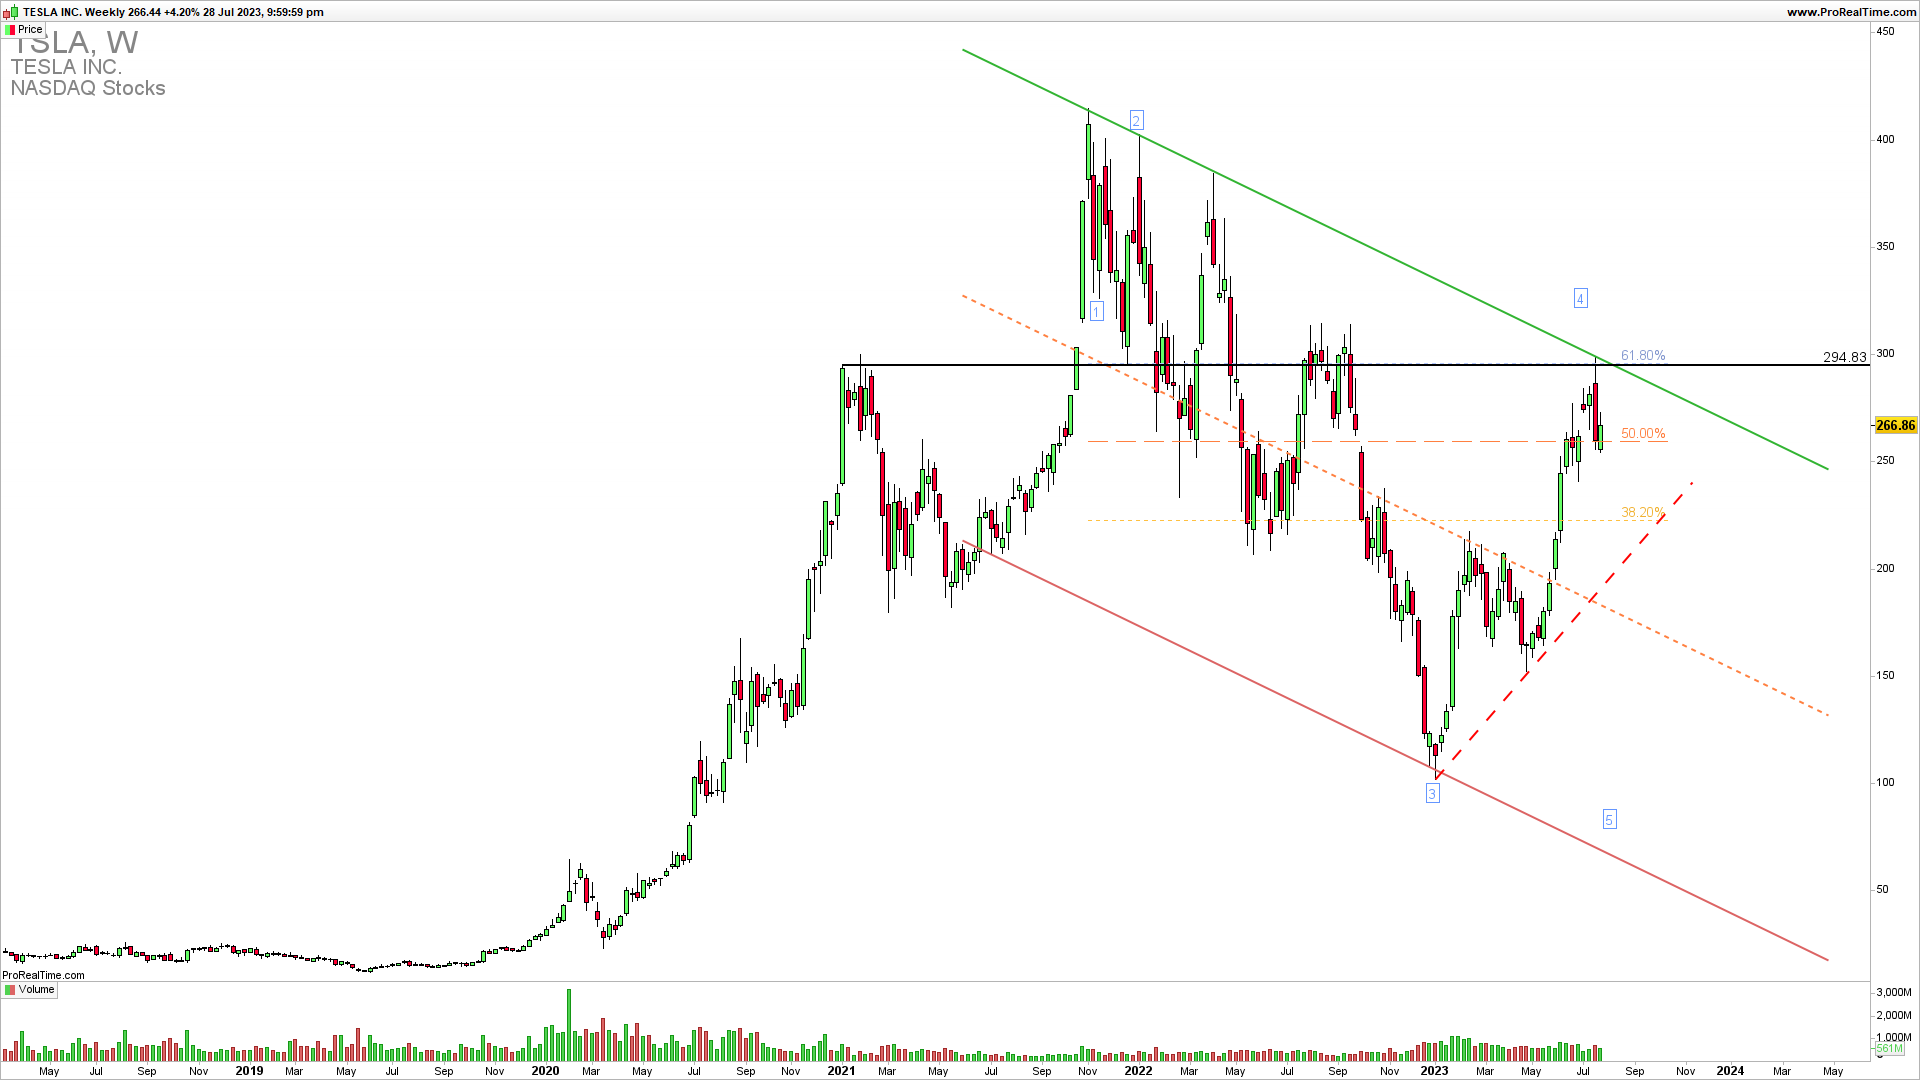
The Weekly TSLA chart reveals a possible bullish bounce from 254 for another attack on 294. A confirmed break below 254 will open the empty space of price action fall to 225 which represents the key support. A break below 225 will validate the Elliott Wave count indicating one more downside wave is coming.
GET THE CHART OF THE DAY EVERY DAY IN YOUR INBOX
As the famous trader says…
” You don’t need to be a rocket scientist. Investing is not a game where the guy with the 160 IQ beats the guy with 130 IQ.”Warren Buffet
How to trade this?
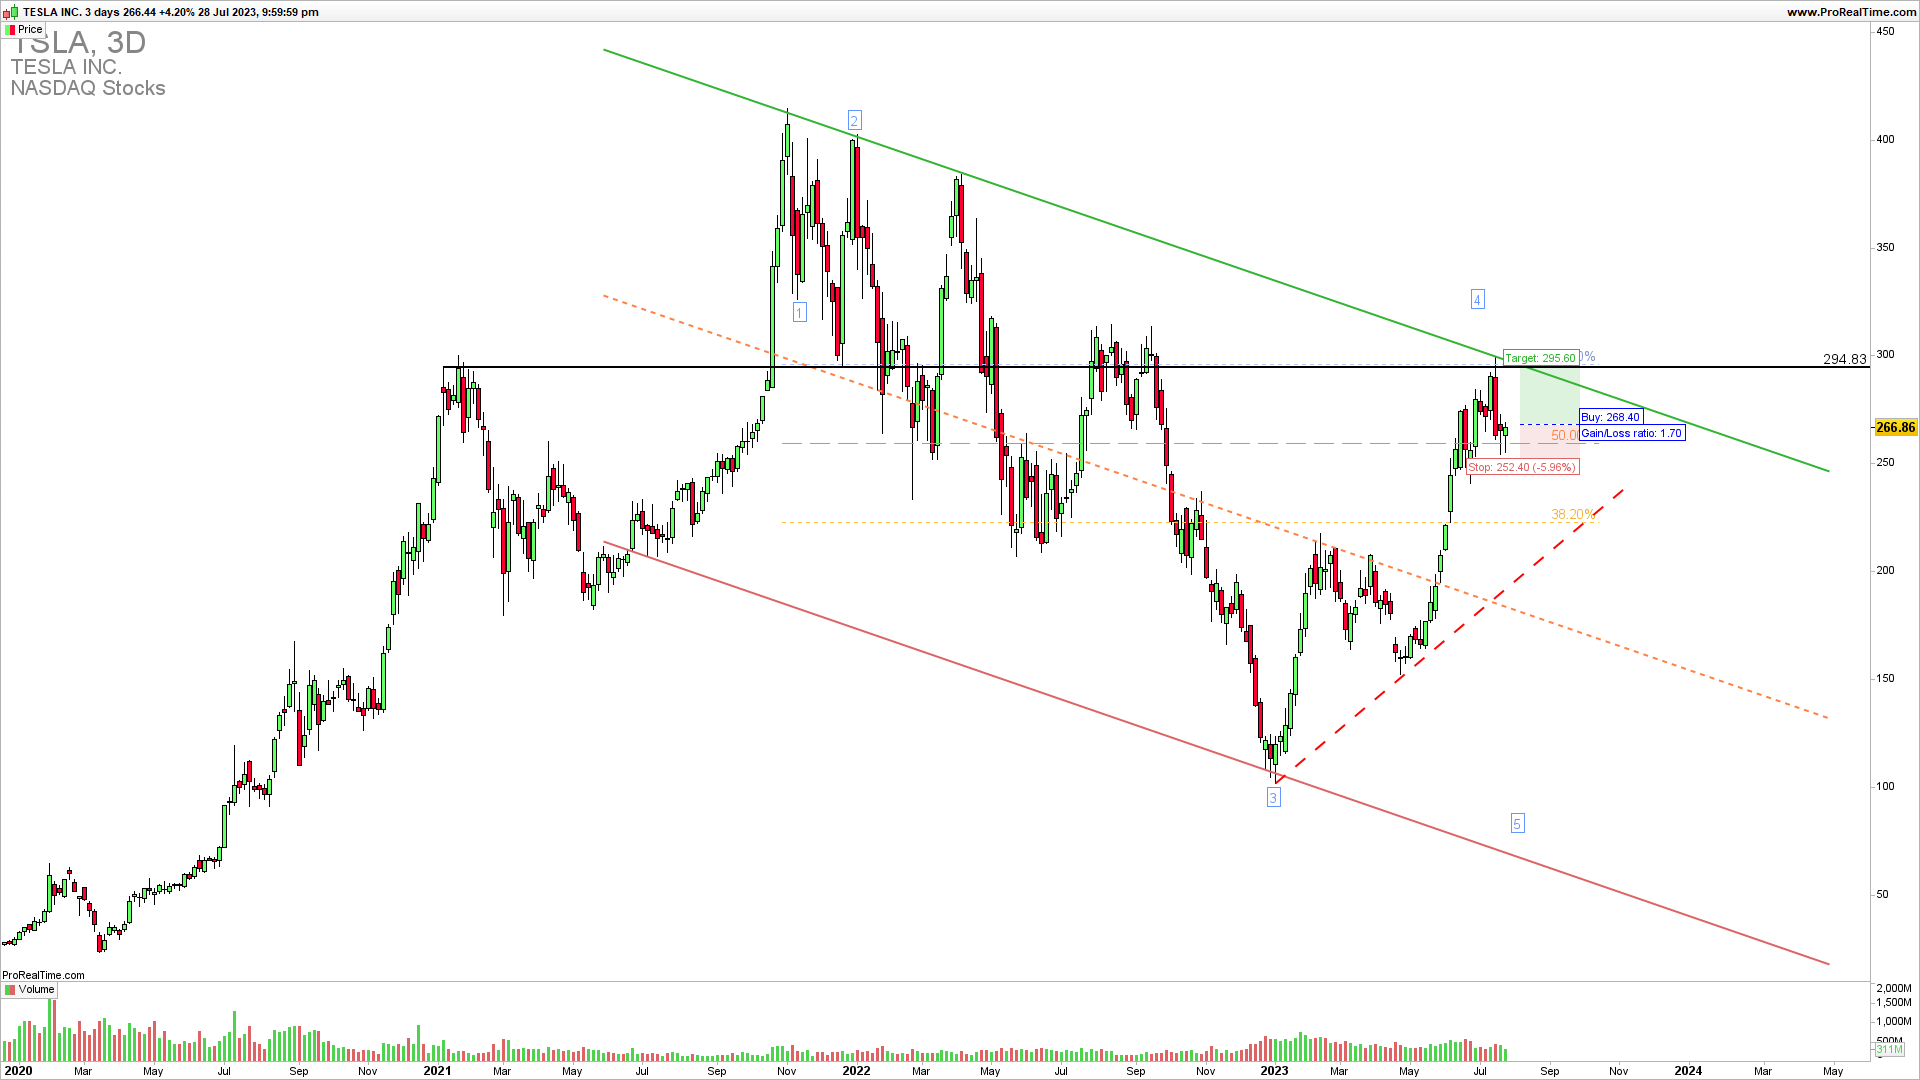
It is a fact that a strong upside resistance for Q3 is 294 and we have seen a rejection from it. If we get a confirmed break below 254 we could see an extension lower to key medium-term to long-term support 225. A break below this level would mean a complete turnaround. Near-term long-trade entries have a lower probability of success until we see a clear break above the resistance 294. There is a possibility of long trade entry and short trade here. We can open the long trade here with a little risk and stop the loss below 254 and the short trade if we get stopped from the long trade. Also, there is a trading strategy with options that can be combined. This is a crucial level for the market and we are now seeing a test of it. Be careful with the entries.


