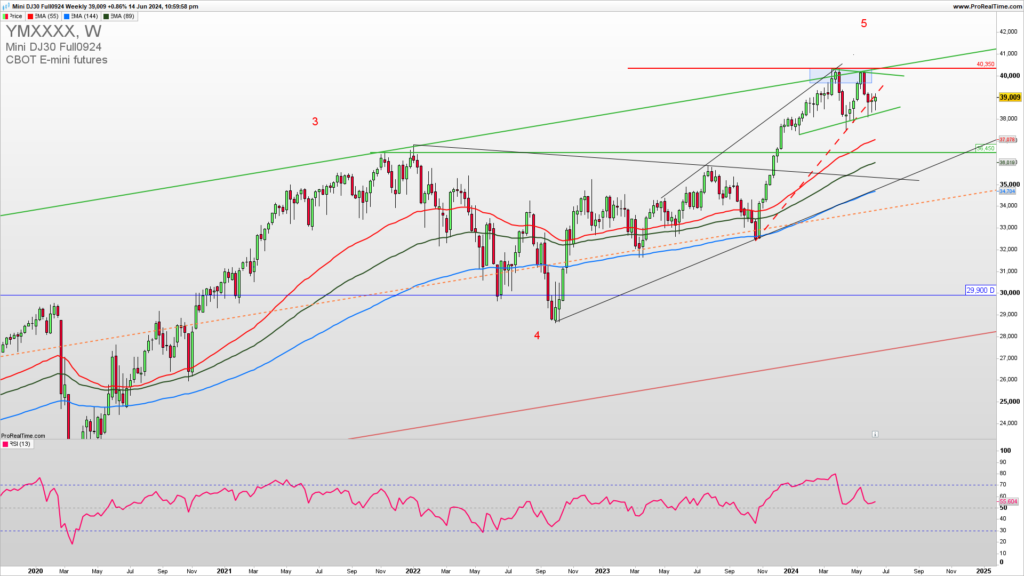
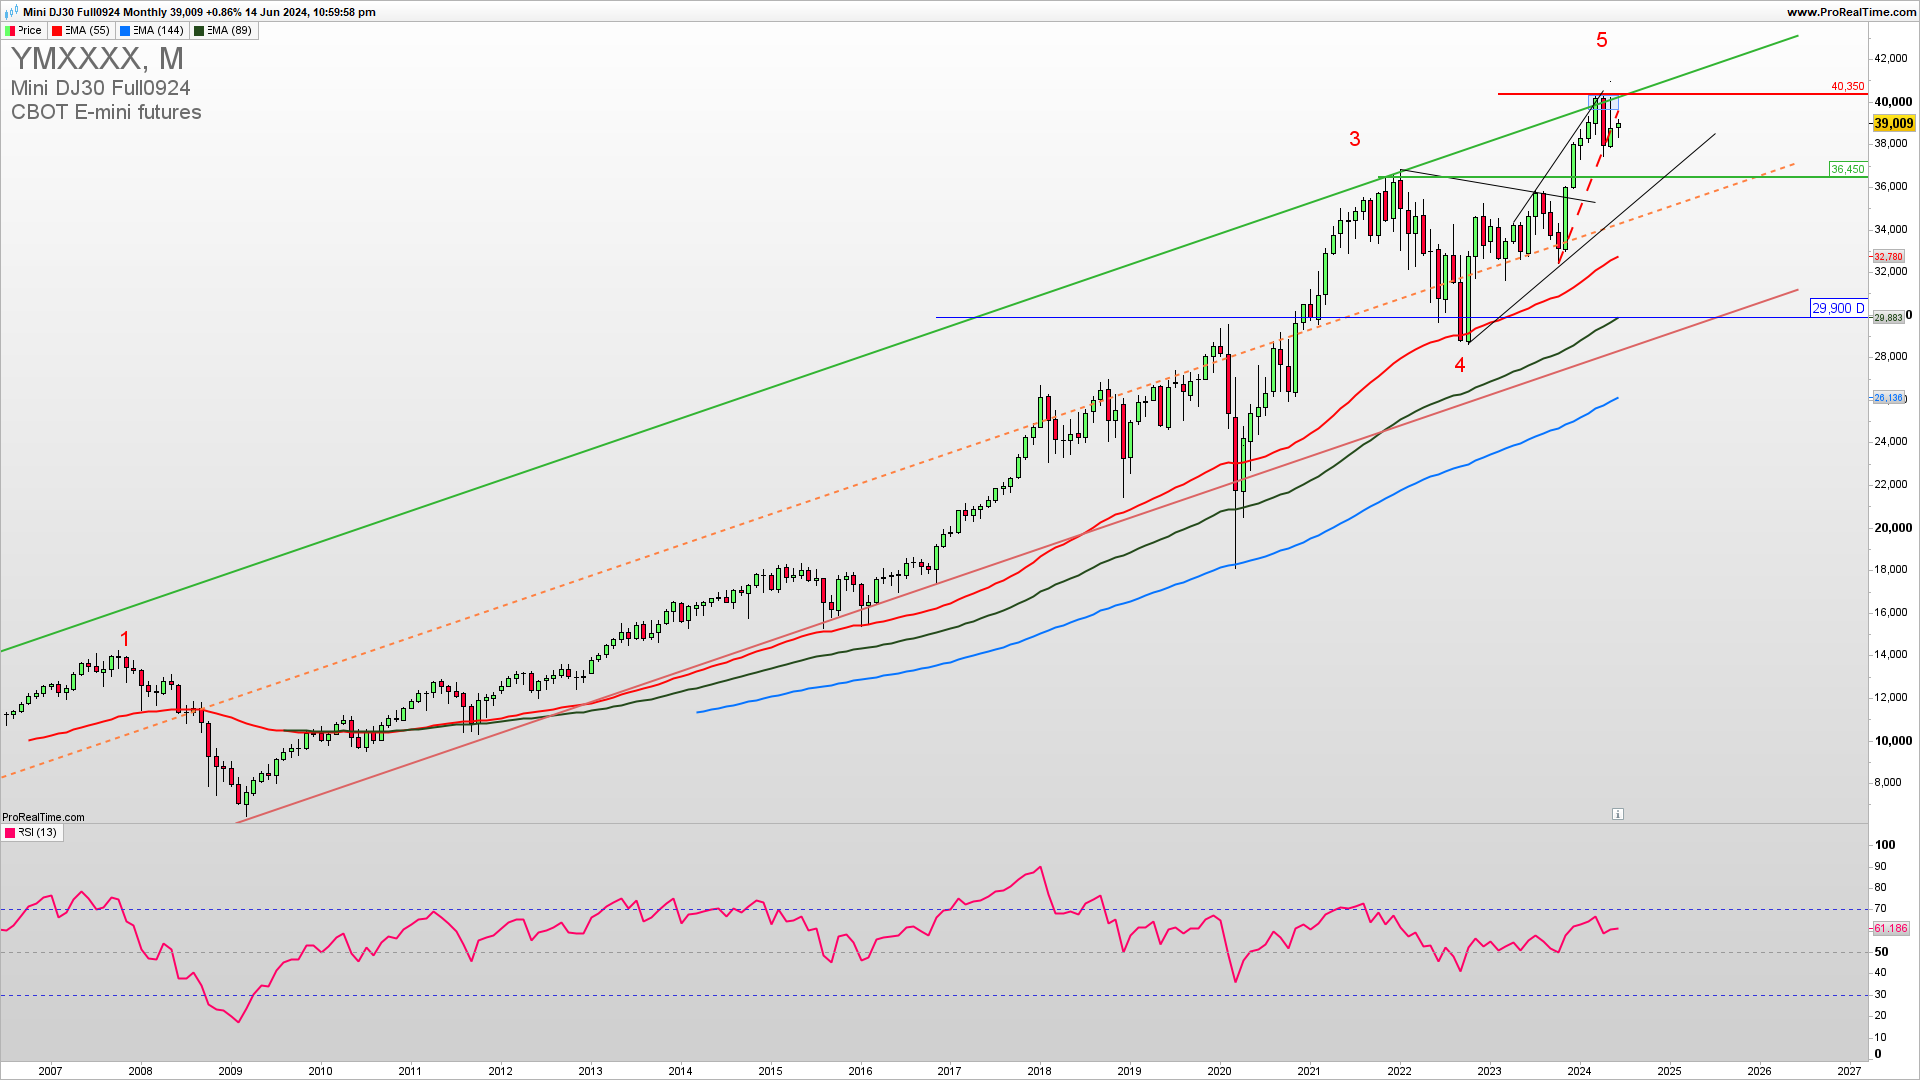
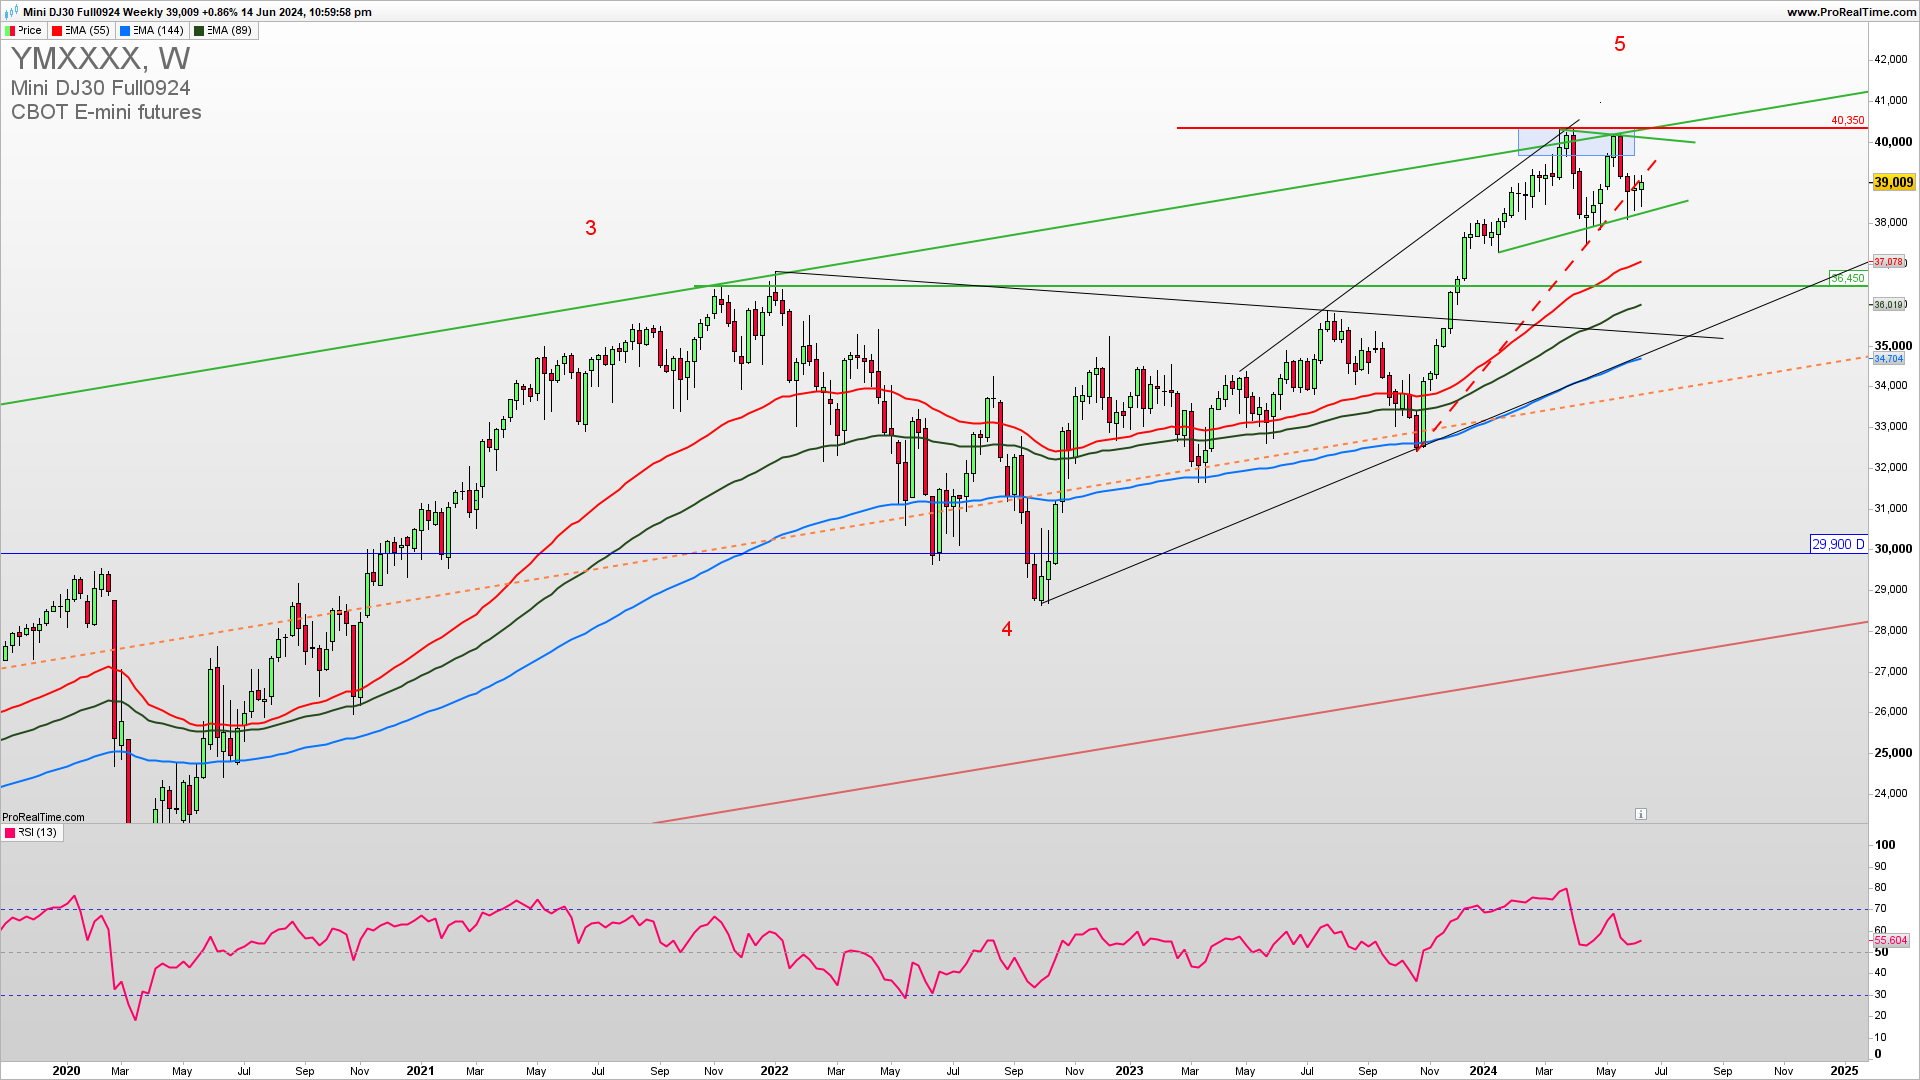
DJIA is being rejected from strong resistance 40350. This is also a long-term upside channel and it’s possibly the fifth of the five upside waves. A confirmed breakout above this level is required for a continuation higher and another extension. Learn to Trade Indices profitably.
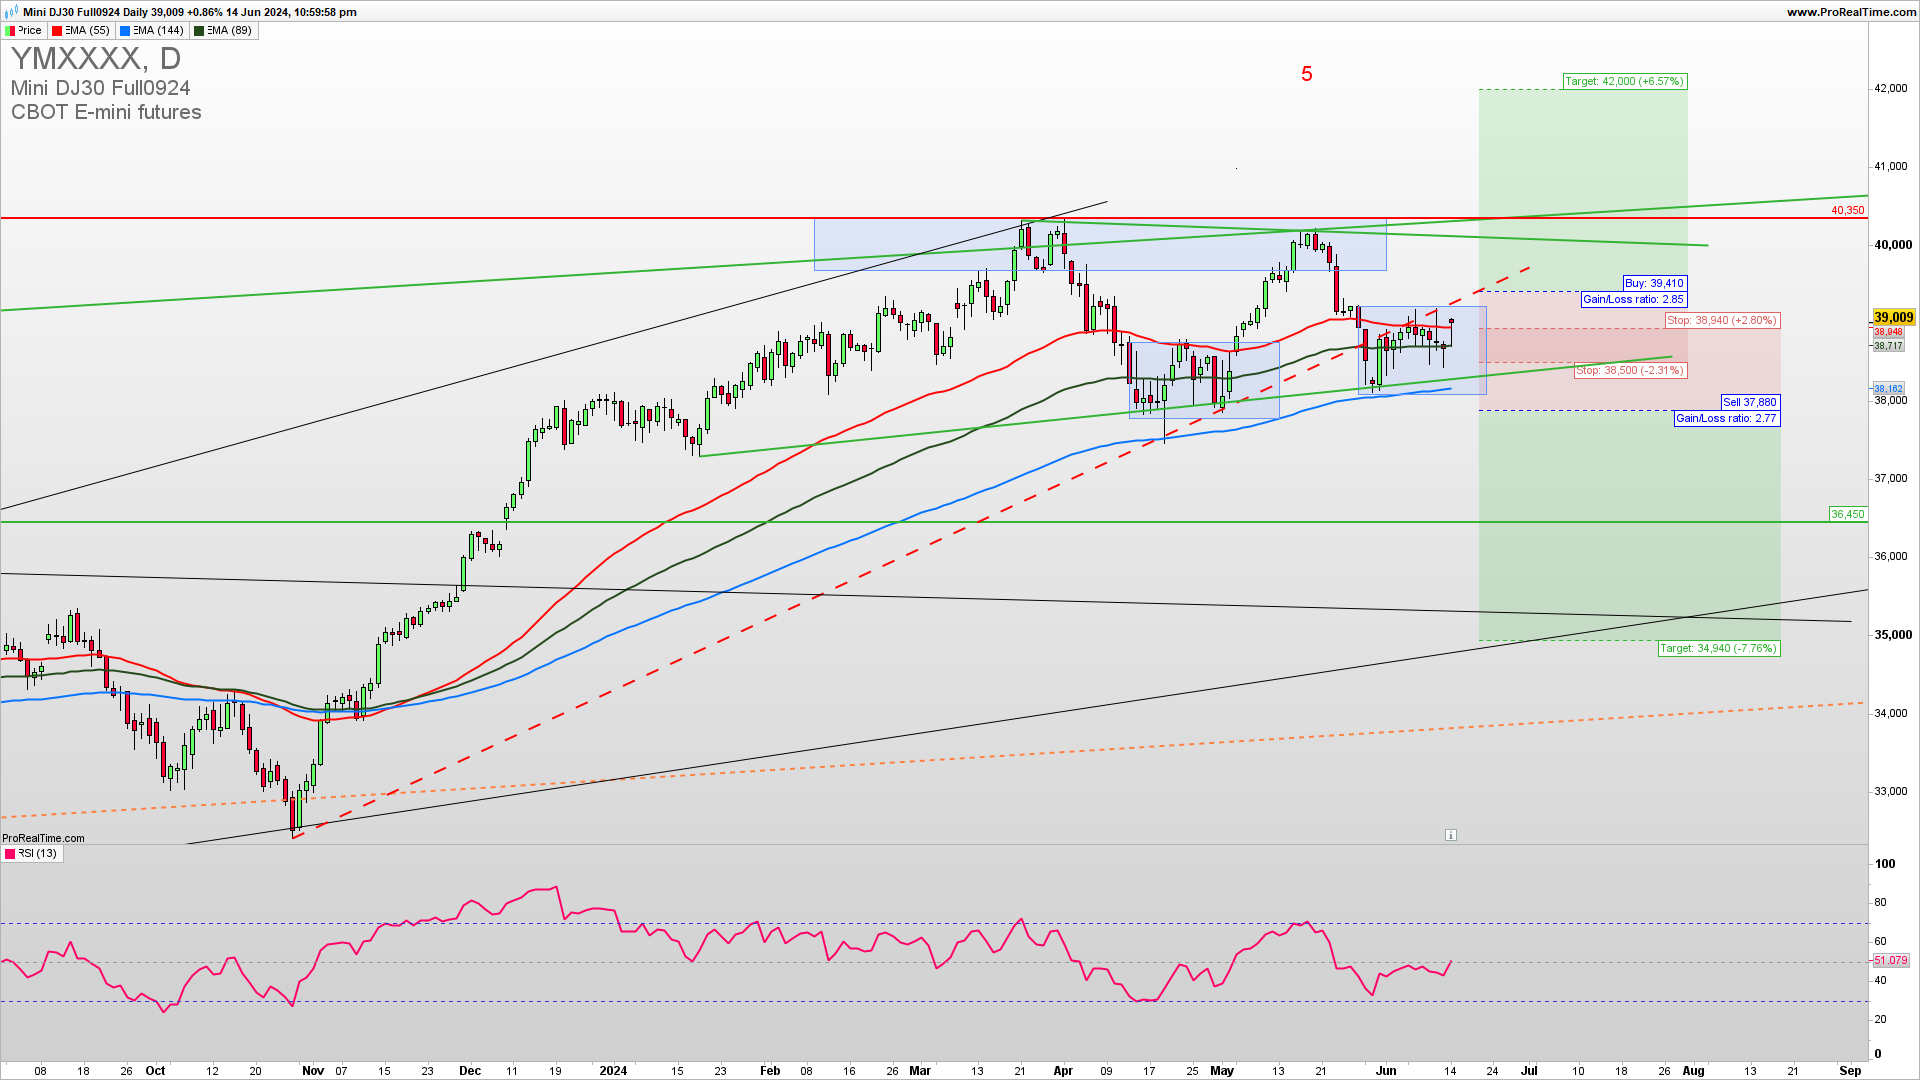
The Weekly DJIA chart reveals a consolidation triangle that could not be bearish and could be a bullish continuation triangle. At this point, both sell and buy positions are possible as the Index is still in the strong uptrend but a break below 38200 will lead to a pullback. We will need to see a bounce here and a break above 40000 to see an extension of the fifth long-term wave higher. Overall support for the upside stays at 35400.
GET THE CHART OF THE DAY EVERY DAY IN YOUR INBOX
As the famous trader says…
“Hope is bogus emotion that only costs you money.”
Jim Cramer
How to trade this?
It is a fact that a strong upside resistance for Q3 2024 is 40350 and If we get a confirmed break above this level we could see a strong upside continuation and new highs. Near-term, long-trade entries have a higher probability of success. Long trade entries are possible only on a confirmed price-action break above 39300 with a narrow stop loss. The short-trade entry can be tried in the case of a break below 37900. For inquiries about account management please write to [email protected].


