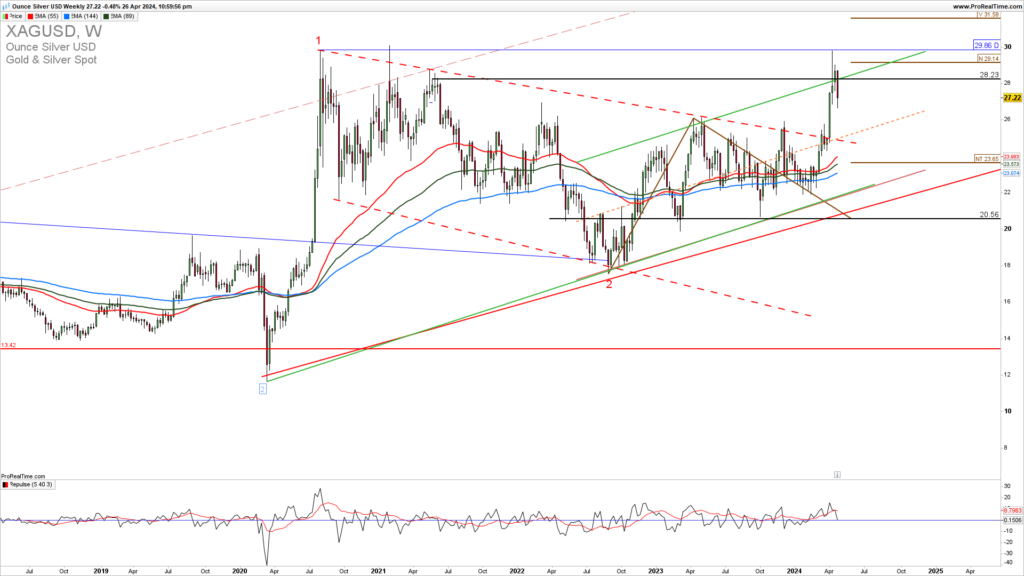
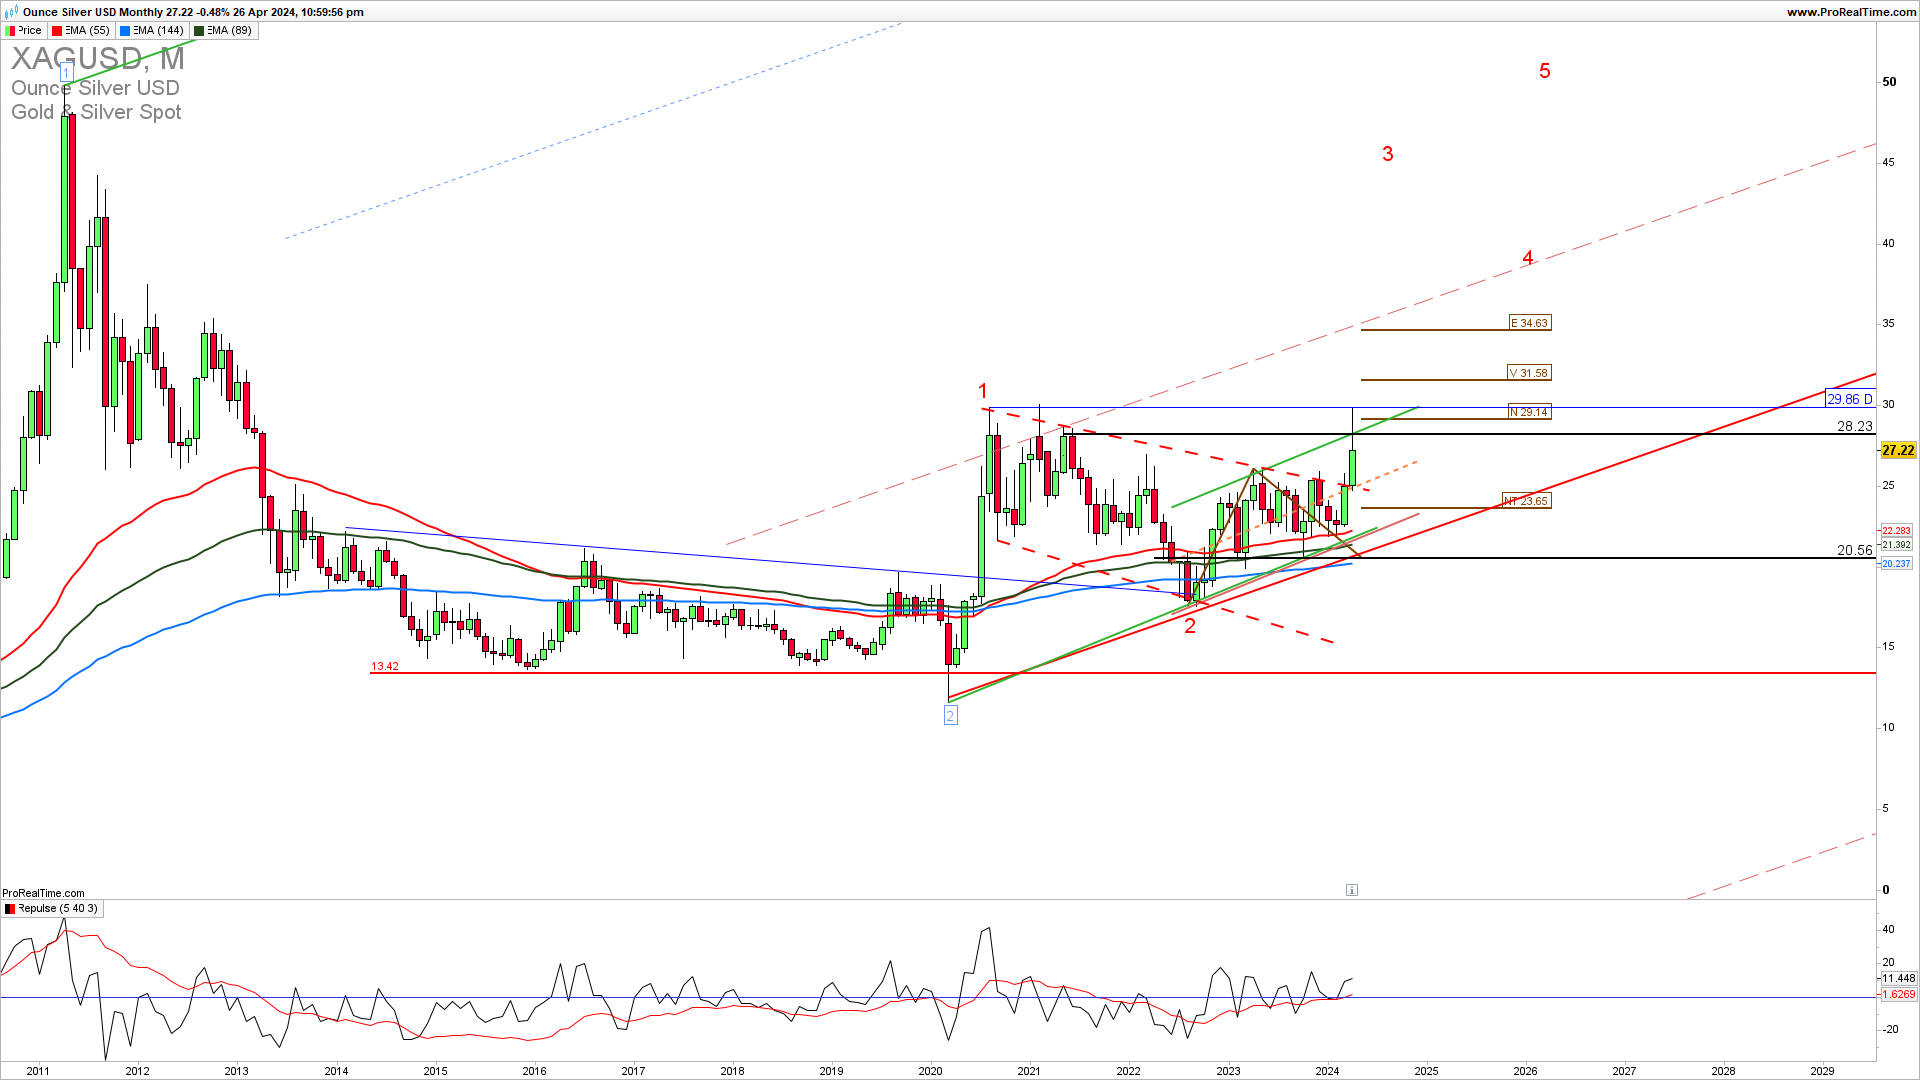
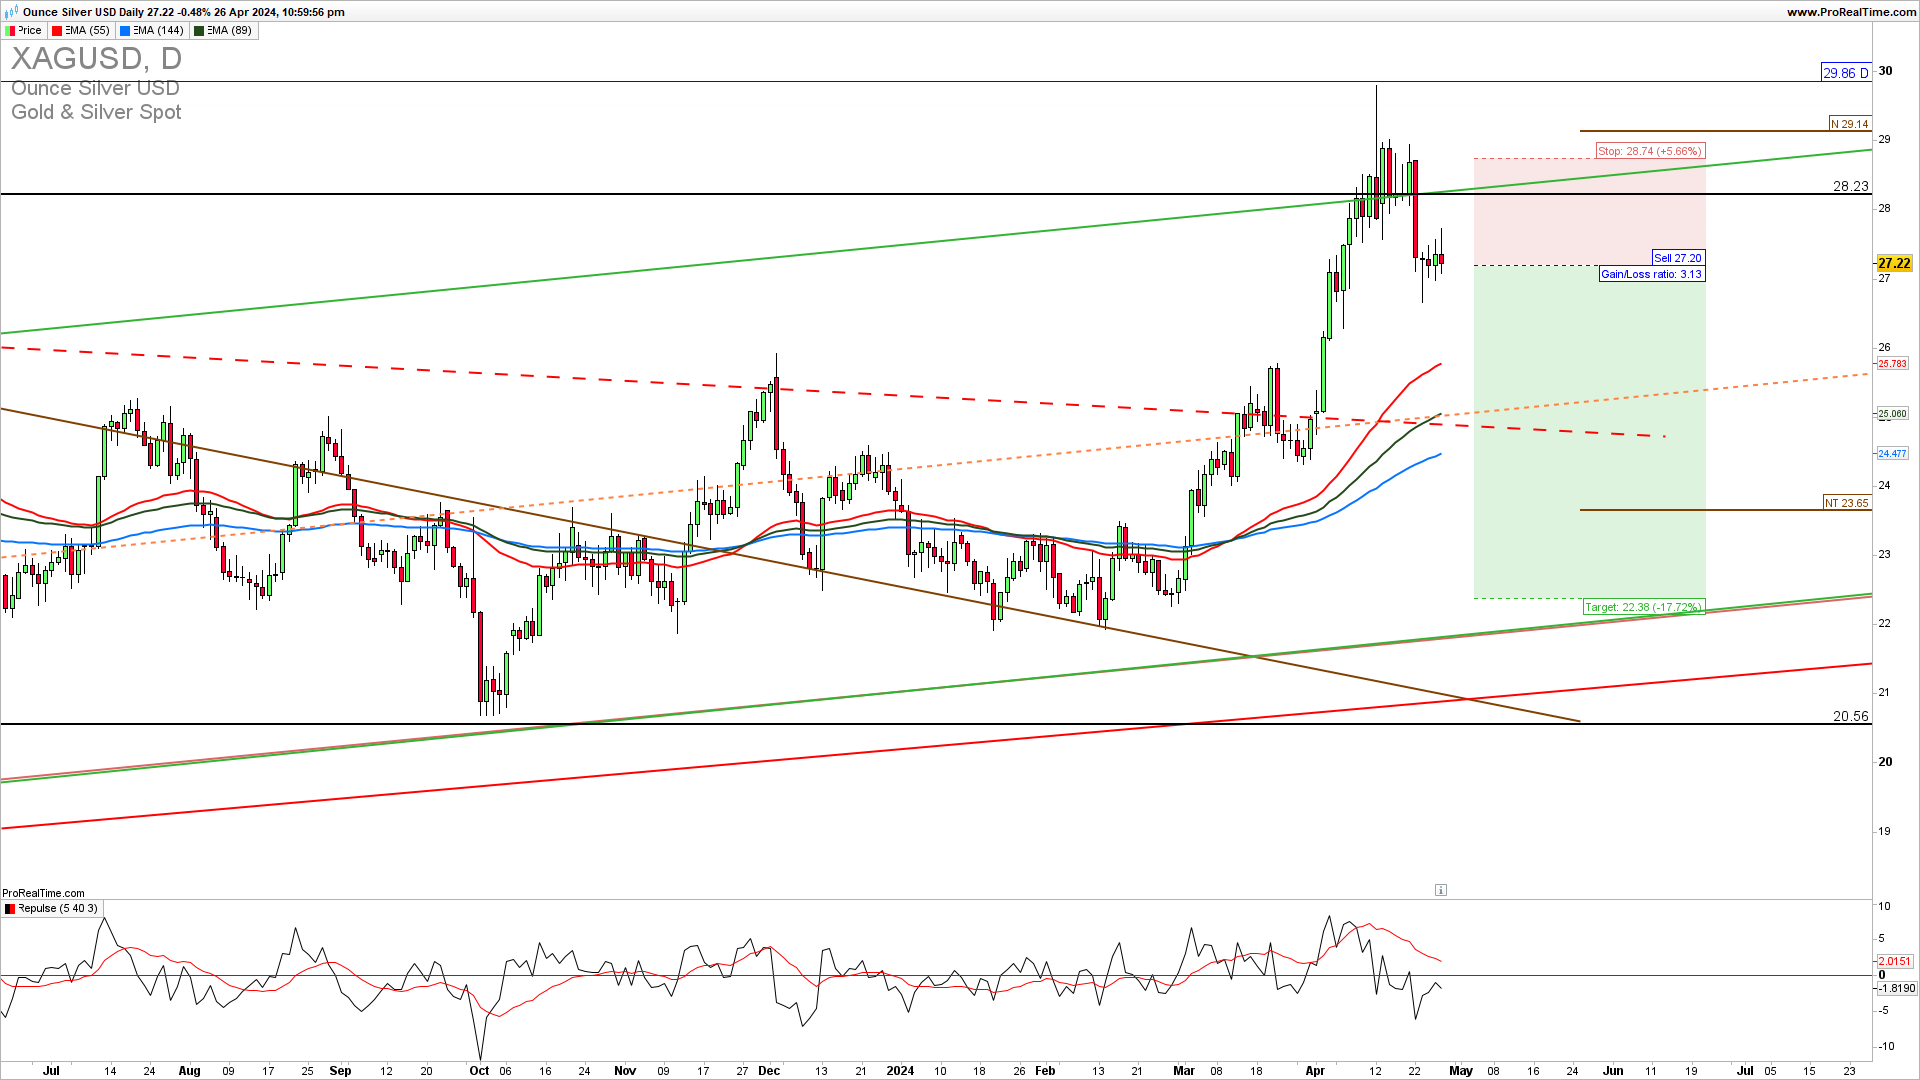
XAGUSD is being rejected by the short-term channel top 30 level and this is now the main resistance for a sharp continuation higher in the long-term third upside wave. We are seeing now a pullback correction to possibly 22. A confirmed break above 30 is now required for the extension higher. As long as XAGUSD is below 30 we could see a pullback to 22. Learn to Trade commodities profitably.
How to trade this?
It is a fact that a strong upside resistance for Q2 2024 is 30 and If we get a confirmed break here we could see a strong upside continuation and new highs. Near-term, short-trade entries have a higher probability of success. Long trade entries are possible only on a confirmed price-action break above 28.60. You can try a short trade here with a stop loss above 28.60. The short-trade entry has a better Risk to reward. For inquiries about account management please write to [email protected].
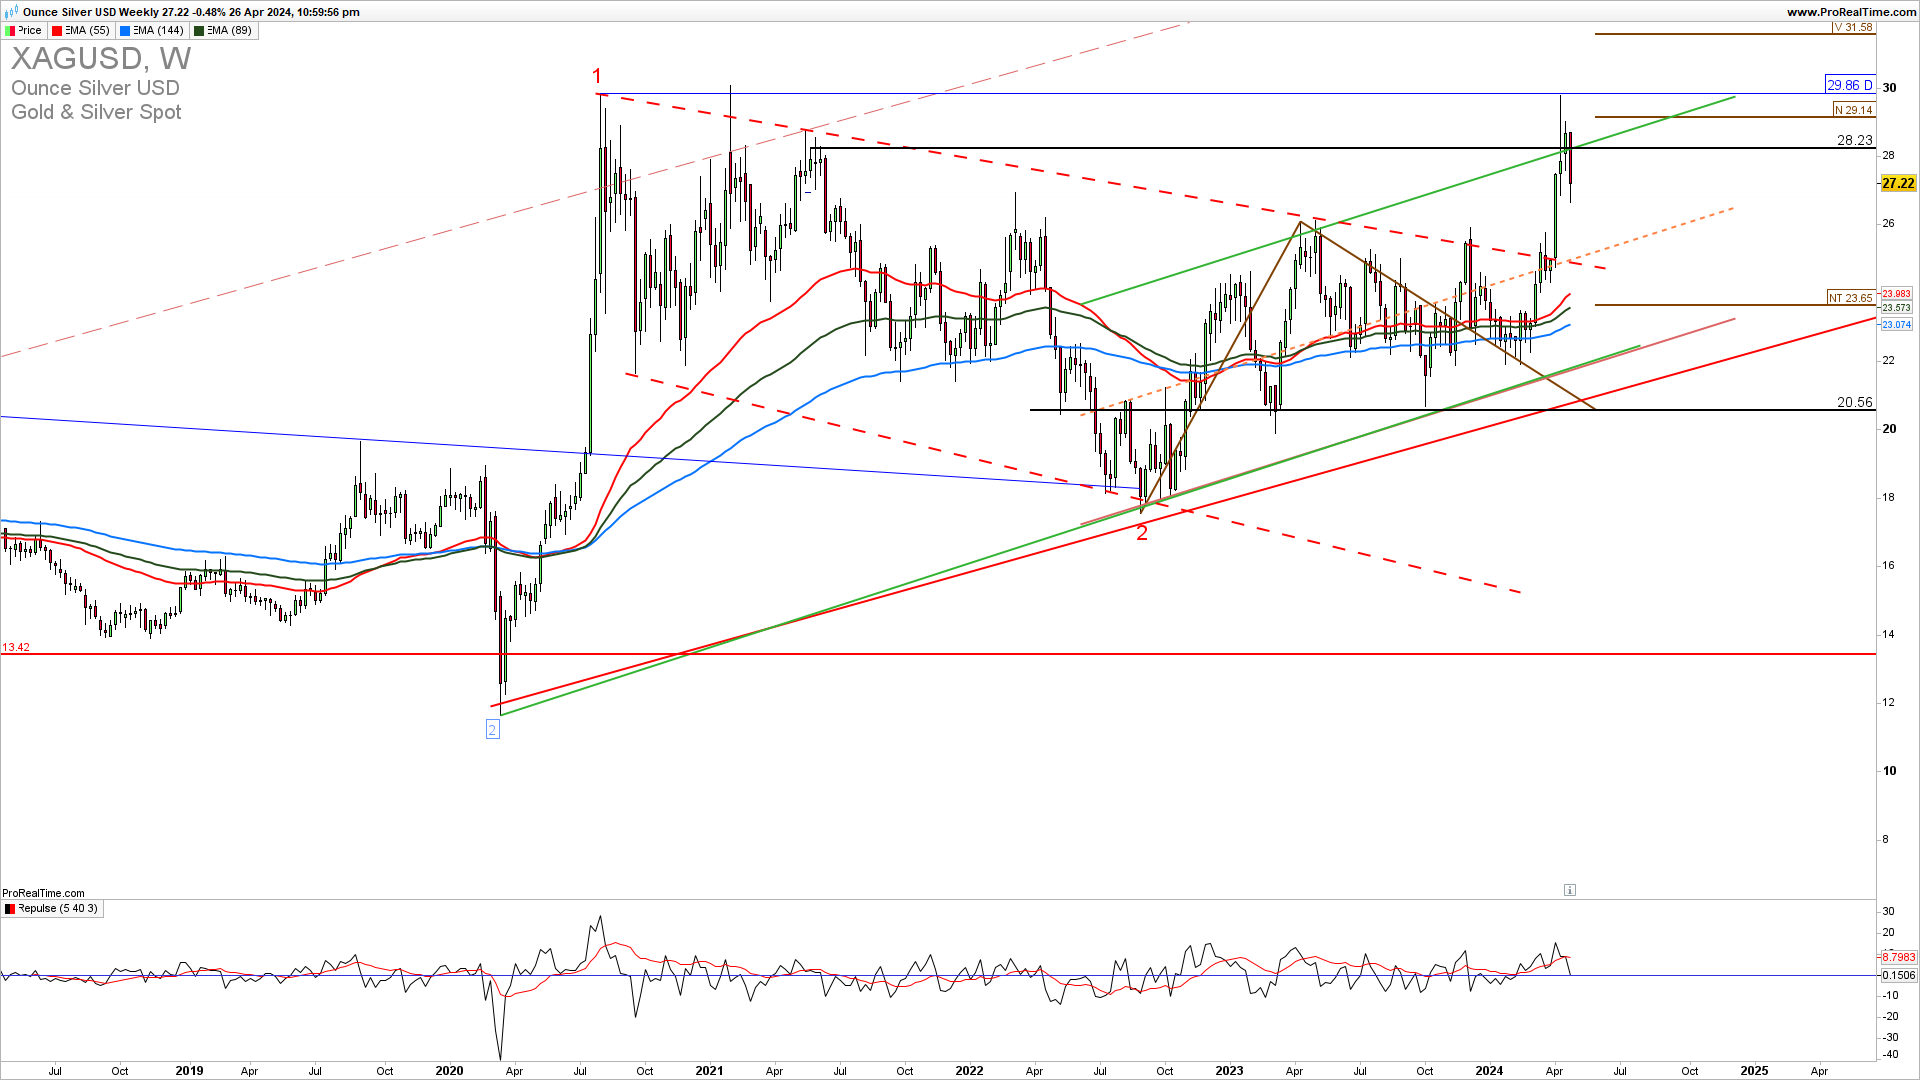
The Weekly XAGUSD chart reveals a sharp pullback and a dive below 28. As the long-term charts imply, at this point look for the short trade entries or sell positions building as they have a higher probability of success. We will need to see a big break above 28.60 to see an extension higher, an invalidation of the complete downside reversal, and te beginning of the third long-term wave higher.
GET THE CHART OF THE DAY EVERY DAY IN YOUR INBOX
As the famous trader says…
“Limit your size in any position so that fear does not become the prevailing instinct guiding your judgment.”Joe Vidich
How to trade this?
It is a fact that a strong upside resistance for Q2 2024 is 30 and If we get a confirmed break here we could see a strong upside continuation and new highs. Near-term, short-trade entries have a higher probability of success. Long trade entries are possible only on a confirmed price-action break above 28.60. You can try a short trade here with a stop loss above 28.60. The short-trade entry has a better Risk to reward. For inquiries about account management please write to [email protected].


