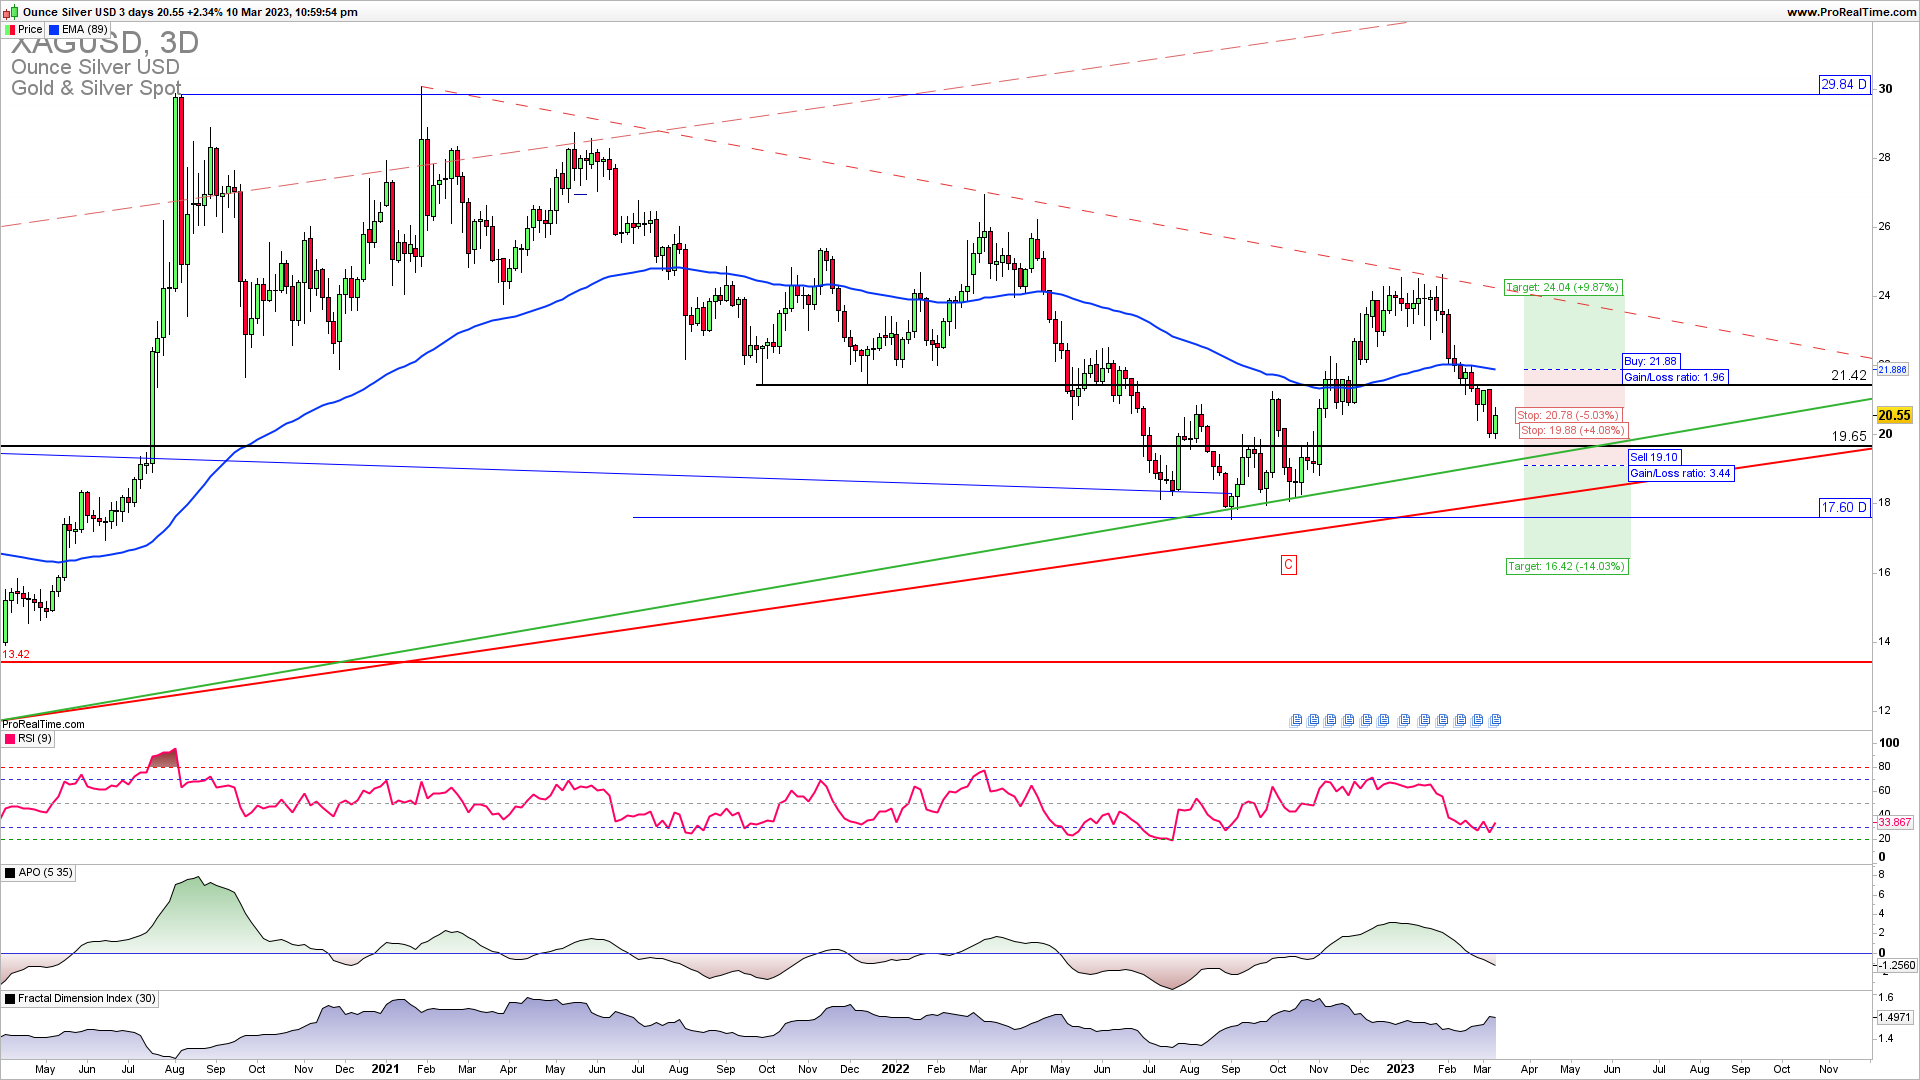
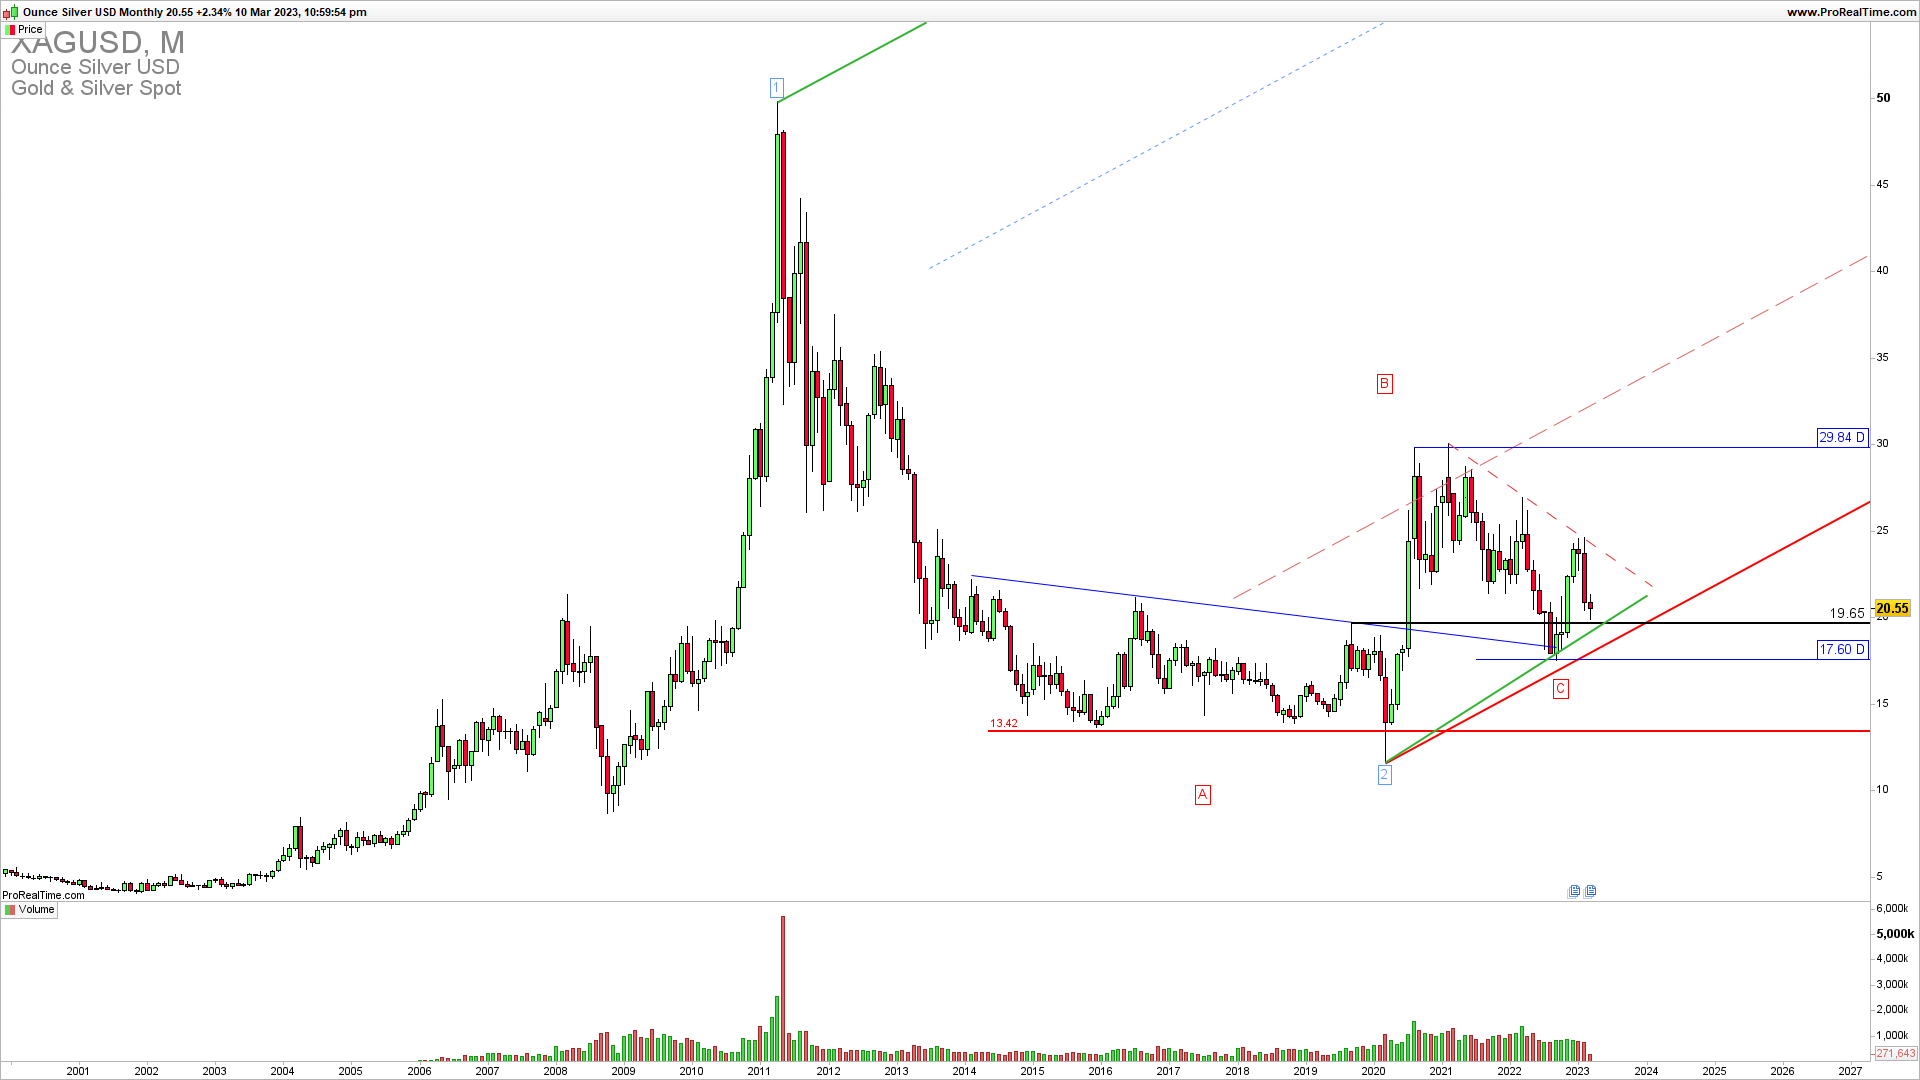
XAGUSD is reaching long-term support of 19.80. It is a previously broken horizontal resistance to the upside and an uptrend line along with long-term Pitchfork channel support. This support must hold for the upside continuation and another test of the most important Pivot 24.
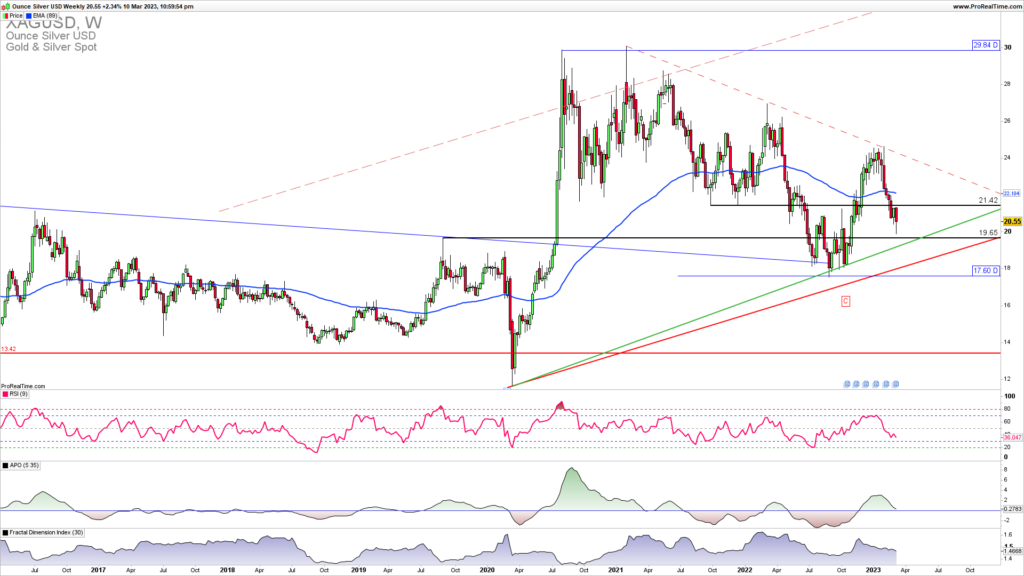
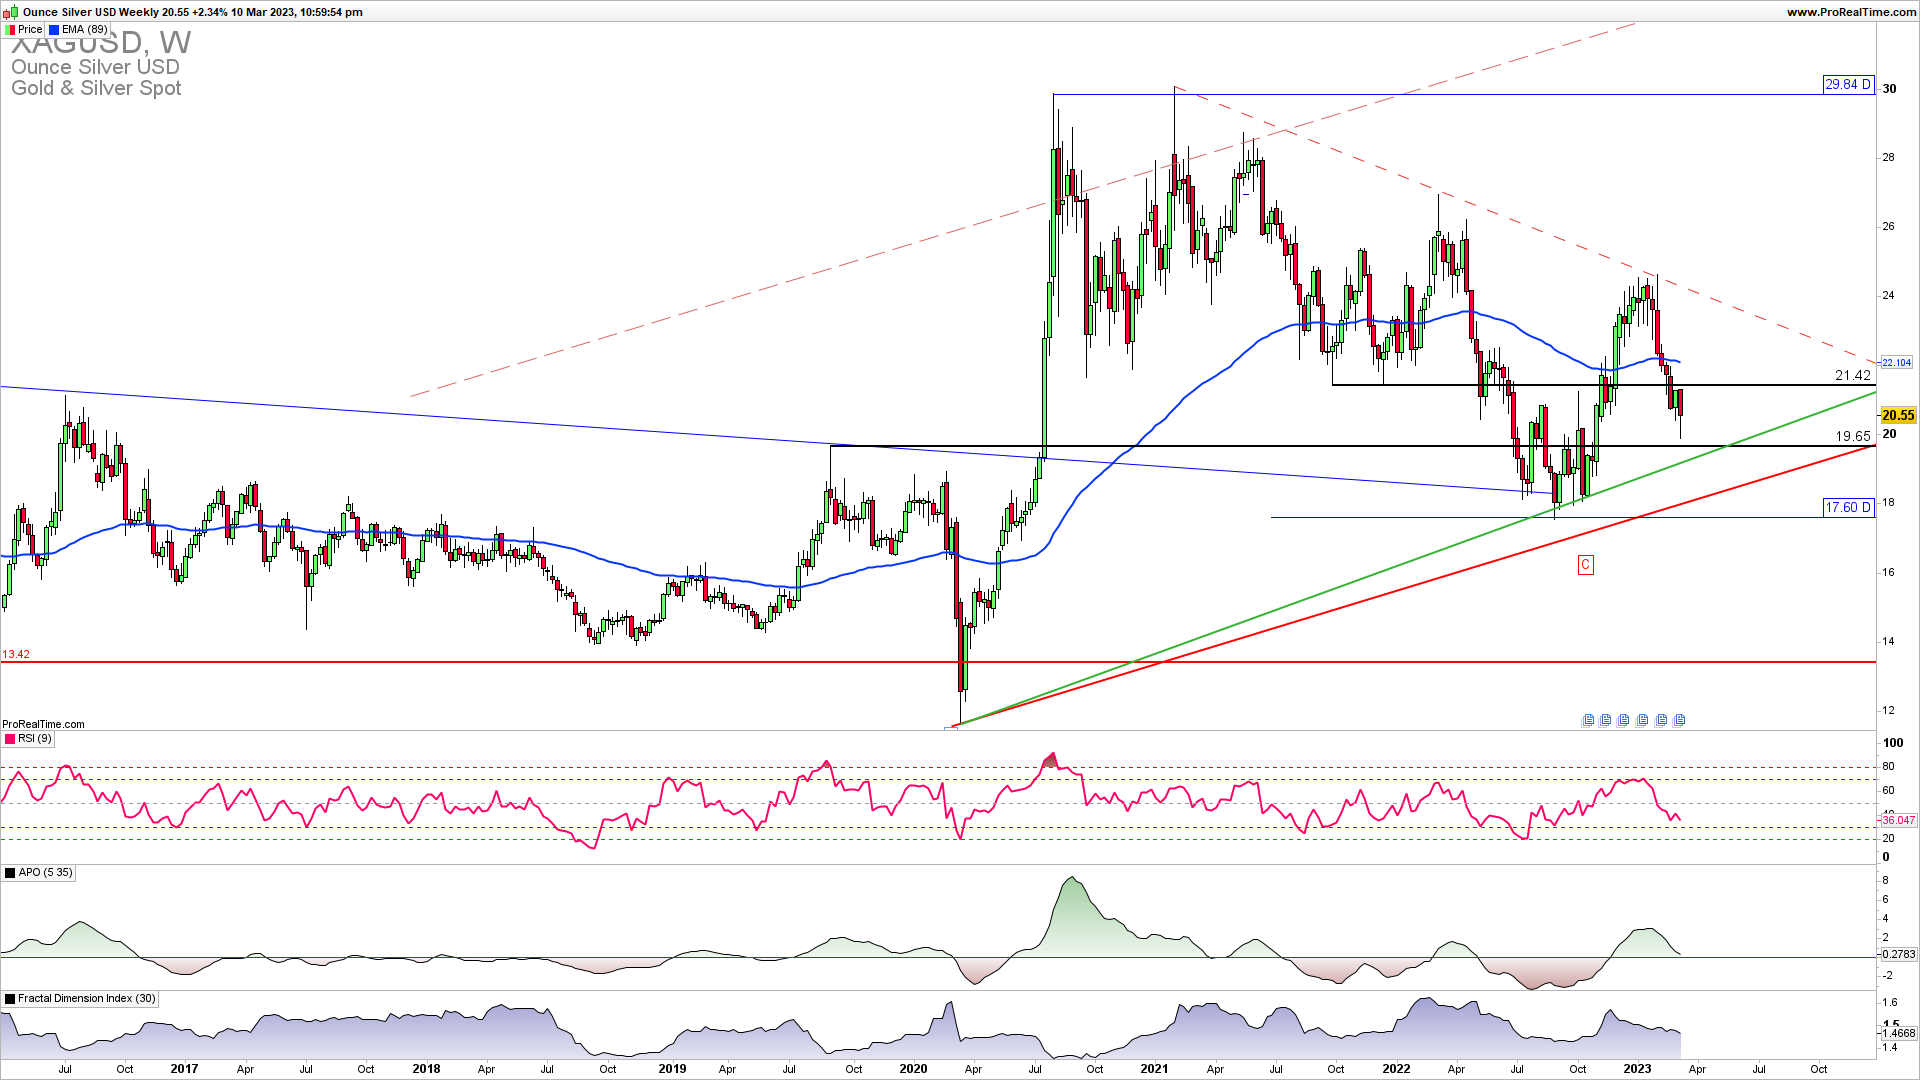
On the weekly XAGUSD chart, we see a meaningful bounce of the strong support of 19.80. As we saw from the monthly chart we need to see a support hold for the upside continuation 24. For an upside continuation, we need to see a short-term break above 21.30 in the coming weeks.
As the famous trader says…
“Trade What’s Happening… Not What You Think Is Gonna Happen”
Doug Gregory
How to trade this?
It is obvious that for Q1 2023, we have this upside resistance of 21.40 which should be broken for an upside continuation. This doe not mean that now short trade entries have some advantage over long trade entries as the overall trend is still an uptrend. You should open a long trade, in the case of a clear confirmed break above 21.40. The risk to reward on this trade is higher than 1 and the timing of the trade depends on a price action breakout above 21.40. In the case of a break below 19.10 open a short trade with the stop loss just above 19.60. This could prove a perfect long or short trade depending on a price action breakout.


