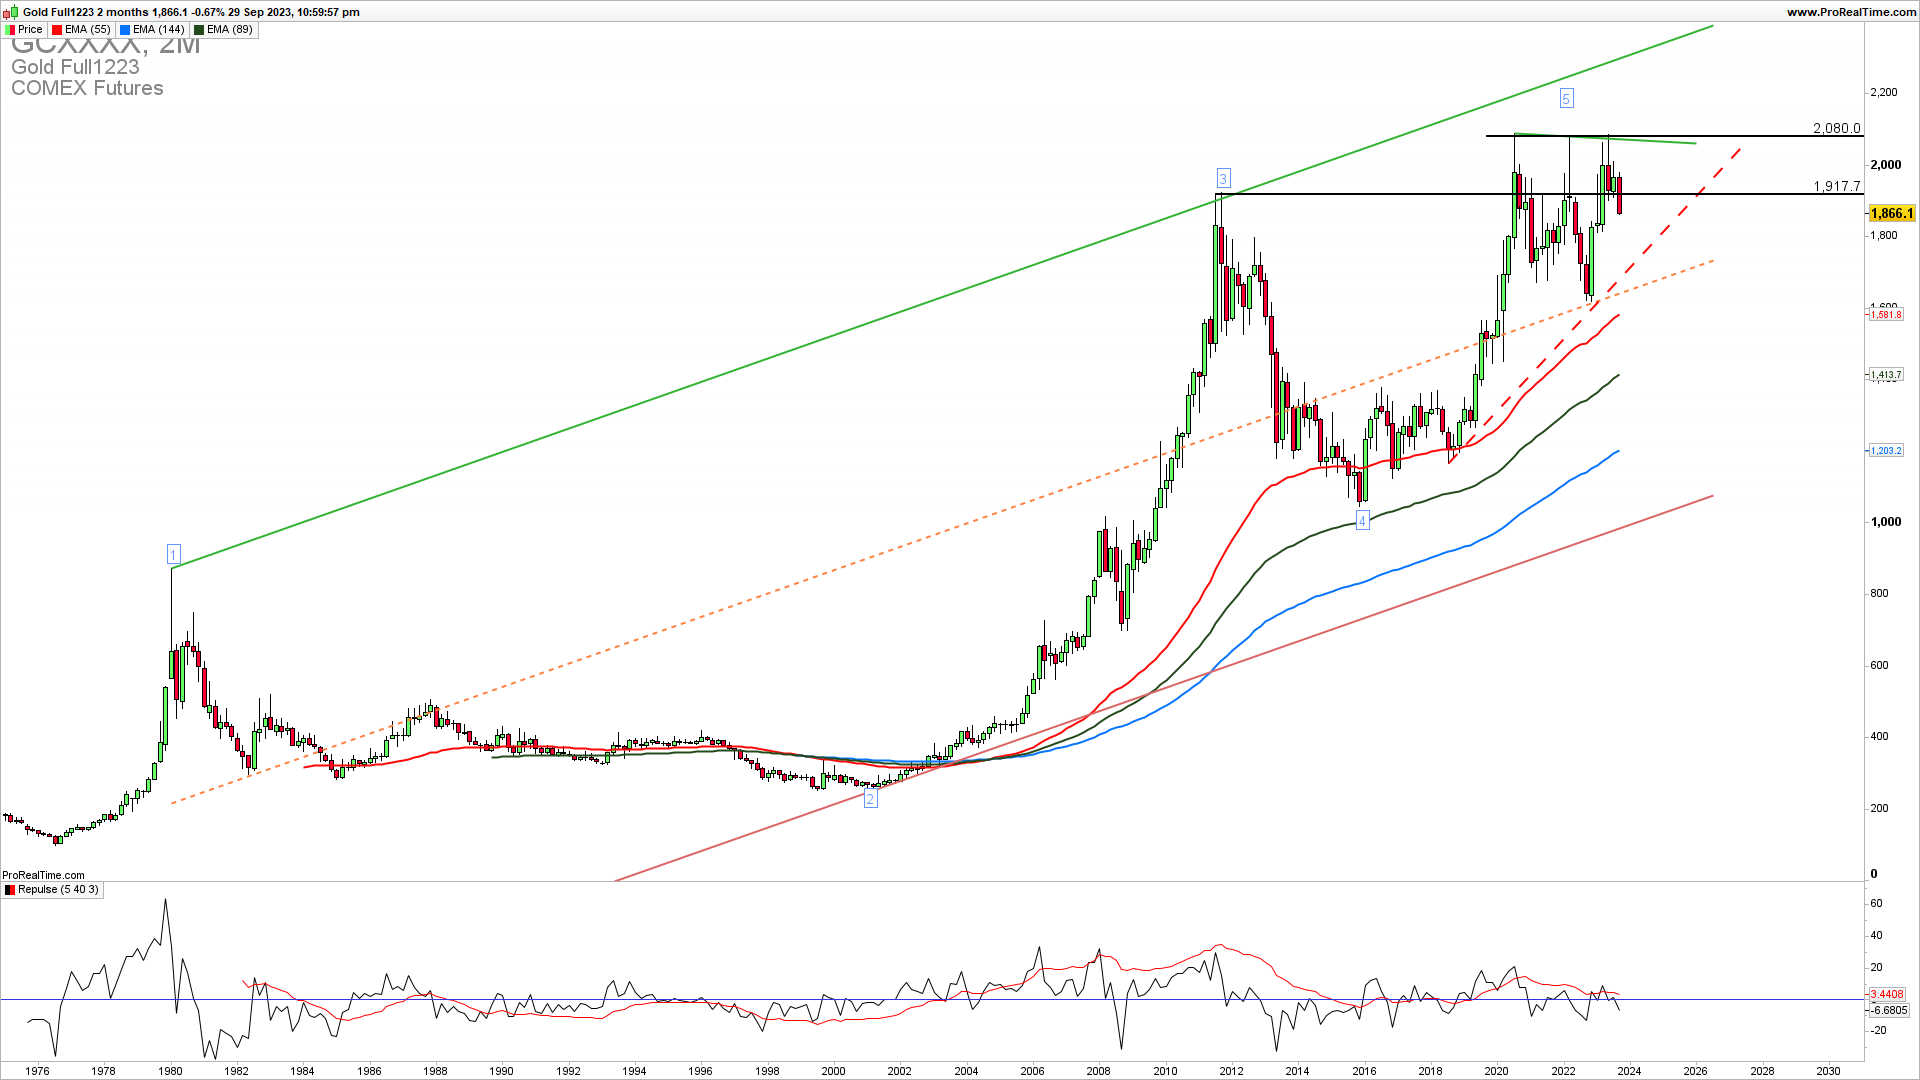
The monthly chart shows that XAUUSD is being rejected again from a familiar resistance upside of 2060 and is now pushing below the May 2011 high of 1917. On the chart, you can see a strong two-month pullback which can confirm that we have already hit the fifth upside long-term wave. We could see a test of the critical uptrend resistance of 1740 further and a break below is required to confirm that long-term five waves are over.
SPECIAL LAST SEPTEMBER OFFER MENTORING WITH PORTFOLIO OPTIMIZATION $300
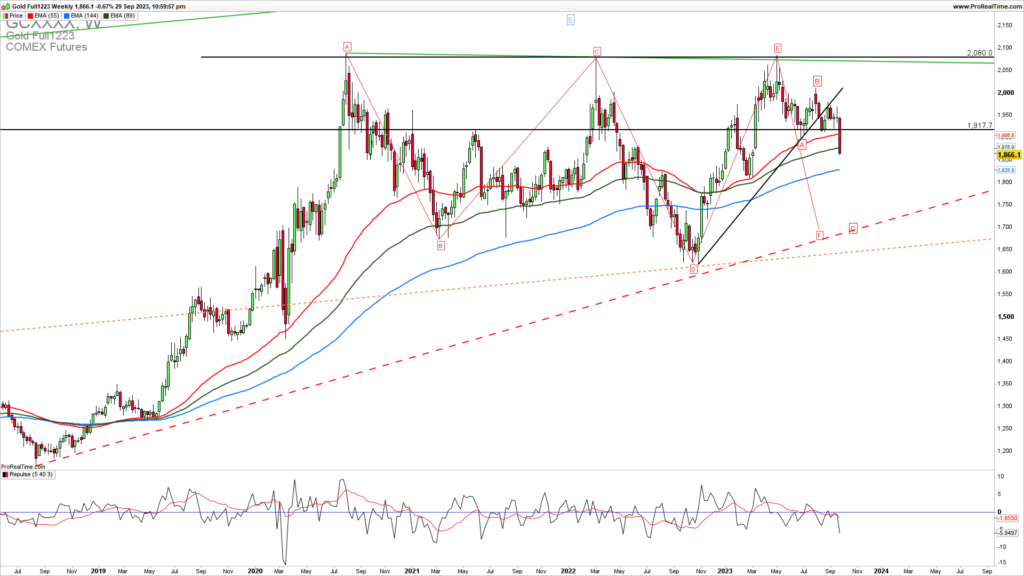
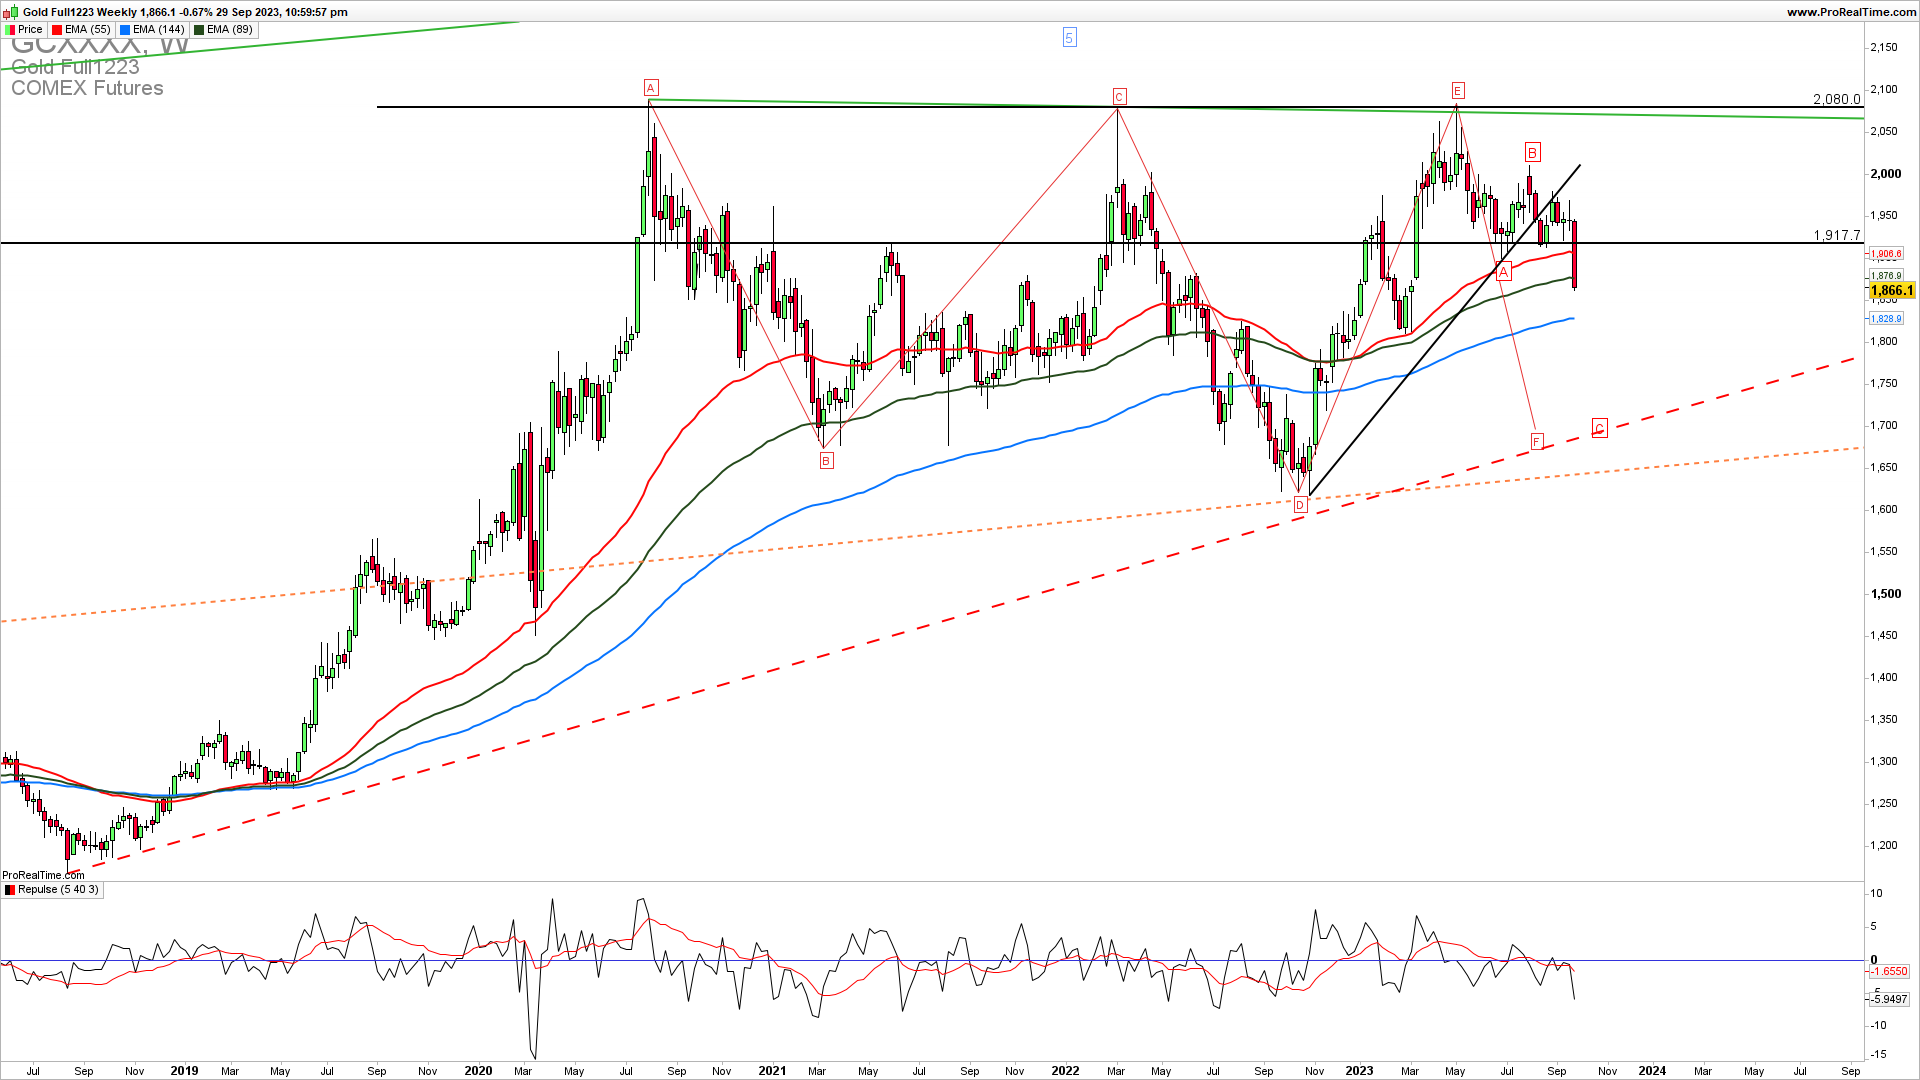
The Weekly XAUUSD chart reveals that a complex Elliott Wave consolidation in the possible wave is coming to an end with the last point F (short-term correction C) to be checked in the coming days and weeks. A break below the 1710-1740 zone will lead to a confirmation of the five waves upside-finished. There is no bullish price action at this point so we could see a bearish extension next week.
GET THE CHART OF THE DAY EVERY DAY IN YOUR INBOX
As the famous trader says…
“Limit your size in any position so that fear does not become the prevailing instinct guiding your judgment.”Joe Vidich
How to trade this?
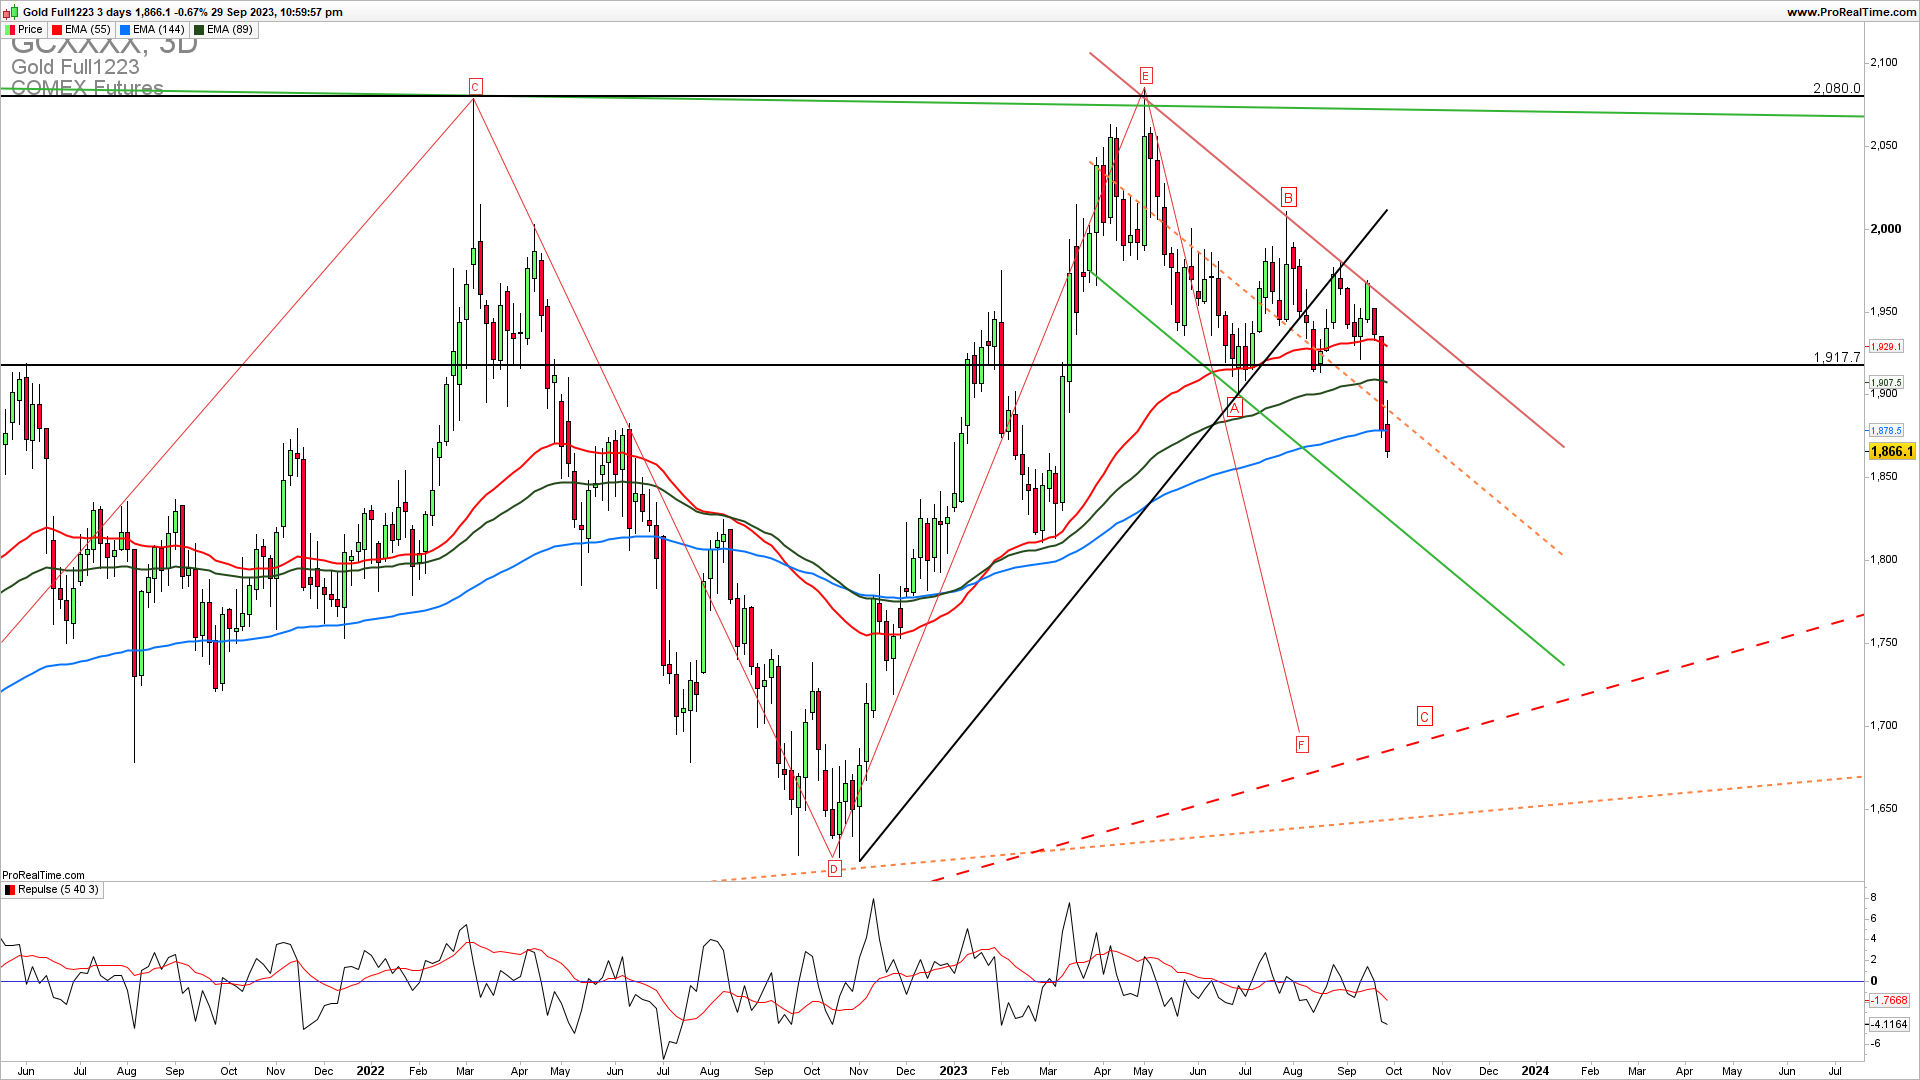
It is a fact that a strong upside support for Q3 is 1710. If we get a confirmed extension lower in the coming weeks below 1710 we could see a complete downside reversal lower. Near-term, short-trade entries have a higher probability of success. We can open the short trade here with a bit of risk and stop the loss of 1910 or we can wait for a bounce to 1900 and then enter the short trade, although a bounce probability is much lower. You can trade this price action with the options as well.


