
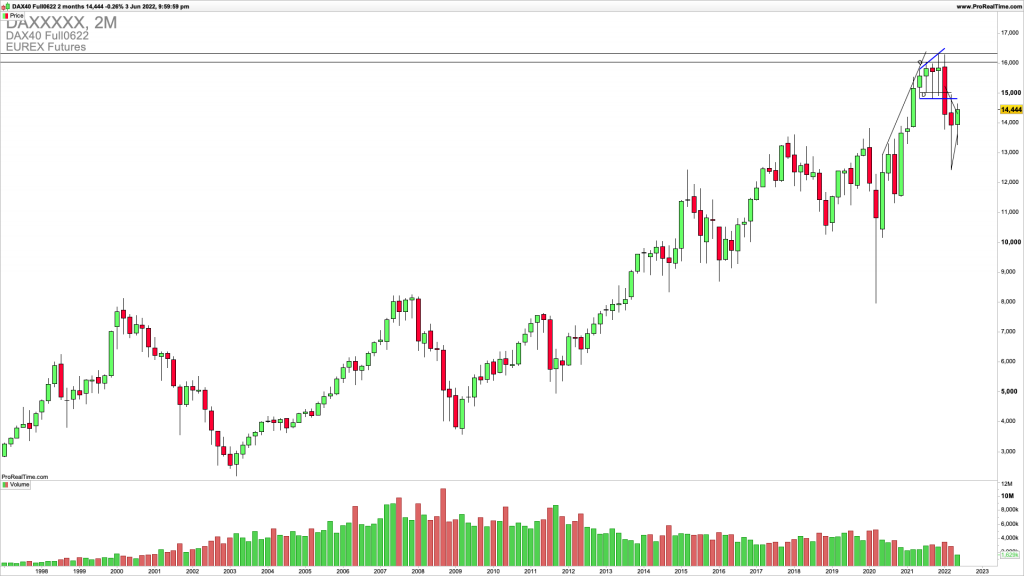
DAX is getting ready for a new swing down
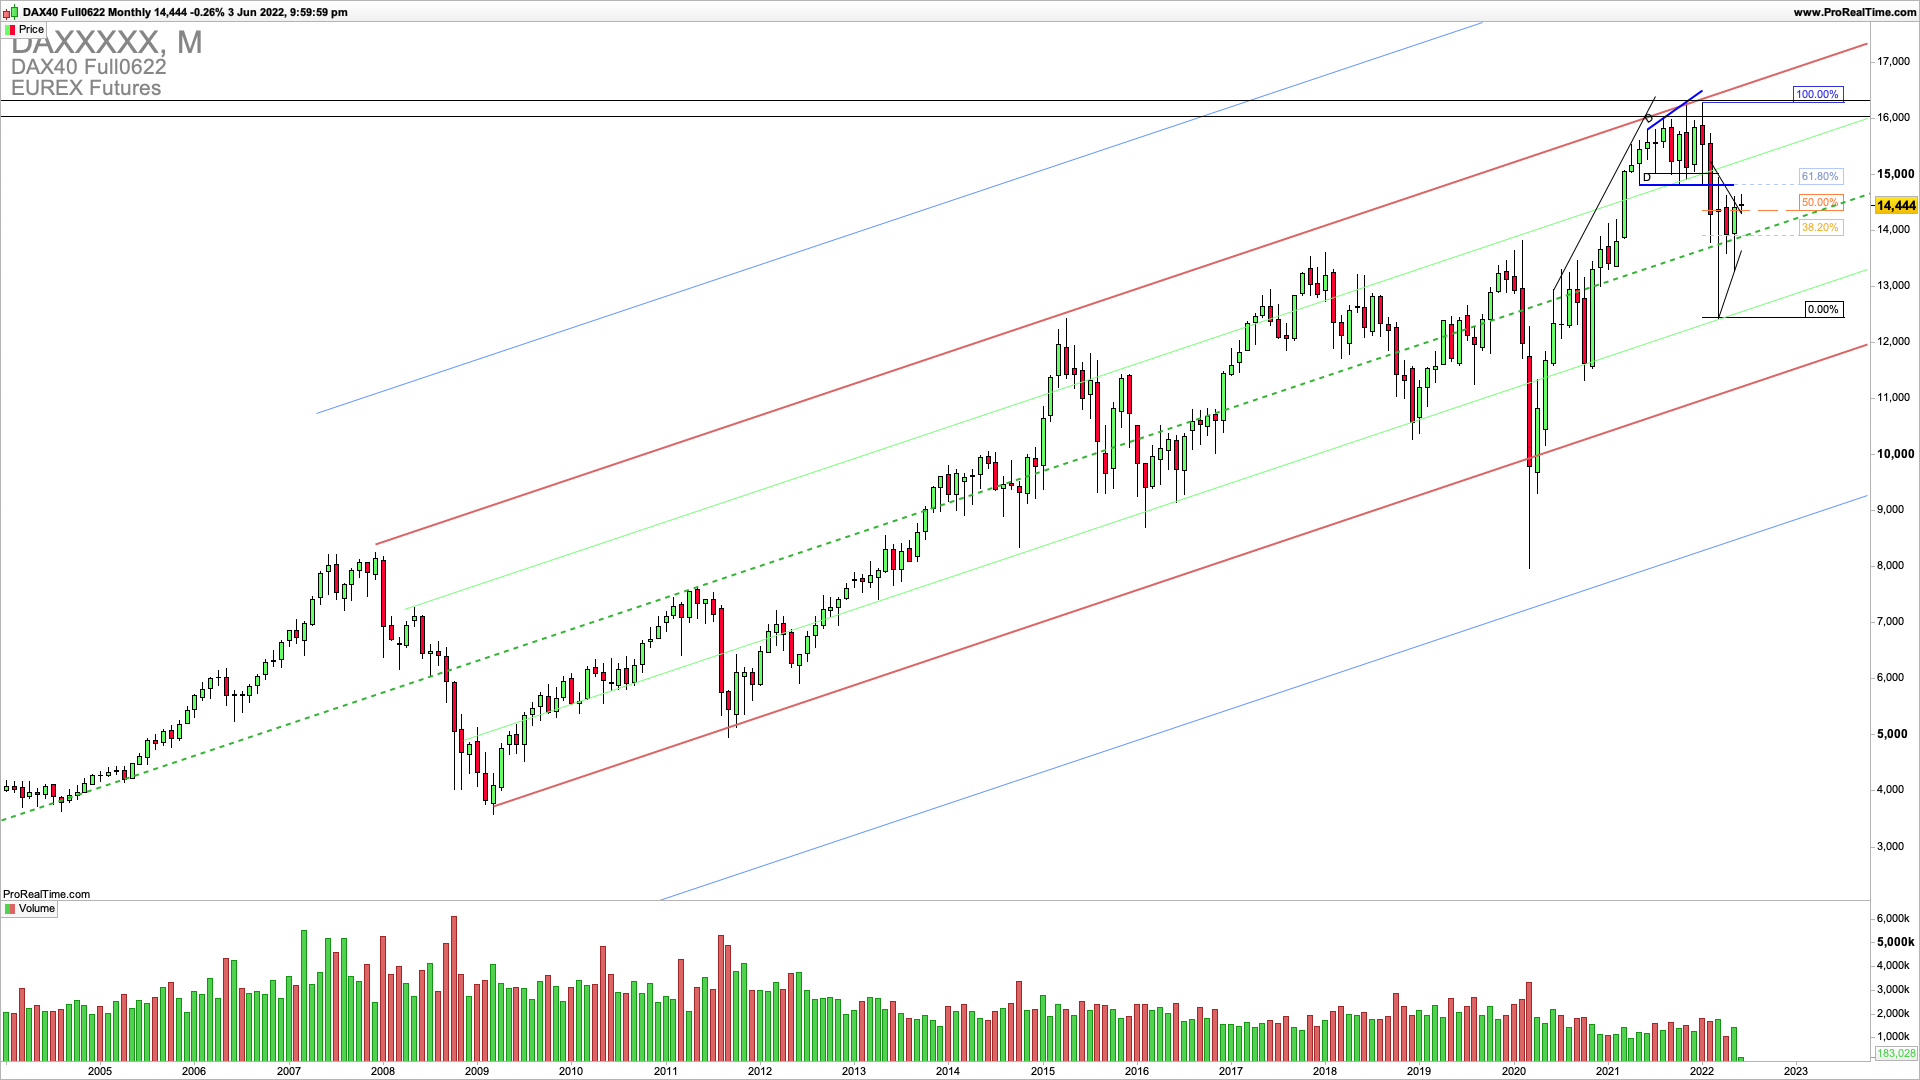
DAX is retesting the previously broken downside resistance 14500. This is also a 61.8% retrace of the last swing down. To accelerate the next swing down we need to see a clear break below 14400.
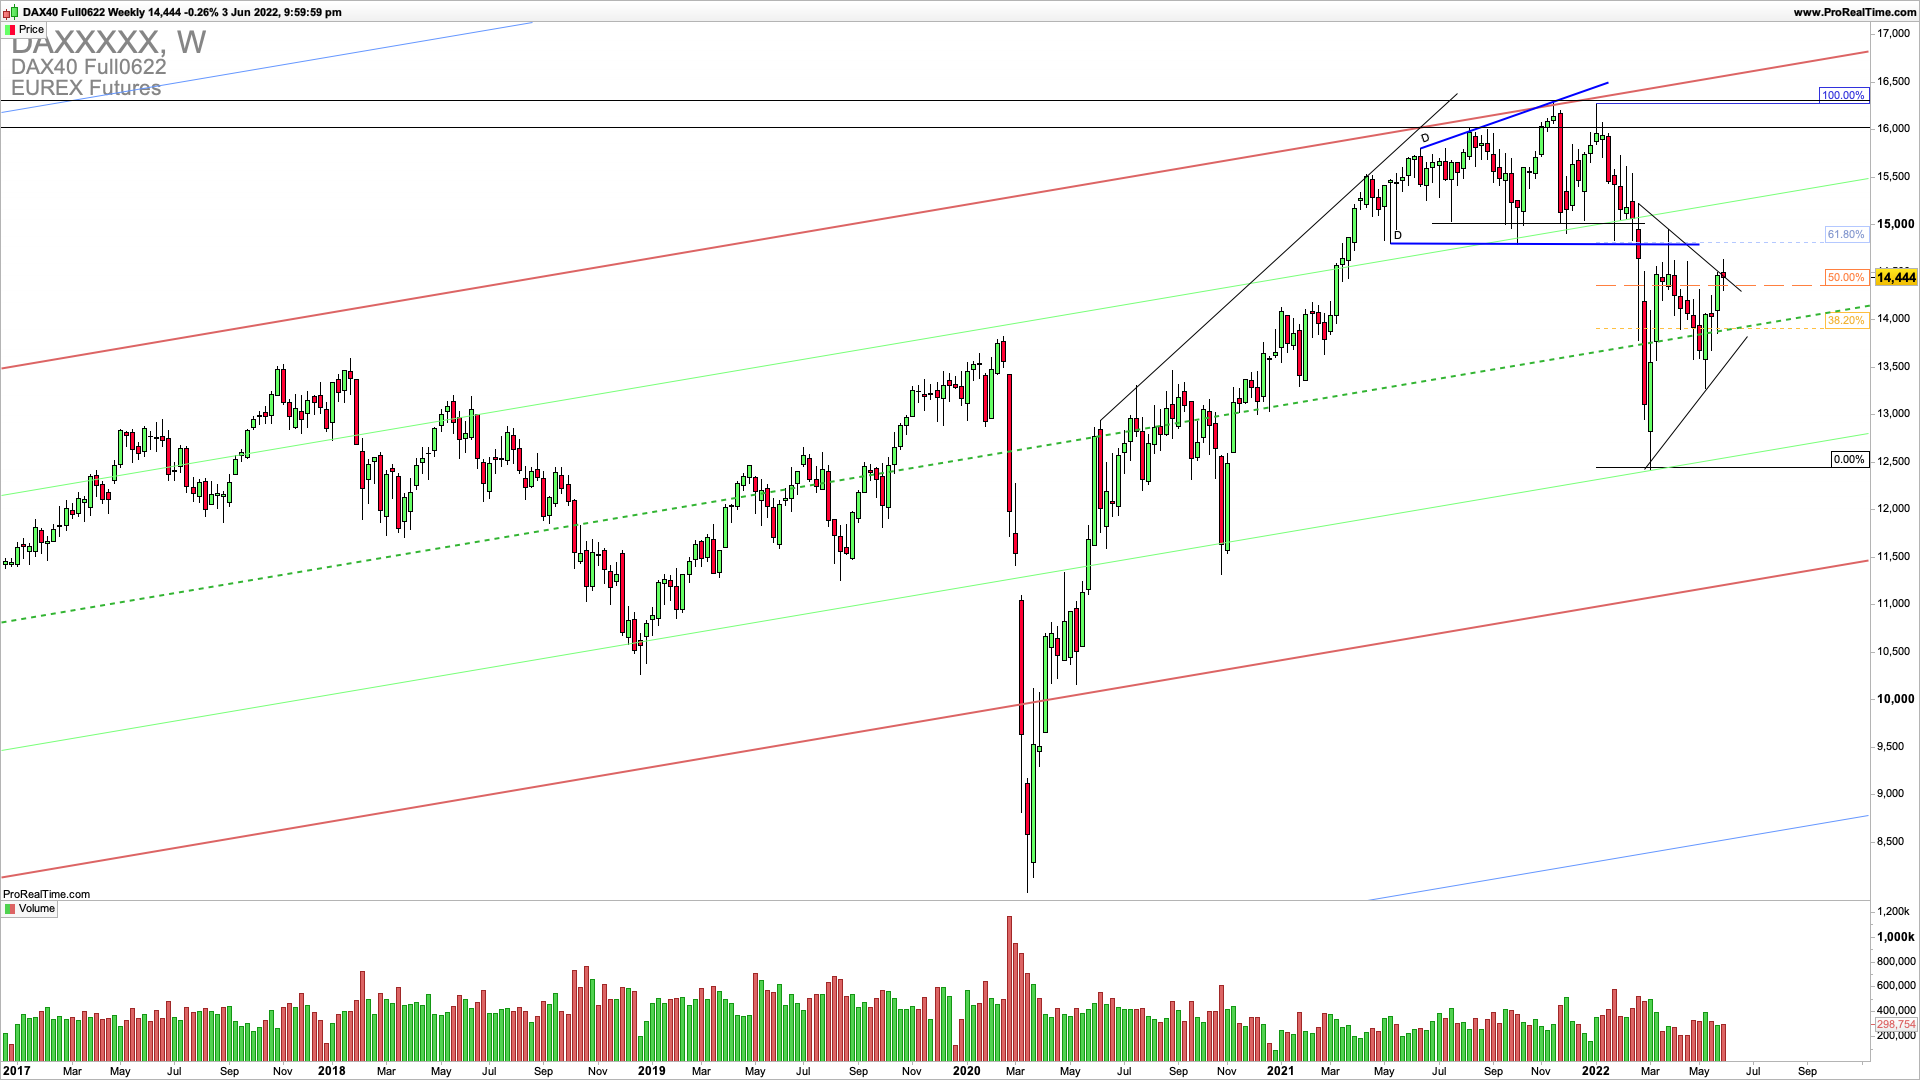
The weekly chart shows a retest of the broken 14500 resistance and also a triangle that is a downside extension triangle by nature. Again we can see the importance of a 14400 level that needs to be broken with confirmation to the downside for the DAX to attack the 13800 triangle line again.
JOIN TRADER’S CLASSROOM TO LEARN A PERFECT ENTRY AND EXIT TIMING IN ALL ASSET CLASSES
On a daily chart, we can see a good RR trade opportunity Already a member? This article is so good, it’s for premium members only.
Does that sound like you?
Go Premium to read full trading strategy with parameters of entry, stop loss, and exit. Why Premium?
We have used the combination of the top-down trading analysis to get these critical levels explained in the charts. Also, you can see Elliott Wave and price action analysis together in action along with the Andrews Pitchfork channel tool. If you want to learn the trading strategy that will give you immediate results in your trading register for Trader’s classroom.
