
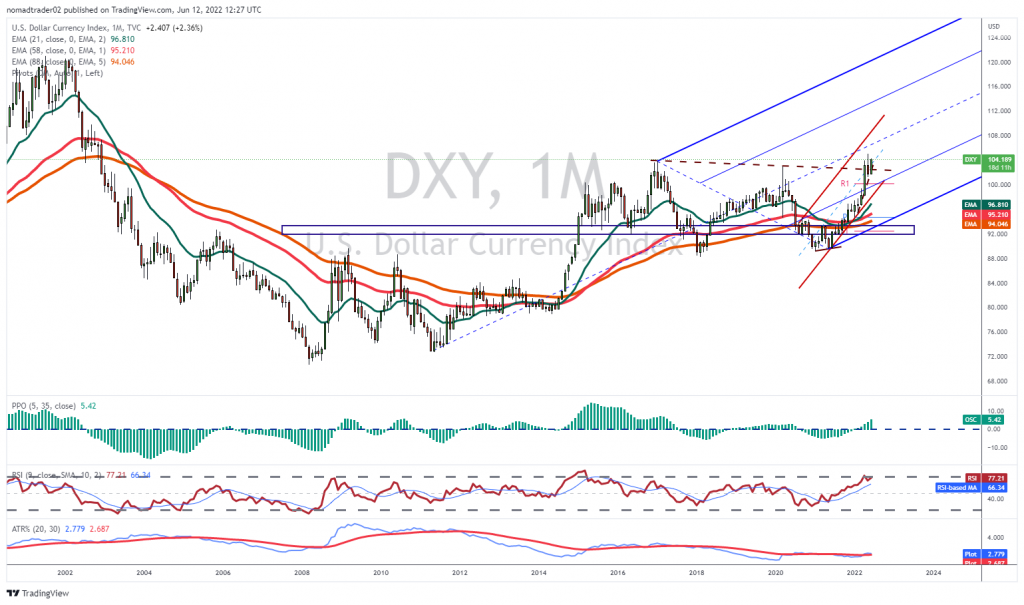
DXY fifth upside wave extension
DXY is bouncing off the strong upside support zone 101-102. This also represents the fifth wave of the five, an upside impulsive wave swing from 89 and a confirmation of the break above the long-term falling trend line.
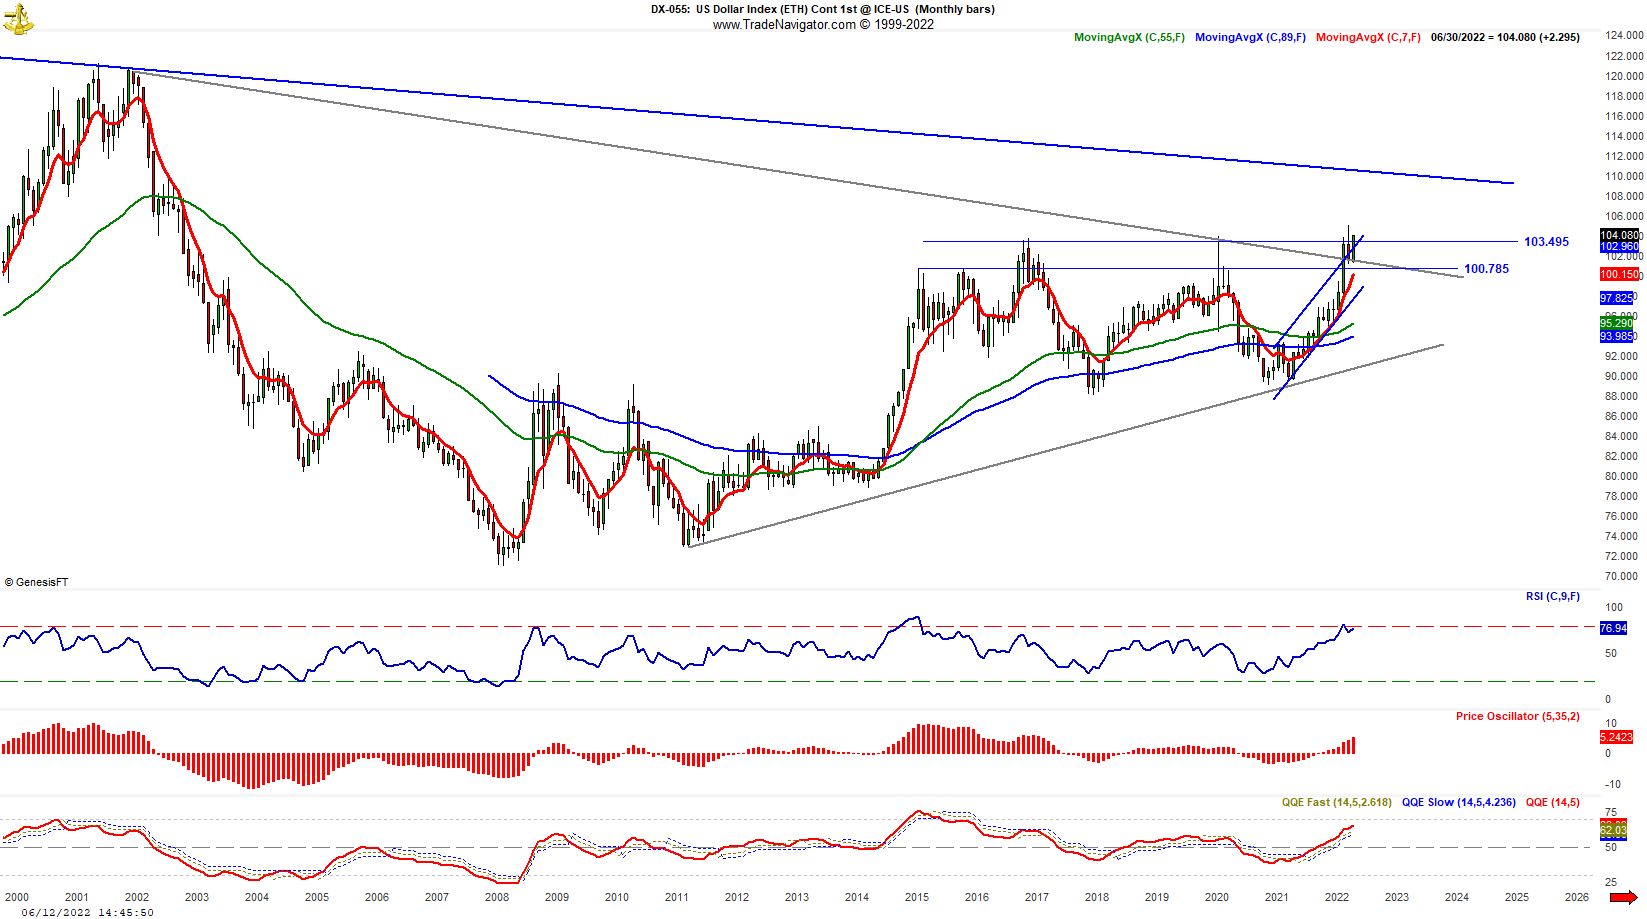
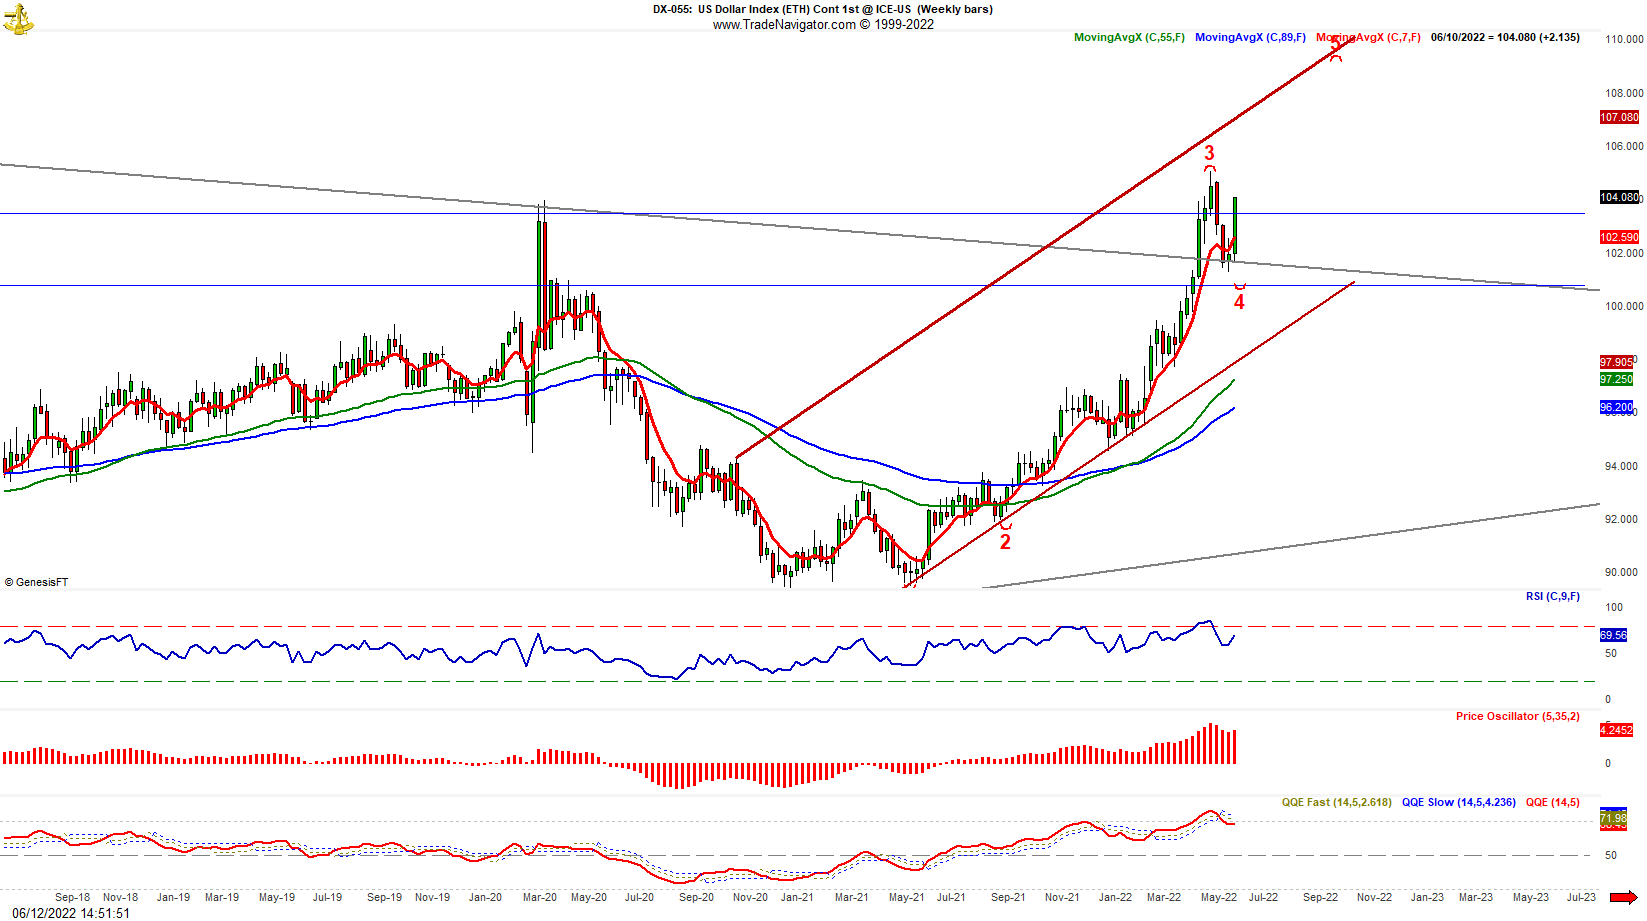
The weekly chart reveals an extension from the short-term uptrend line in the upside parallel channel with the target up to the 108-110 zone. The price action confirms the higher upside extension after the pullback to the support zone and retesting of the broken long-term downtrend line.
JOIN TRADER’S CLASSROOM TO LEARN A PERFECT ENTRY AND EXIT TIMING IN ALL ASSET CLASSES
On a daily chart, we can see a good RR trade opportunity Already a member? This article is so good, it’s for premium members only.
Does that sound like you?
Go Premium to read full trading strategy with parameters of entry, stop loss, and exit. Why Premium?
We have used the combination of the top-down trading analysis to get these critical levels explained in the charts. Also, you can see Elliott Wave and price action analysis together in action along with the Andrews Pitchfork channel tool. If you want to learn the trading strategy that will give you immediate results in your trading register for Trader’s classroom.
