

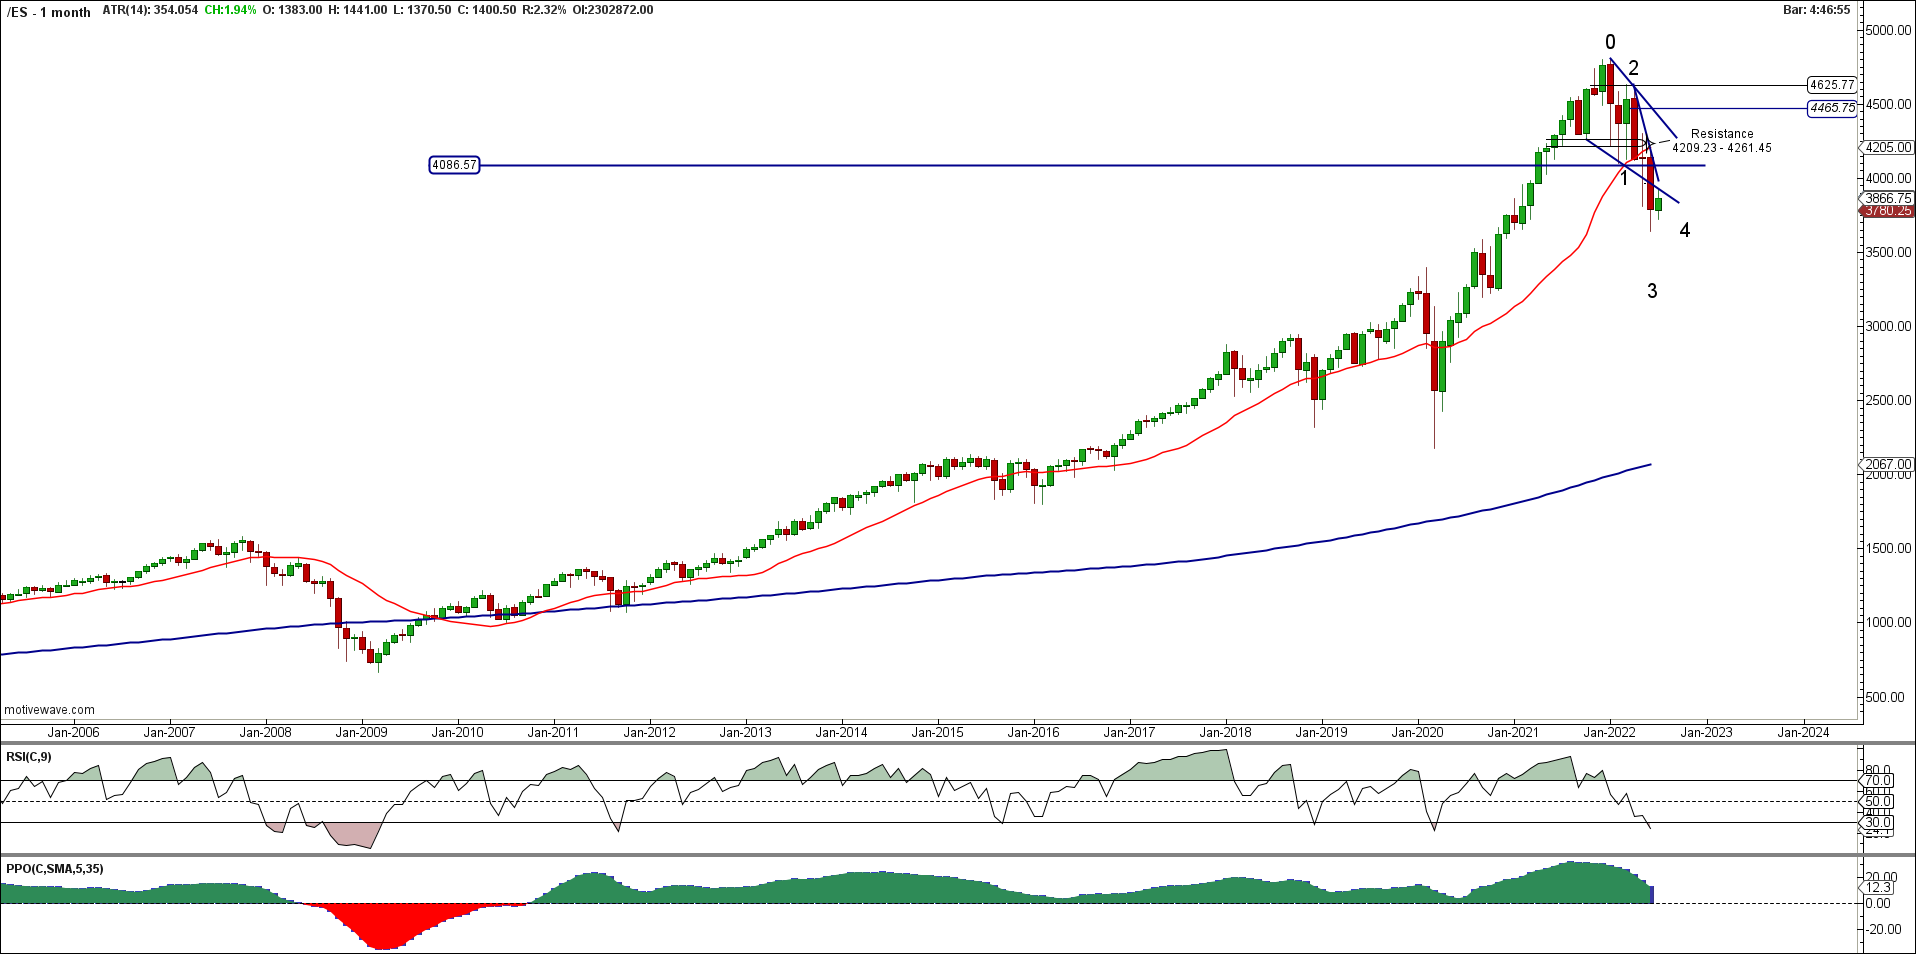
SPX consolidation triangle
SPX is breaking below the strong resistance 4050 with the confirmation. We are seeing on the monthly chart consolidation below this level. A break below the wedge and horizontal resistance are clear and the instrument is getting ready for a third wave continuation to target 3400.
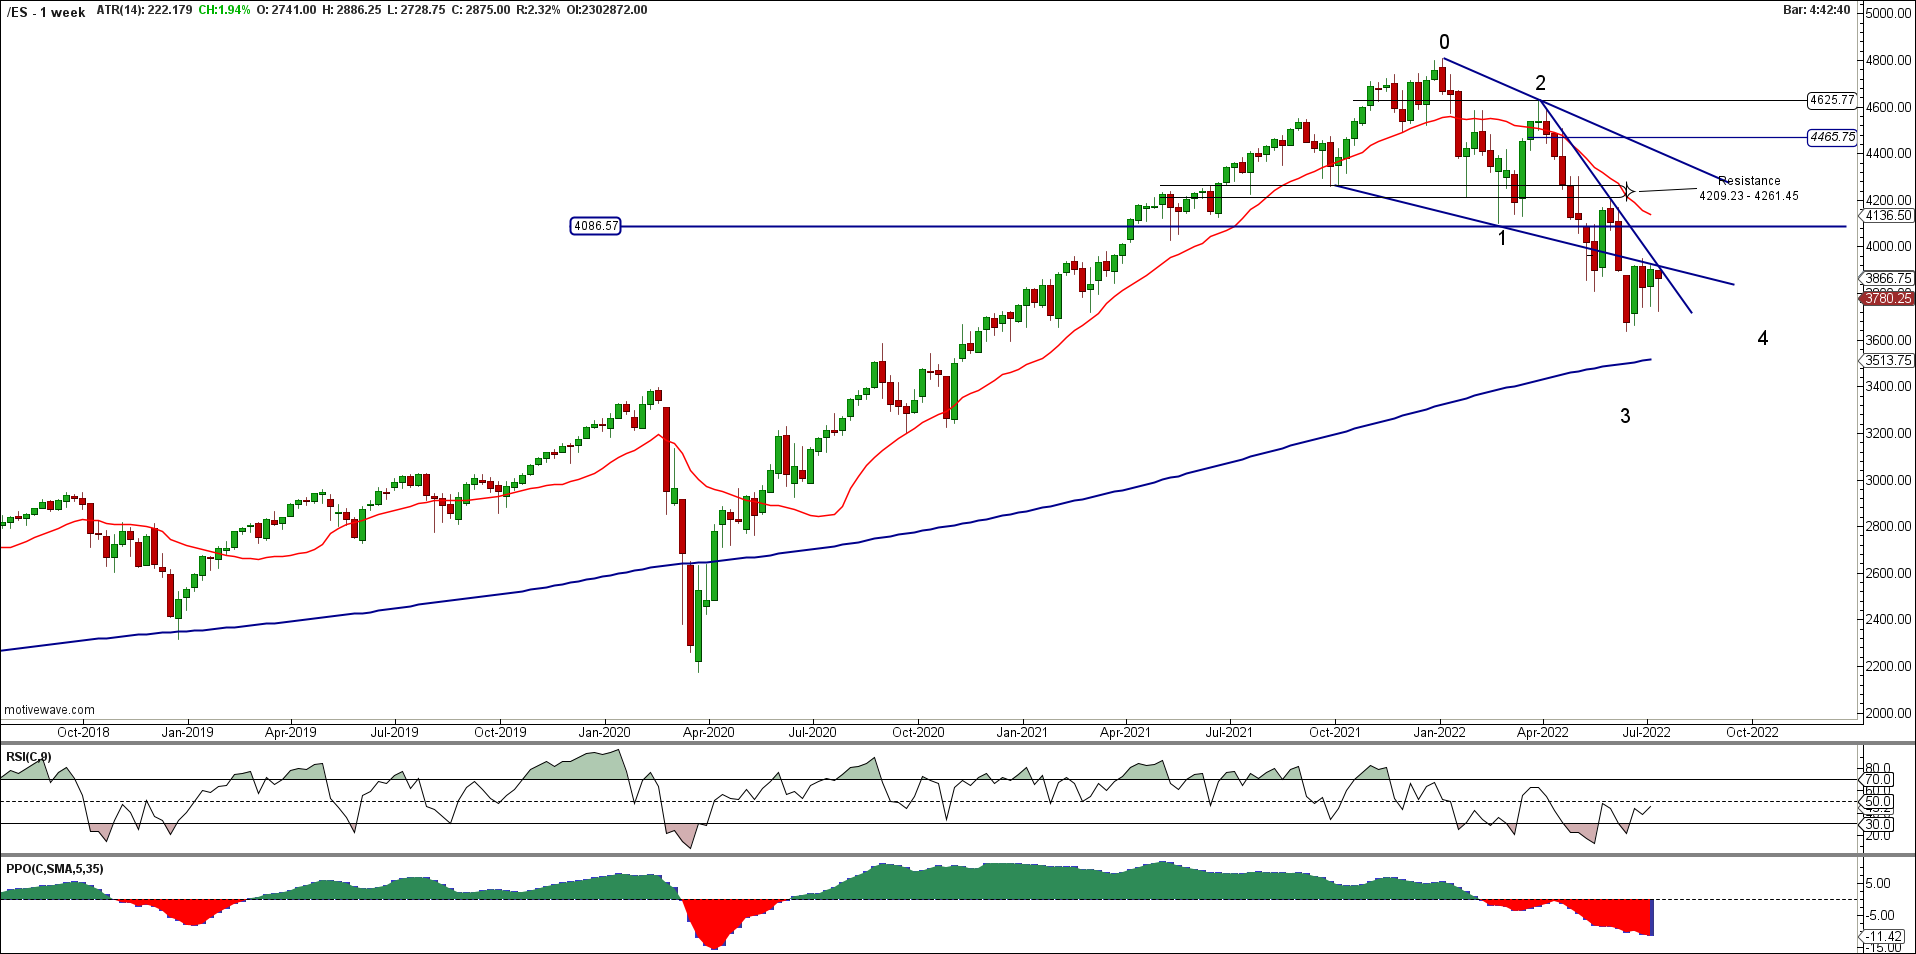
The weekly chart reveals a falling trend line being challenged again with multiple rejections, along with 3900 previously broken wedge resistance. This time price action is squeezed and is looking for a big breakout lower from this consolidation.
JOIN TRADER’S CLASSROOM TO LEARN A PERFECT ENTRY AND EXIT TIMING IN ALL ASSET CLASSES
On a daily chart, we can see a good RR trade opportunity Already a member? This article is so good, it’s for premium members only.
Does that sound like you?
Go Premium to read full trading strategy with parameters of entry, stop loss, and exit. Why Premium?
We have used the combination of the top-down trading analysis to get these critical levels explained in the charts. Also, you can see Elliott Wave and price action analysis together in action along with the Andrews Pitchfork channel tool. If you want to learn the trading strategy that will give you immediate results in your trading register for Trader’s classroom.
