
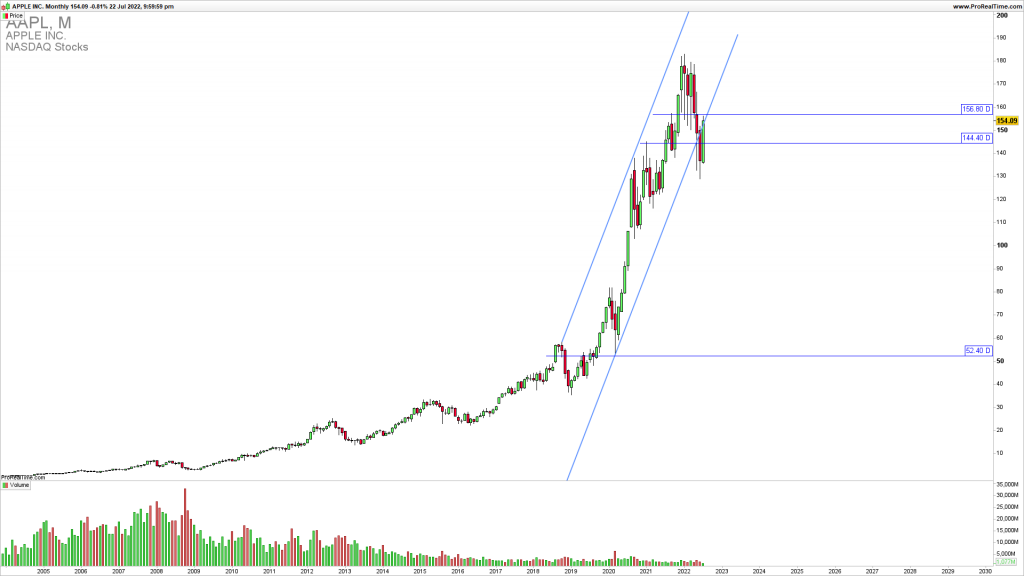
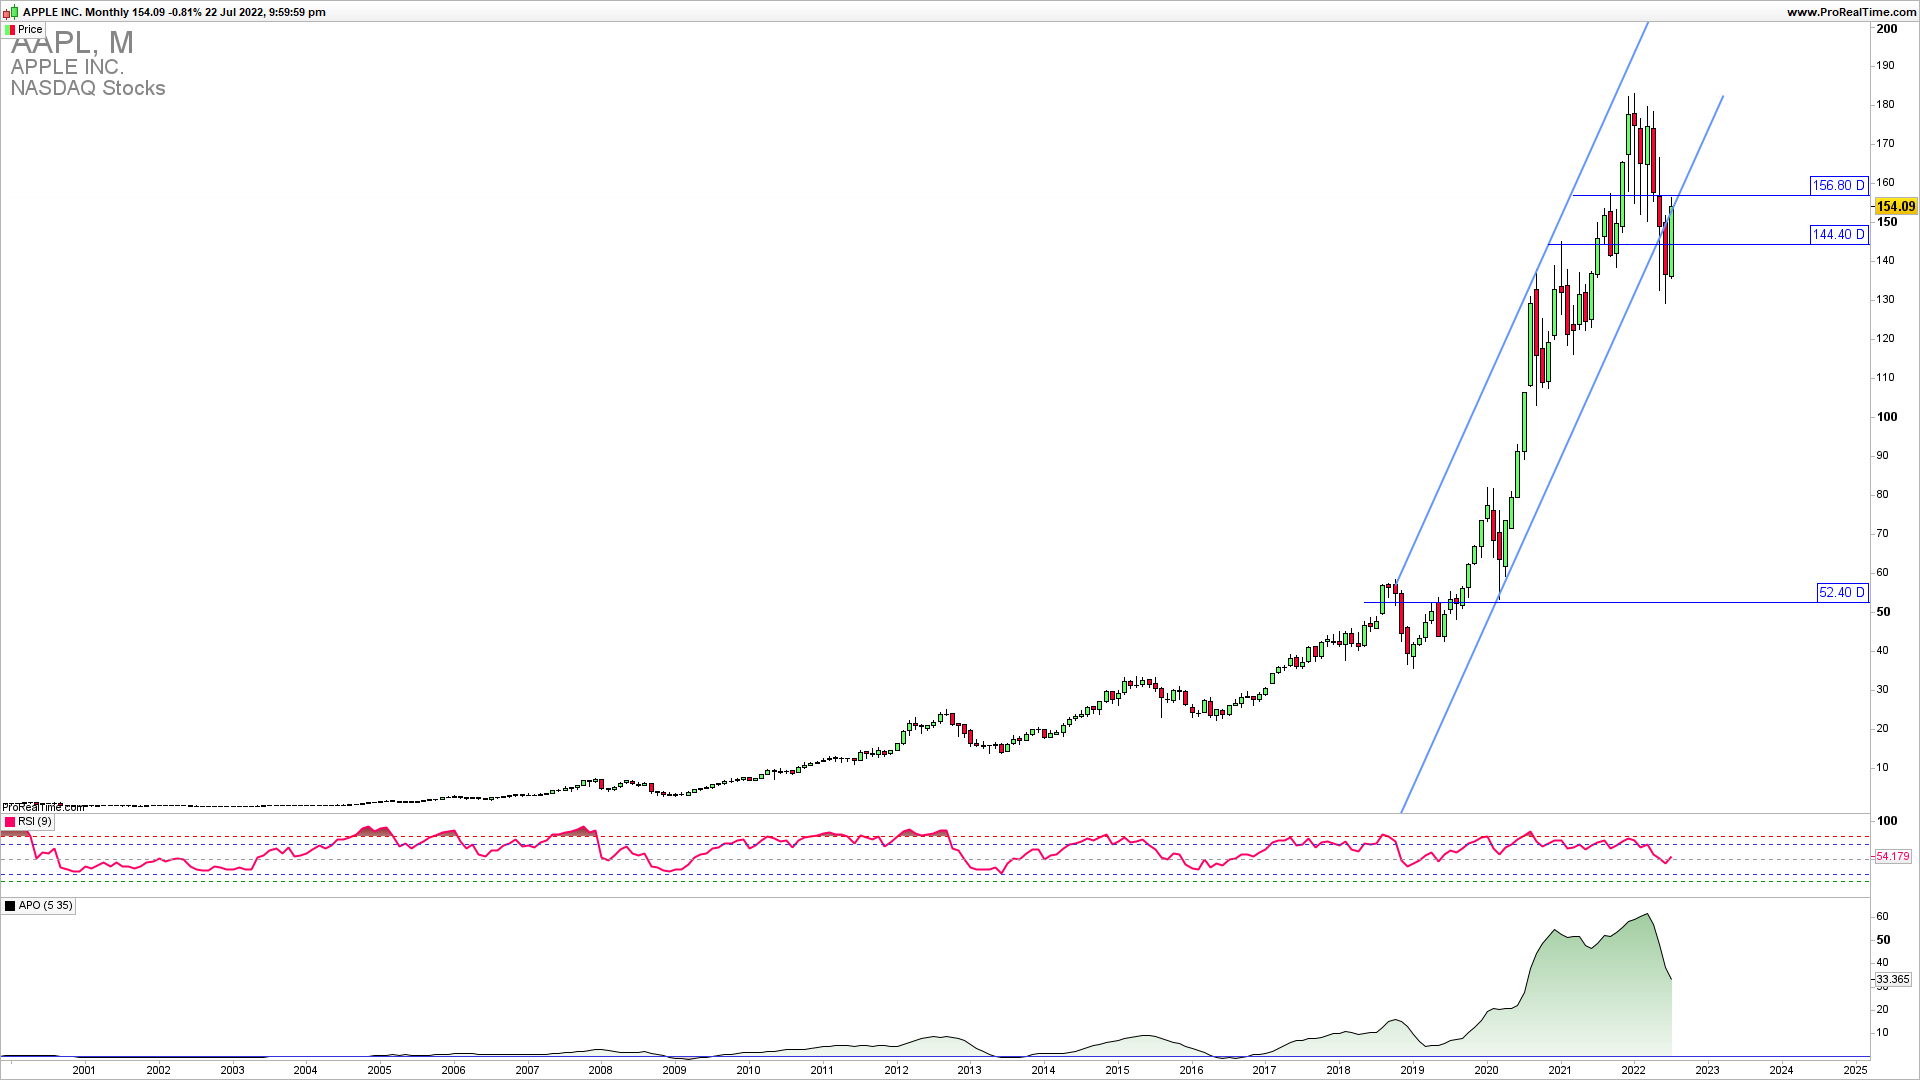
AAPL is retesting the broken uptrend channel
AAPL is retesting the previously broken channel resistance line 155. This is happening ahead of the FED meeting and APPLE quarterly earning announcements also despite the company started cutting staff. A rejection here and a break below 144 will lead to a downside continuation.
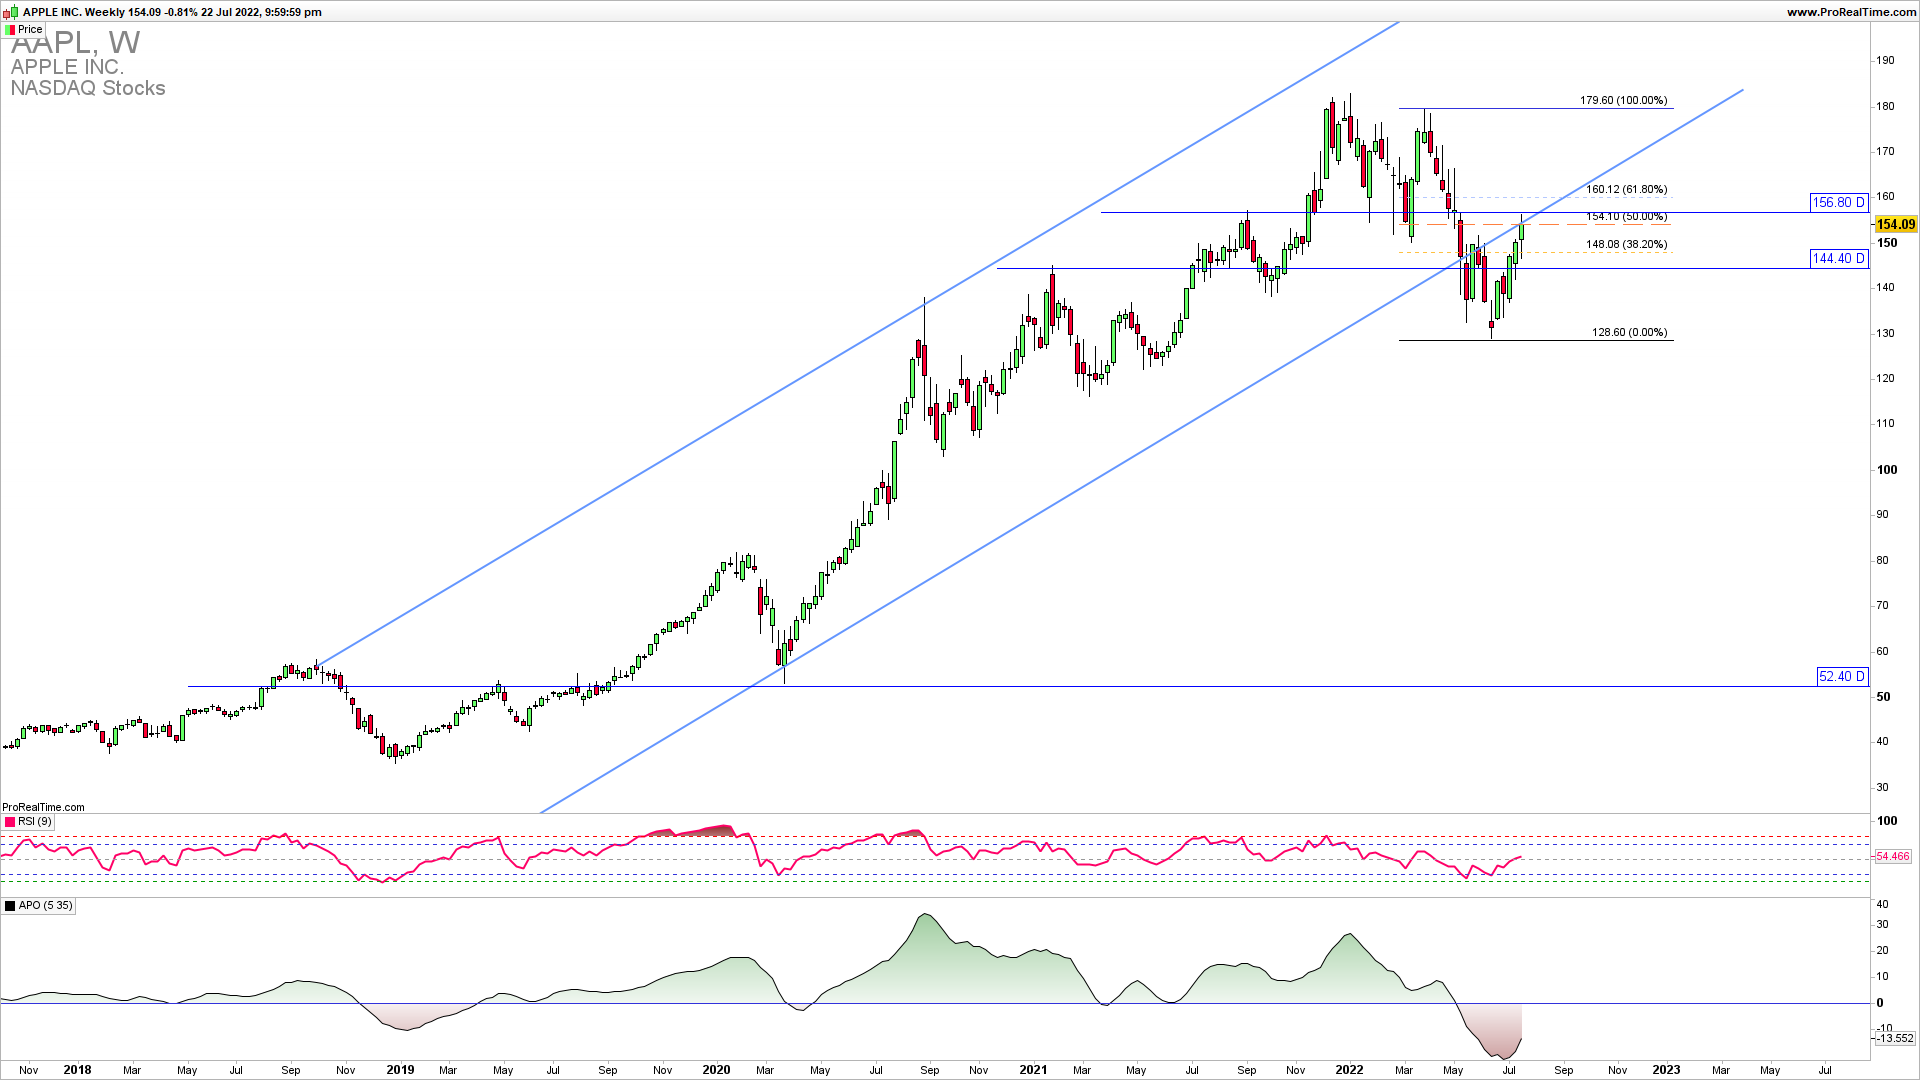
The weekly chart reveals a clear retest of the channel line and a test of 50% Fibonacci retracement of the latest push down. There was a significant weekly rejection from 156.80 September 2021 top to 154.10.
JOIN TRADER’S CLASSROOM TO LEARN A PERFECT ENTRY AND EXIT TIMING IN ALL ASSET CLASSES
On a daily chart, we can see a good RR trade opportunity Already a member? This article is so good, it’s for premium members only.
Does that sound like you?
Go Premium to read full trading strategy with parameters of entry, stop loss, and exit. Why Premium?
We have used the combination of the top-down trading analysis to get these critical levels explained in the charts. Also, you can see Elliott Wave and price action analysis together in action along with the Andrews Pitchfork channel tool. If you want to learn the trading strategy that will give you immediate results in your trading register for Trader’s classroom.
