
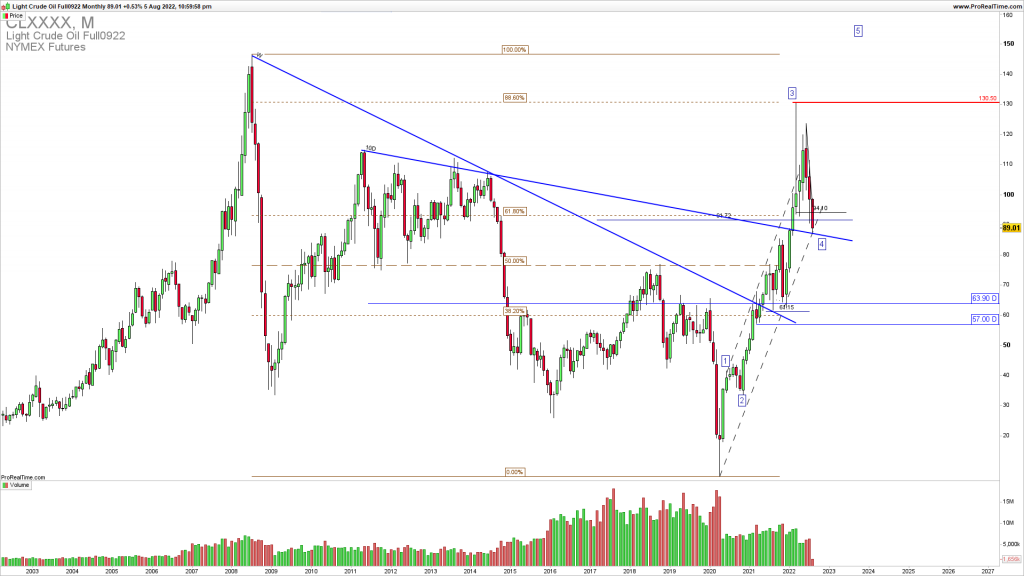
Oil is testing the strong support
Oil is testing the strong upside confluence support. This is coming after the strong pullback from 130. Now it is testing the strong confluence of the support 85-90 zone. Uptrend channel support, previously broken uptrend resistance retest. It is also 61.8% retracement of the previous March-May 2022 swing higher.
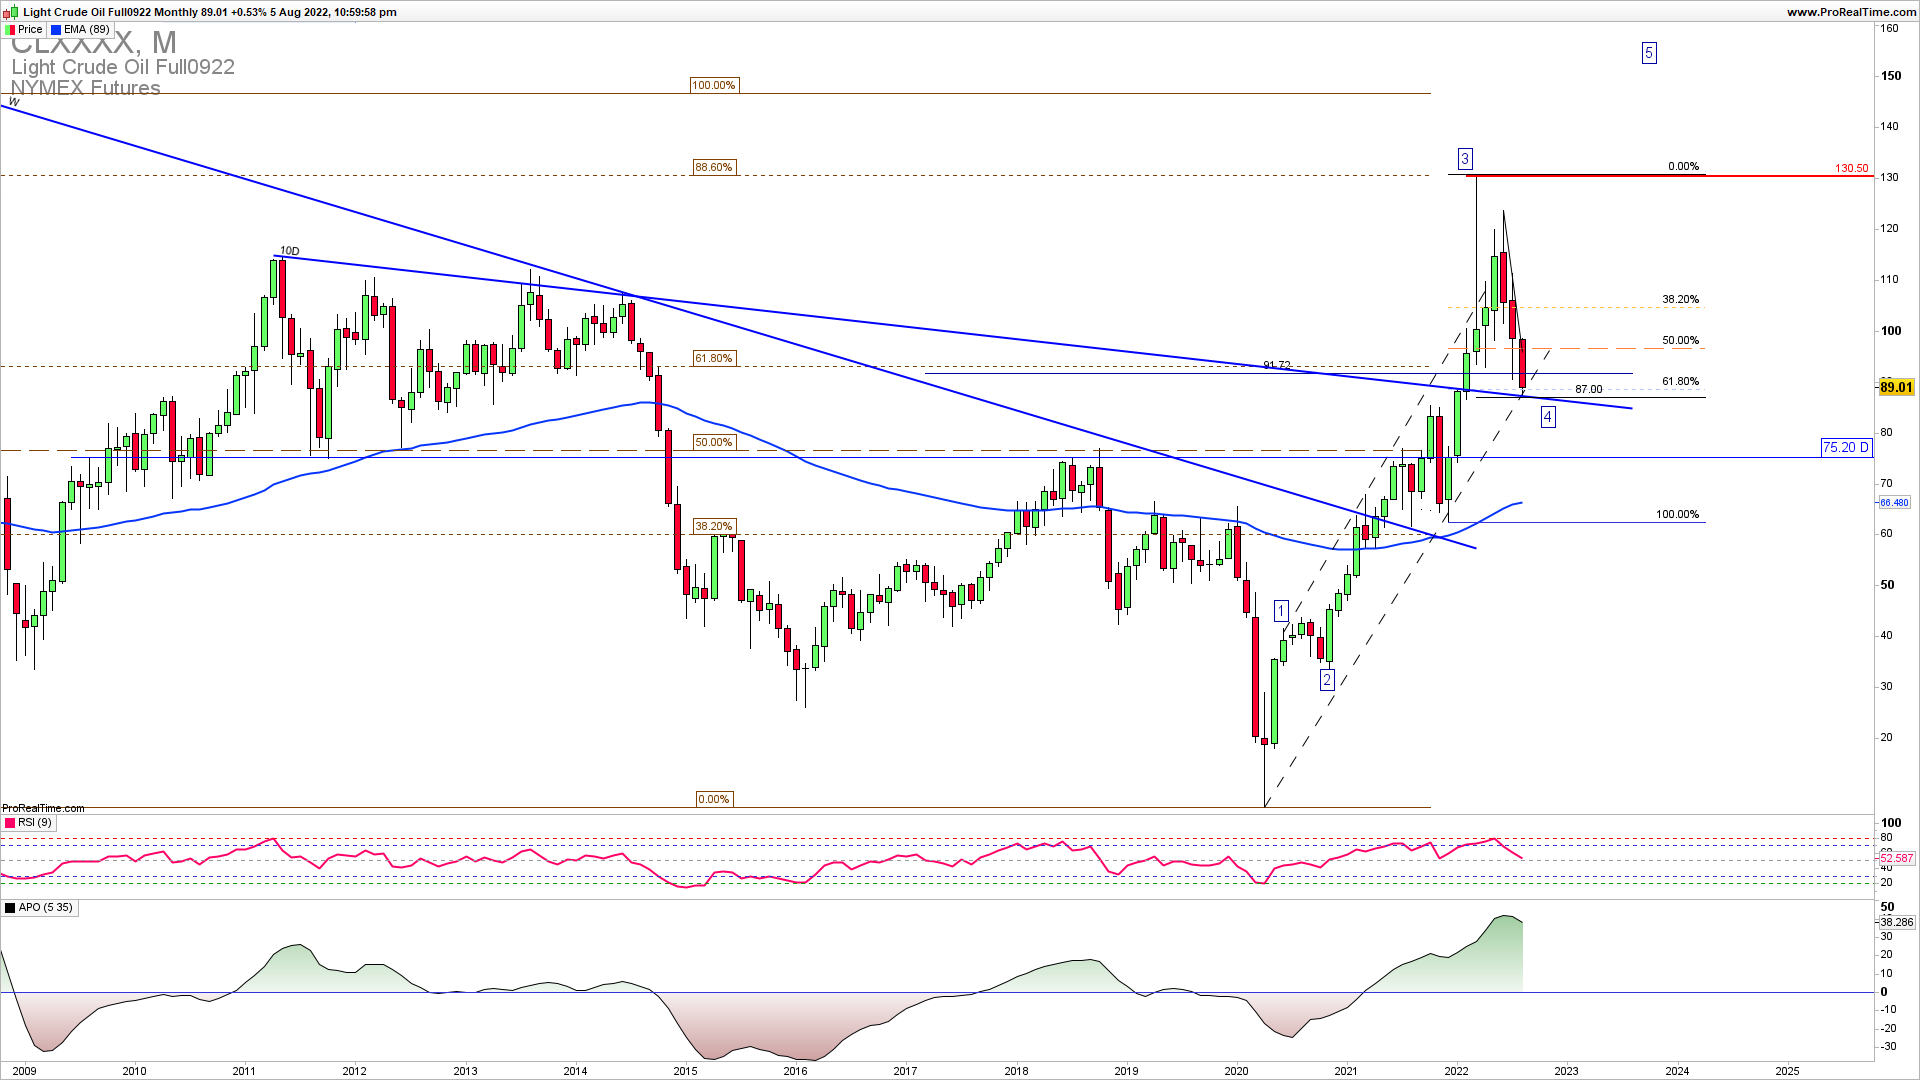
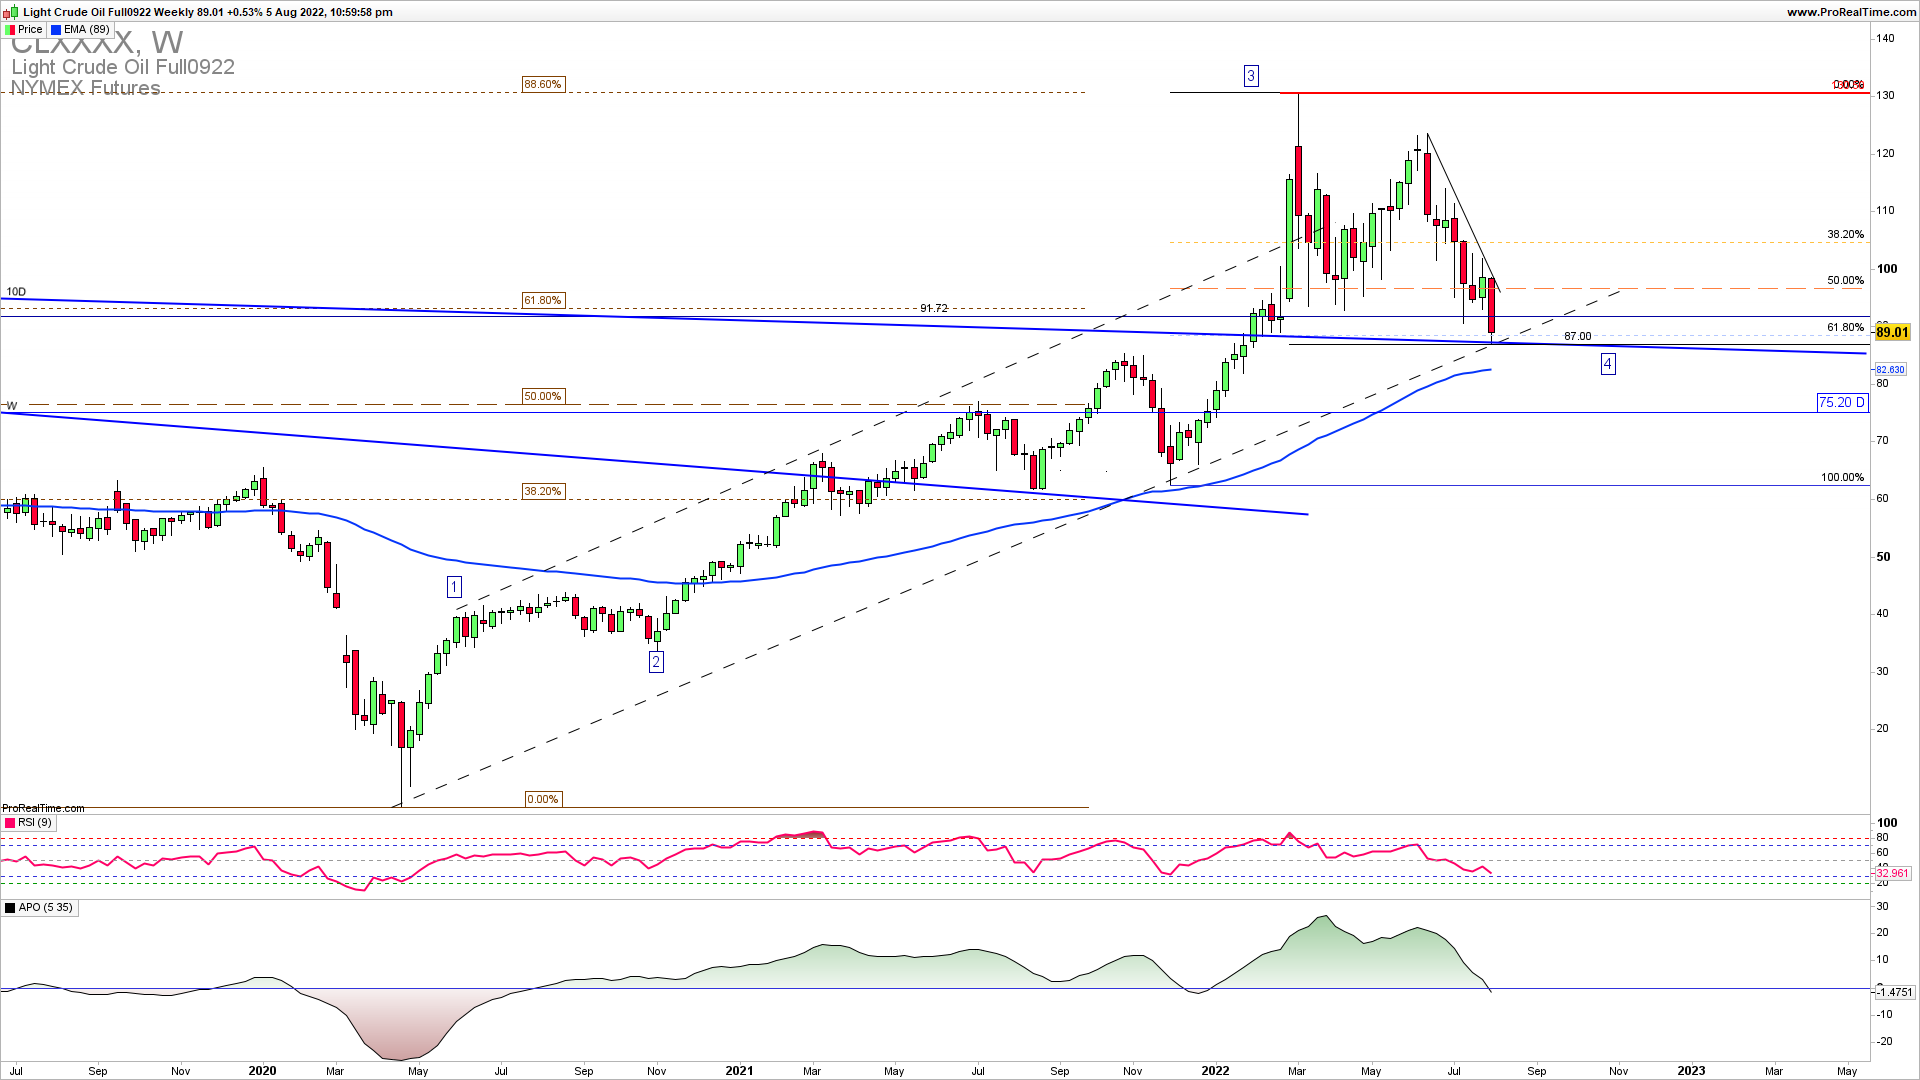
The weekly chart reveals an uptrend channel line support 87 which also could be validated as 4th wave of the 5 impulsive waves higher. If we get a bounce from here this will mean that we have this 5th wave higher for a retest of the high. Break below this level would lead to an invalidation and the deeper pullback.
JOIN TRADER’S CLASSROOM TO LEARN A PERFECT ENTRY AND EXIT TIMING IN ALL ASSET CLASSES
On a daily chart, we can see a good RR trade opportunity Already a member? This article is so good, it’s for premium members only.
Does that sound like you?
Go Premium to read full trading strategy with parameters of entry, stop loss, and exit. Why Premium?
We have used the combination of the top-down trading analysis to get these critical levels explained in the charts. Also, you can see Elliott Wave and price action analysis together in action along with the Andrews Pitchfork channel tool. If you want to learn the trading strategy that will give you immediate results in your trading register for Trader’s classroom.
