
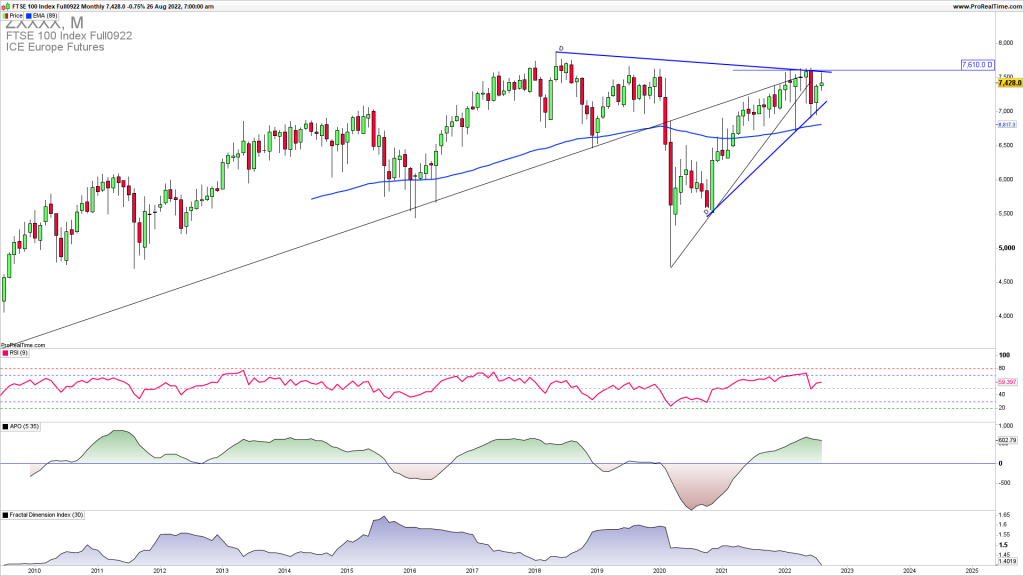
FTSE has been rejected from 7600
FTSE is reversing lower from 7600 for a pullback to 7000. This is a previous triple top resistance and a long-term triangle upside resistance. This is also a retest of a previous broken rising wedge resistance.

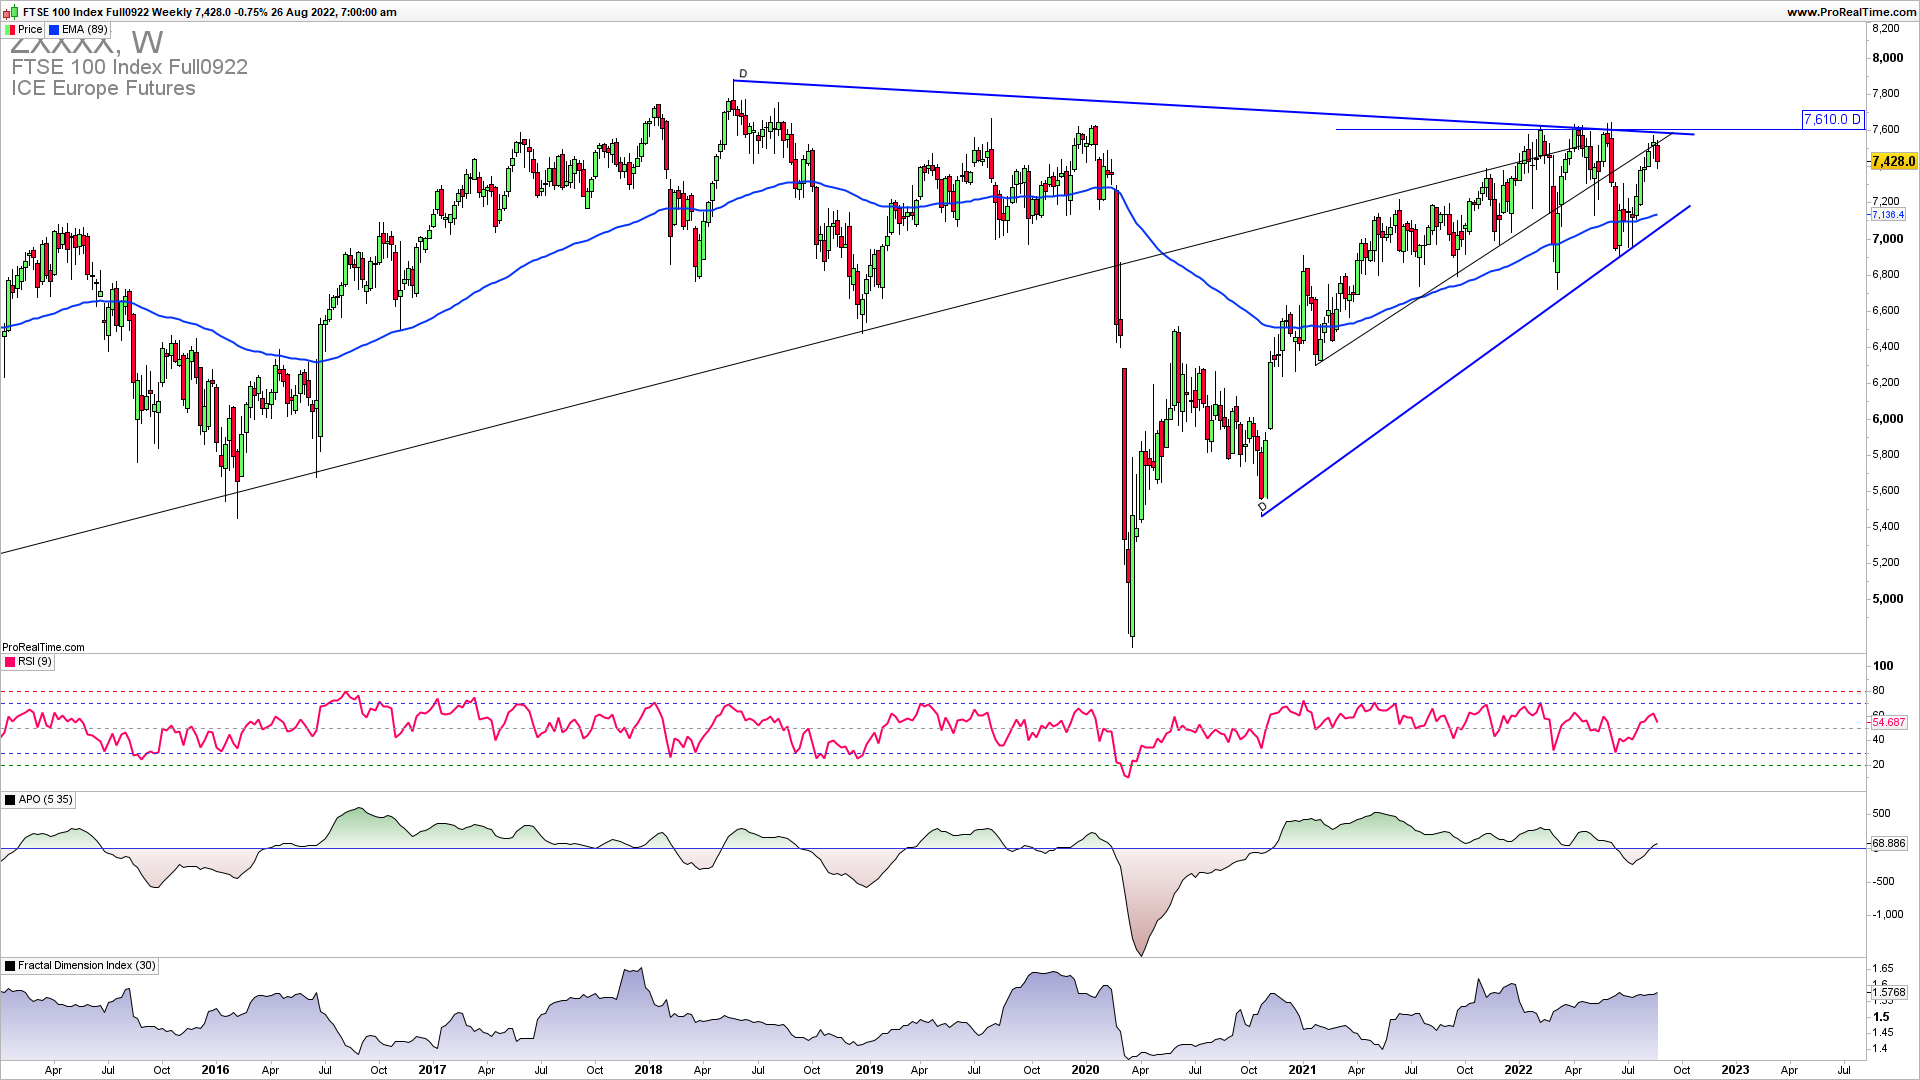
The weekly chart reveals a rejection of the downtrend-sloping line connecting the previous triple top. Also, it is the first bearish candlesticks formation in weeks indicating 7400 as the most crucial downside resistance now.
JOIN TRADER’S CLASSROOM TO LEARN A PERFECT ENTRY AND EXIT TIMING IN ALL ASSET CLASSES
On a daily chart, we can see a good RR trade opportunity Already a member? This article is so good, it’s for premium members only.
Does that sound like you?
Go Premium to read full trading strategy with parameters of entry, stop loss, and exit. Why Premium?
We have used the combination of the top-down trading analysis to get these critical levels explained in the charts. Also, you can see Elliott Wave and price action analysis together with the Andrews Pitchfork channel tool. If you want to learn the trading strategy that will give you immediate results in your trading register for Trader’s classroom.
