Technical Analysis

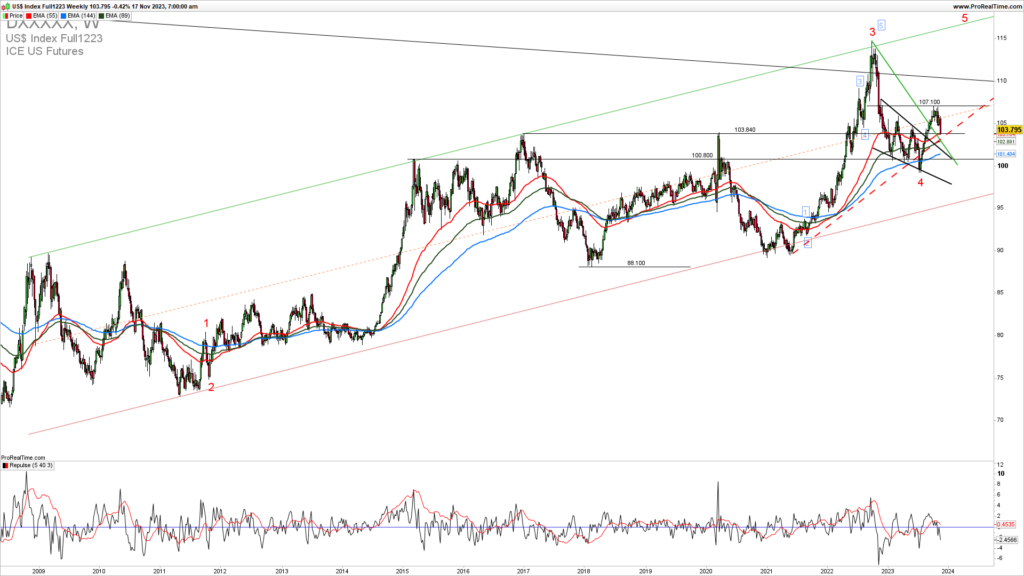
DXY weekly chart

DXY is retesting the broken resistance for an upside continuation

DXY recently pulled back after the strong breakout higher above a previous strong long-term resistance of 103.800. After reaching the high of 107.100 we have seen a strong pullback from this level and now DXY is retesting a previously broken upside resistance. Breaking above or diving below will determine a

DXY is retesting the broken resistance for an upside continuation Read More »

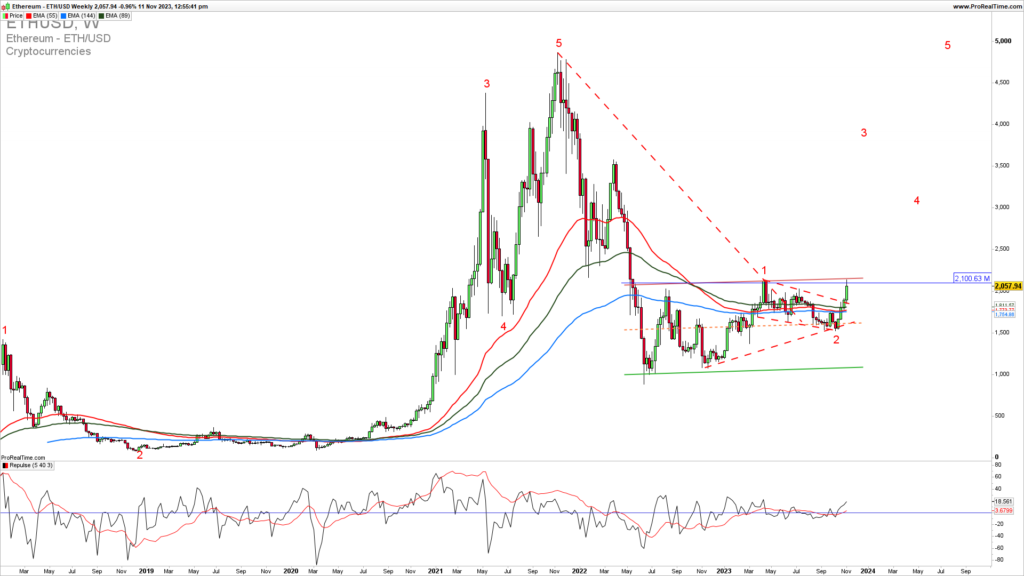
Ethereum weekly chart

Ethereum Reversal Signals Bullish Trend: A Comprehensive Analysis

Ethereum (ETH), known not only as a versatile platform but also as a dynamic asset, has been catching the attention of crypto enthusiasts. Recent developments in the Ethereum market indicate the potential formation of a “higher low” pattern, hinting at a possible reversal in its price direction. Additionally, rising trading

Ethereum Reversal Signals Bullish Trend: A Comprehensive Analysis Read More »

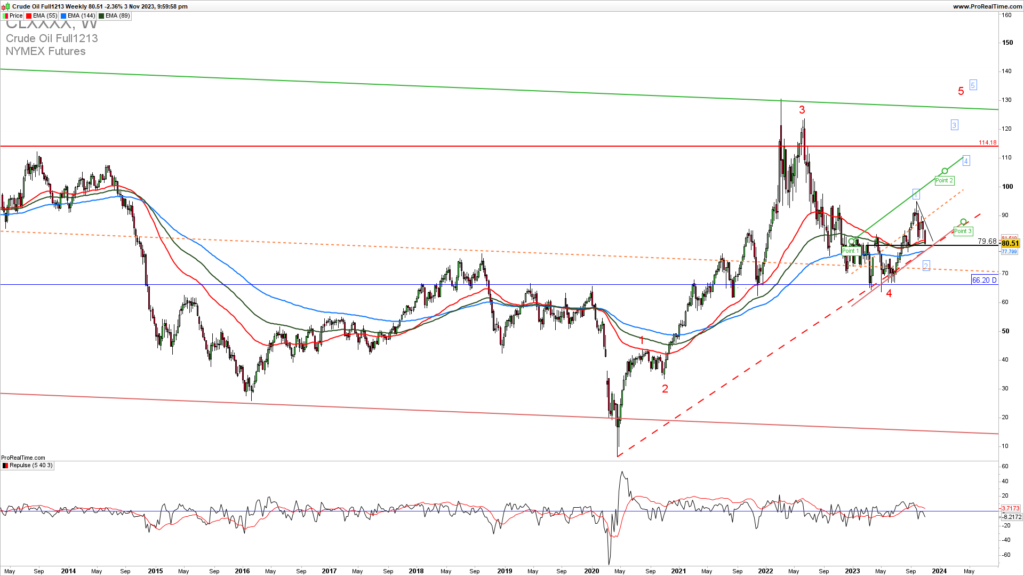
WTI Oil weekly chart

WTI Oil Testing Key Support at $80.50 Level: What You Need to Know

In the world of commodities trading, few assets hold as much significance as WTI Oil. As a major benchmark for crude oil prices, WTI (West Texas Intermediate) is closely monitored by traders, investors, and analysts worldwide. Recent developments have brought attention to the market as WTI Oil tests a key

WTI Oil Testing Key Support at $80.50 Level: What You Need to Know Read More »

Scroll to Top
×