
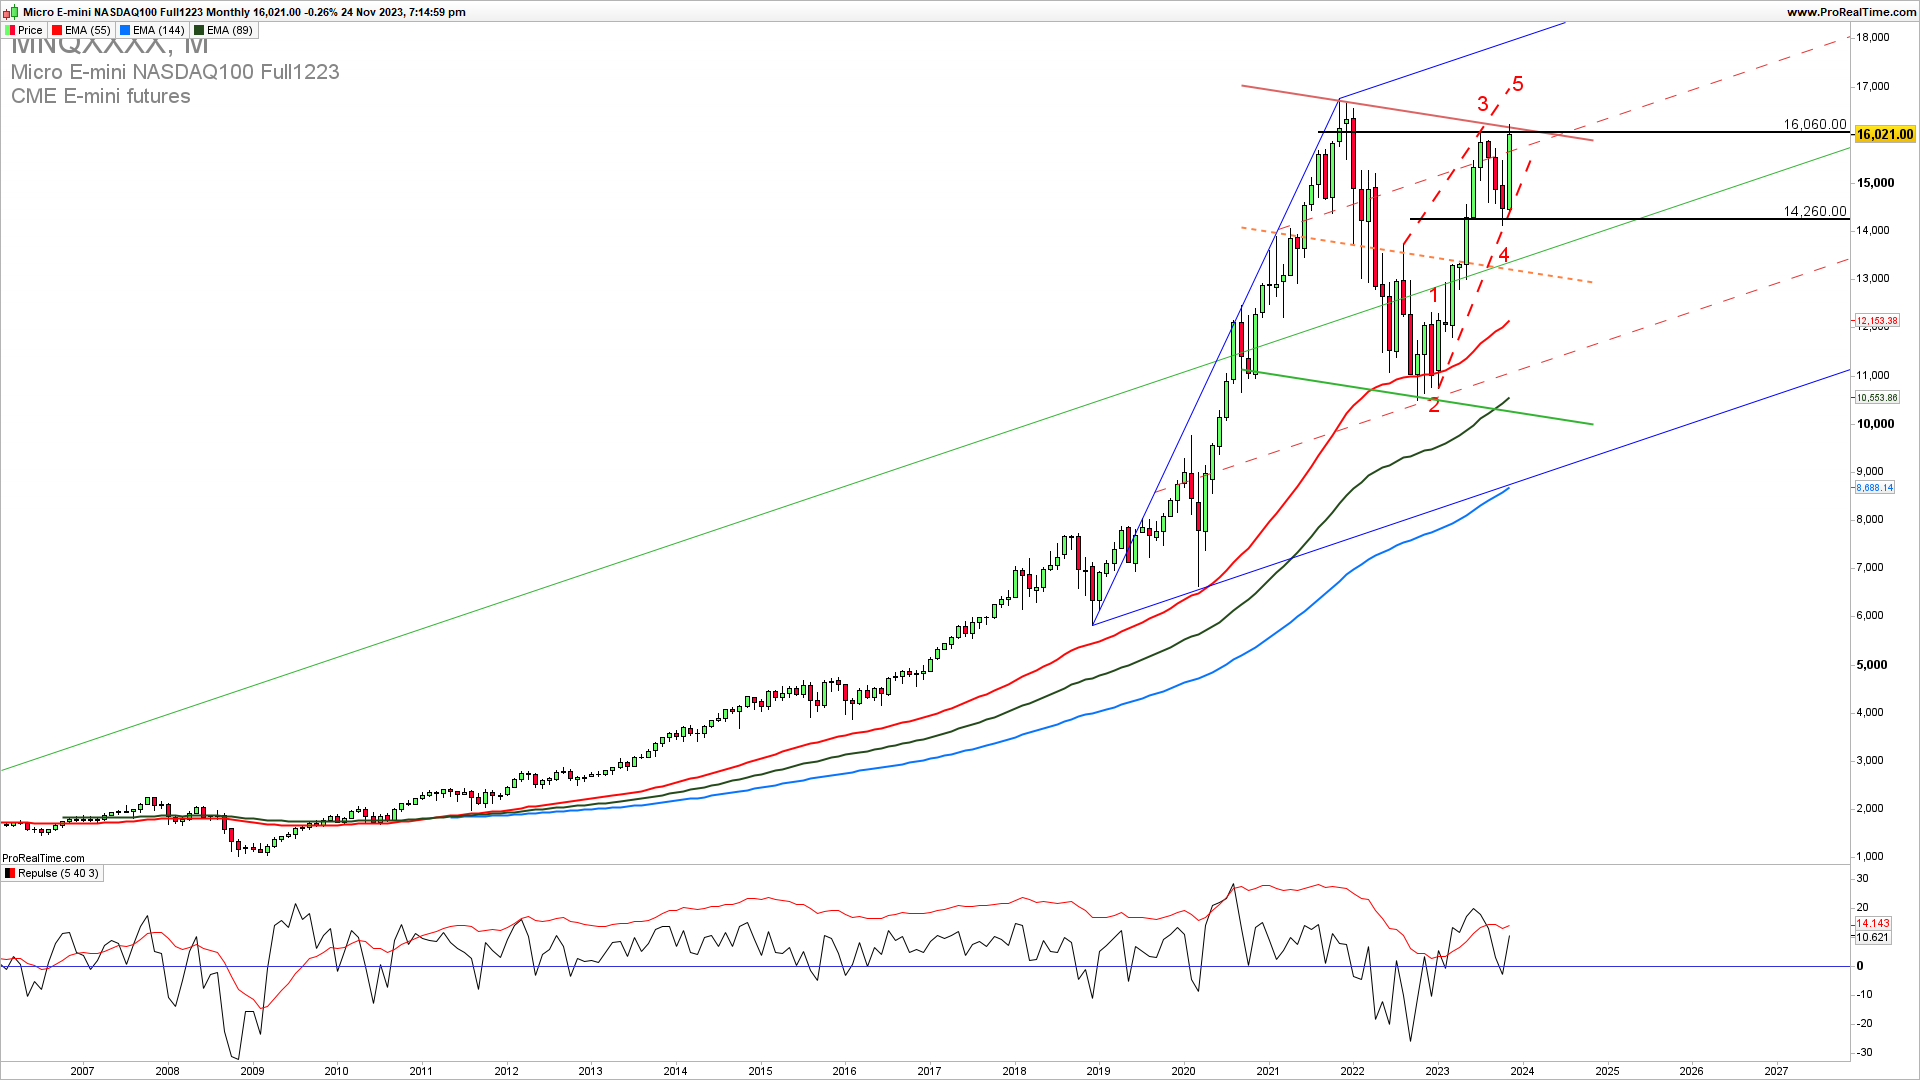
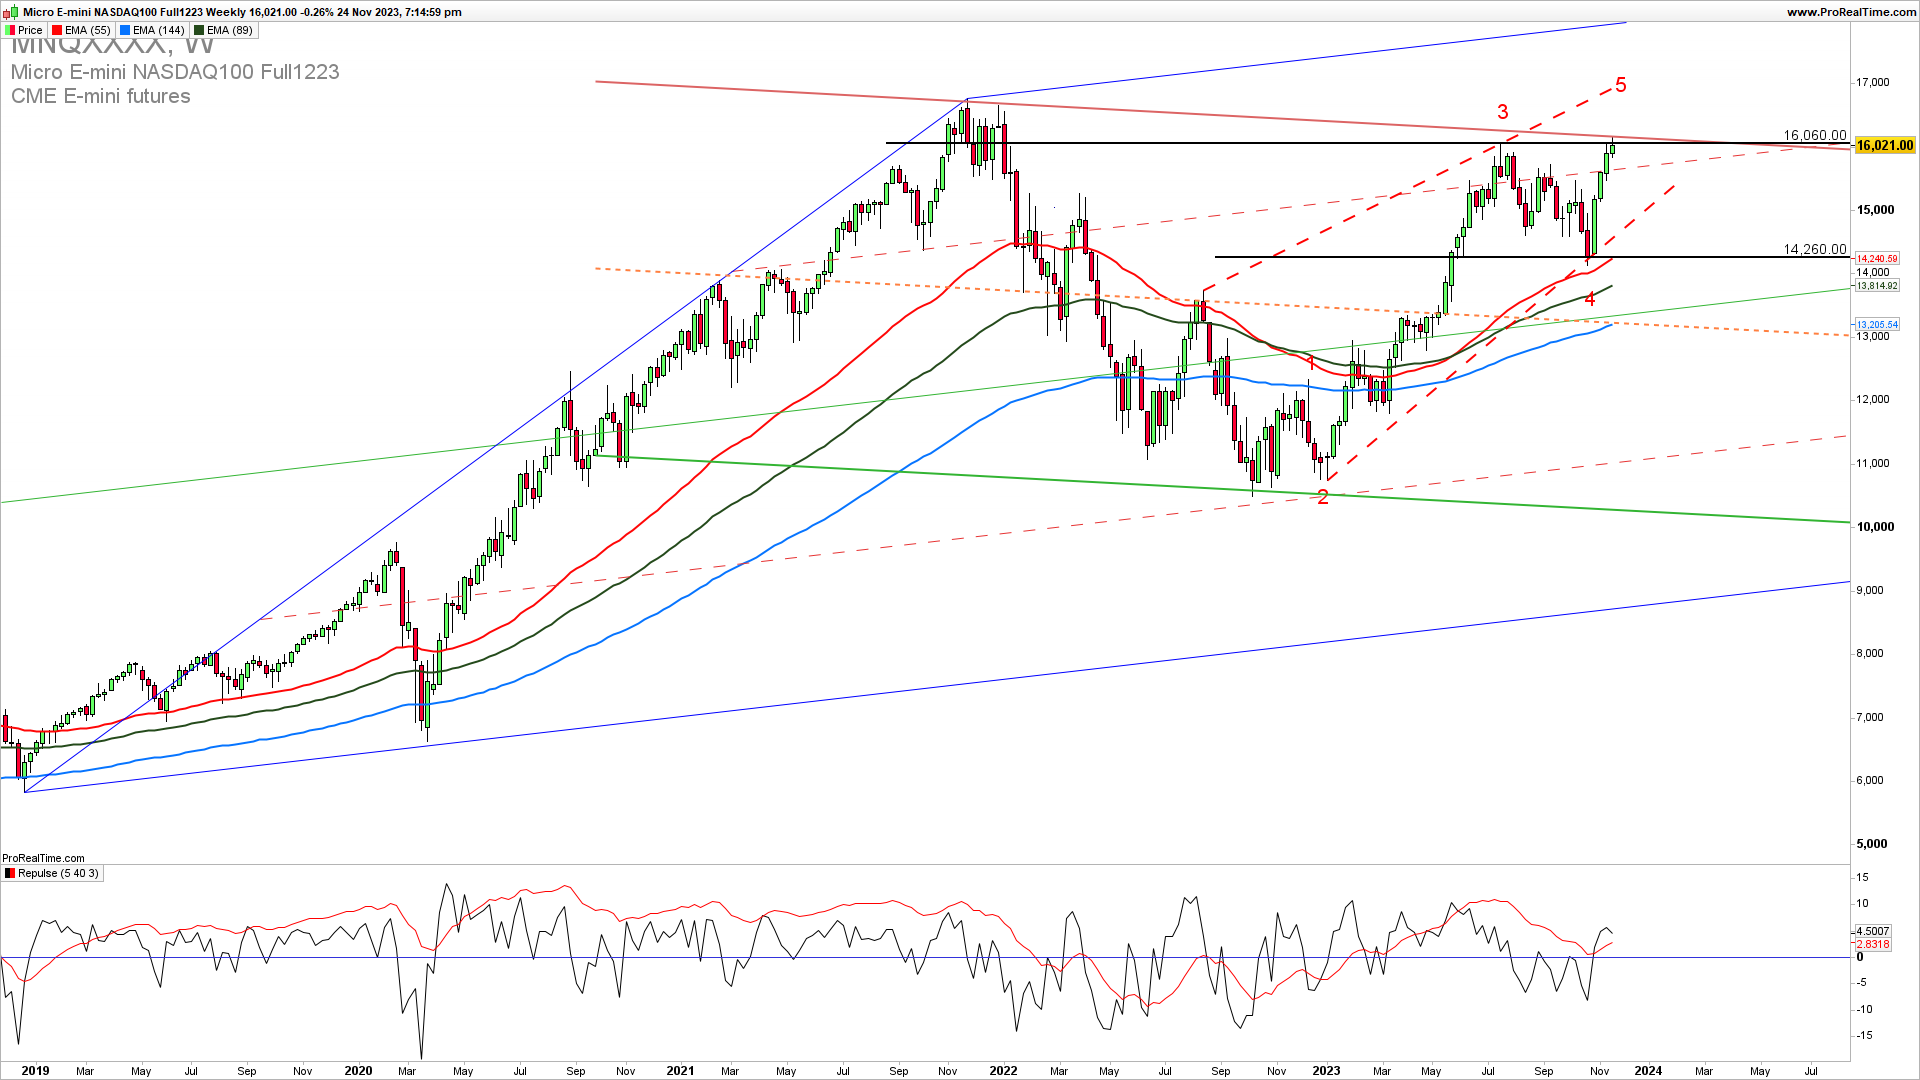
NASDAQ is reaching a strong resistance of 16060 and a critical one for an extension higher. After a bounce from 14200, we have a strong upside month reaching the critical resistance mentioned. Breaking above or rejection will determine a future direction for the NASDAQ. If it sustains above 16060 then we could see soon an extension higher to 17000-18000 zone. Failure here will leave room for another downside swing to 14000 open.
ELLIOTT WAVE LIVE TRADING VIDEO COURSE PRESALES!
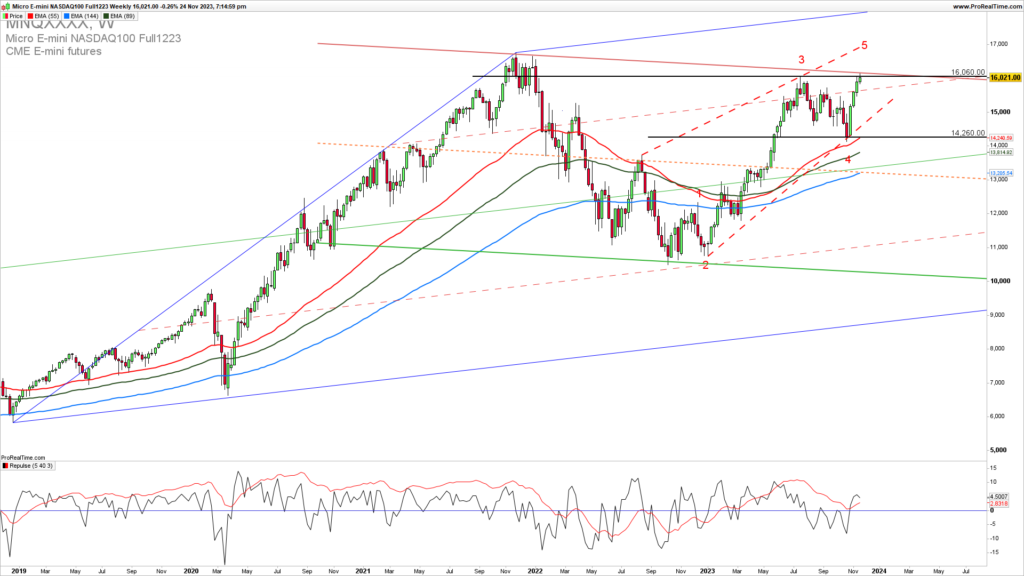
The Weekly NASDAQ chart reveals the ongoing rising wedge price action that is driving it to test 17200 of its upside resistance. A break above here is required to confirm the immediate upside extension in the fifth medium-term wave continuation higher, and we are seeing an ongoing test of it. It is advisable to position yourself in just one trade direction and not to try to catch every swing. If we get a break below 15700 again this will be a perfect short trade opportunity and we need to wait for a proper price action upside break confirmation for the long trade.
GET THE CHART OF THE DAY EVERY DAY IN YOUR INBOX
BLACK FRIDAY- CYBER MONDAY OFFER LIFETIME SPECIAL FOR ONLY $199
As the famous trader says…
“As long as you learn something from a loss, it’s not really a loss.”TOM BASSO
How to trade this?
It is a fact that a strong upside resistance for Q4 2023 is 16060. If we get a confirmed break here we could see a strong upside continuation and a test of 17200. Near-term, long-trade entries have a higher probability of success but for the conservative traders upon a break above 16060. Less conservative traders can open the long trade here with a bit of risk and stop the loss below 15650.
TRADE NASDAQ WITH A CHALLENGE ACCOUNT AND GET FUNDED