
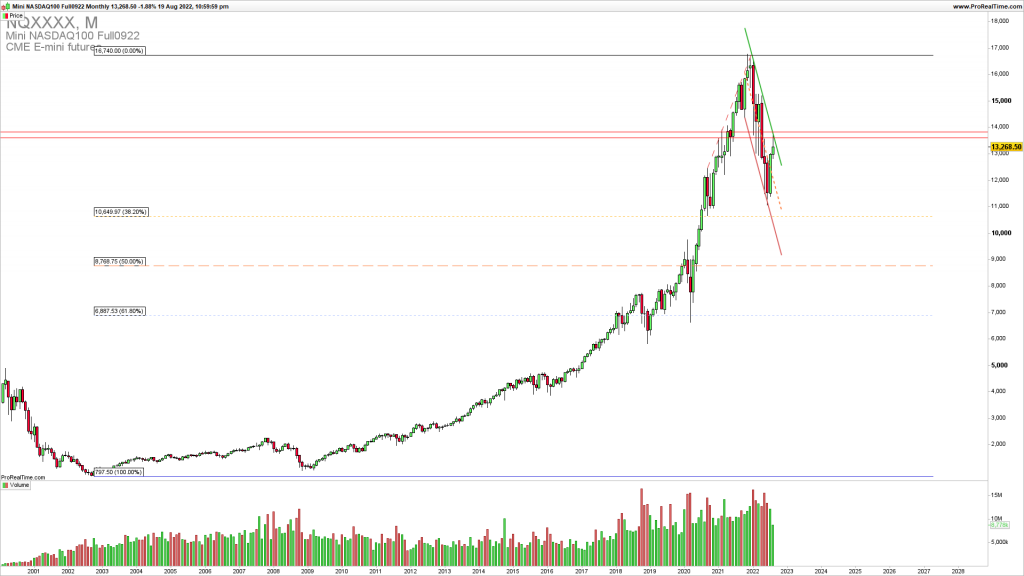
NASDAQ has been rejected from 13800
NASDAQ is being rejected by the strong upside resistance 13800. This is a downside channel resistance and a strong horizontal resistance. A break above 13800 again is required for the upside price action continuation.
 %
%
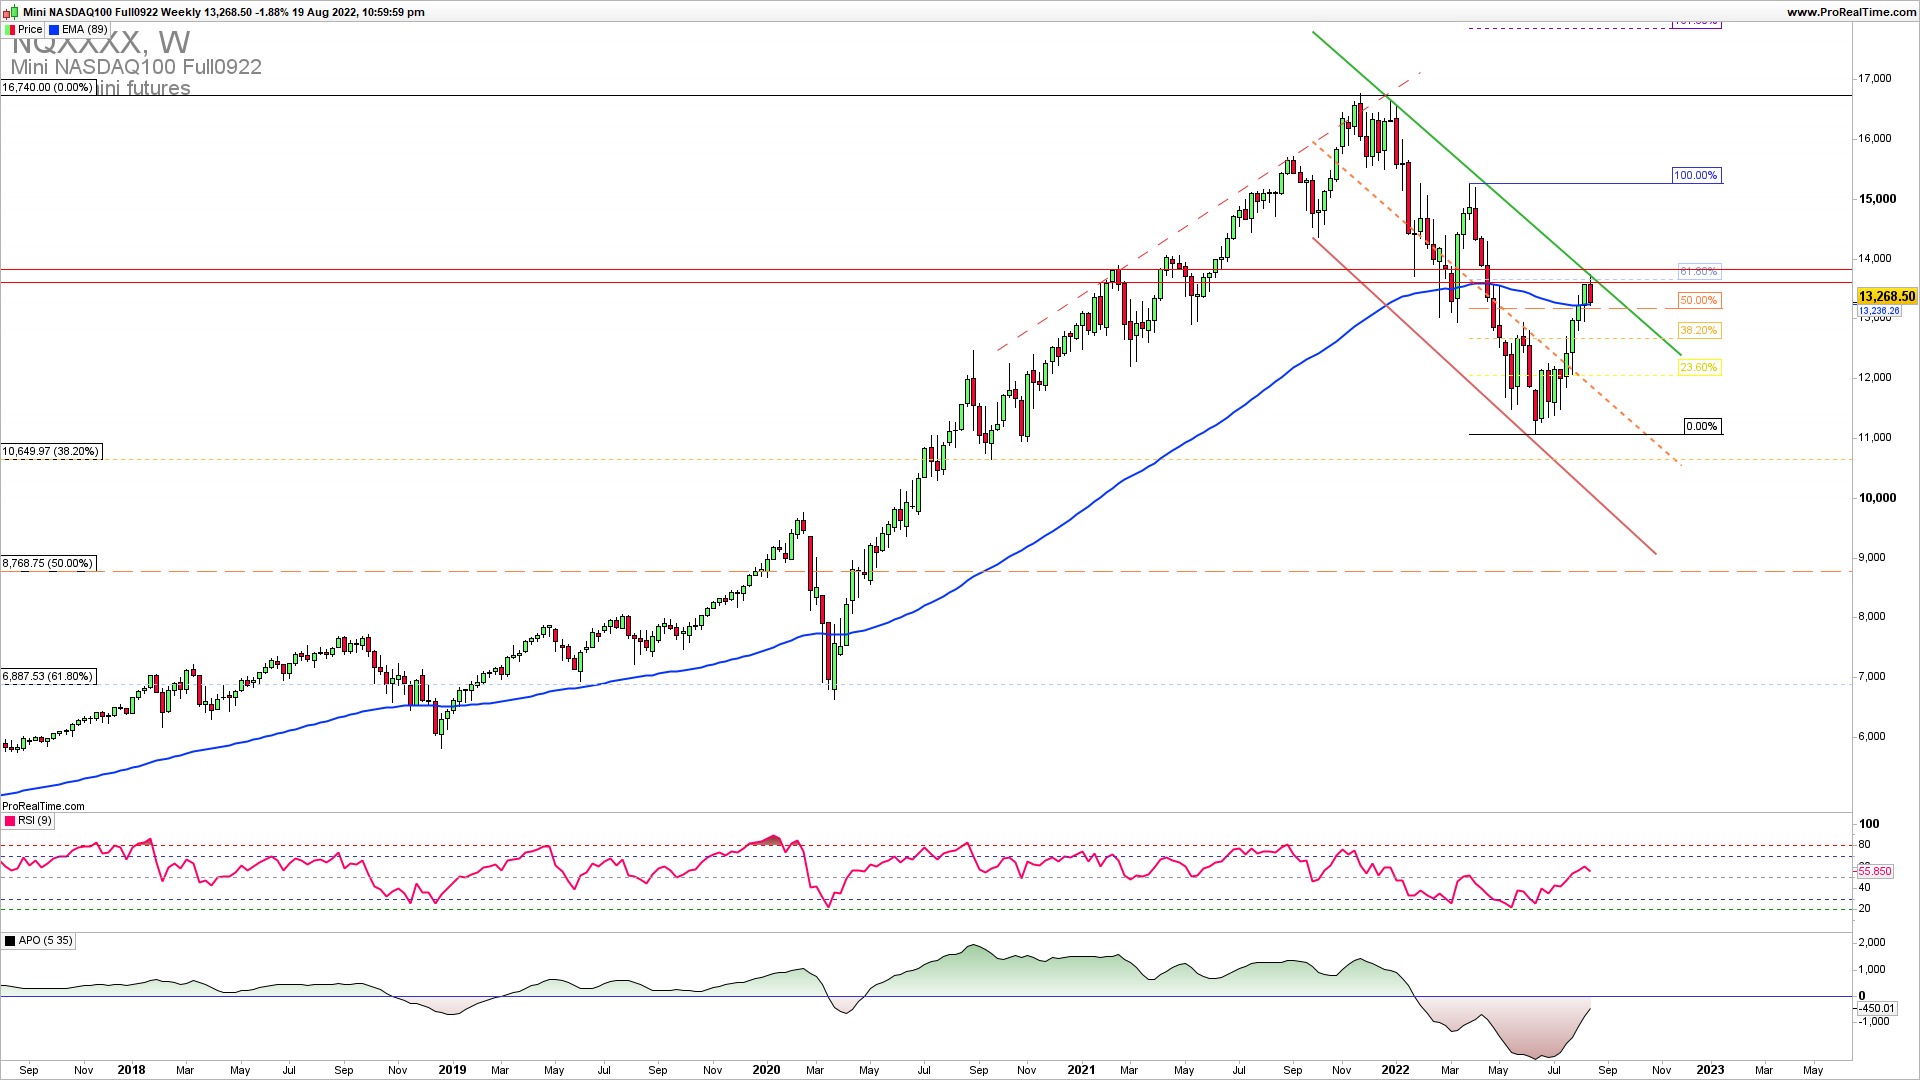
The weekly chart reveals a rejection of 61.8% Fibo retracement of the latest swing down. The weekly candle shadow and close below 13300 is indicating a potential strong reversal lower inside the downside channel for a continuation lower to the 9000-9500 zone.
JOIN TRADER’S CLASSROOM TO LEARN A PERFECT ENTRY AND EXIT TIMING IN ALL ASSET CLASSES
On a daily chart, we can see a good RR trade opportunity Already a member? This article is so good, it’s for premium members only.
Does that sound like you?
Go Premium to read full trading strategy with parameters of entry, stop loss, and exit. Why Premium?
We have used the combination of the top-down trading analysis to get these critical levels explained in the charts. Also, you can see Elliott Wave and price action analysis together in action along with the Andrews Pitchfork channel tool. If you want to learn the trading strategy that will give you immediate results in your trading register for Trader’s classroom.
