
Oil is breaking higher but we need confirmation
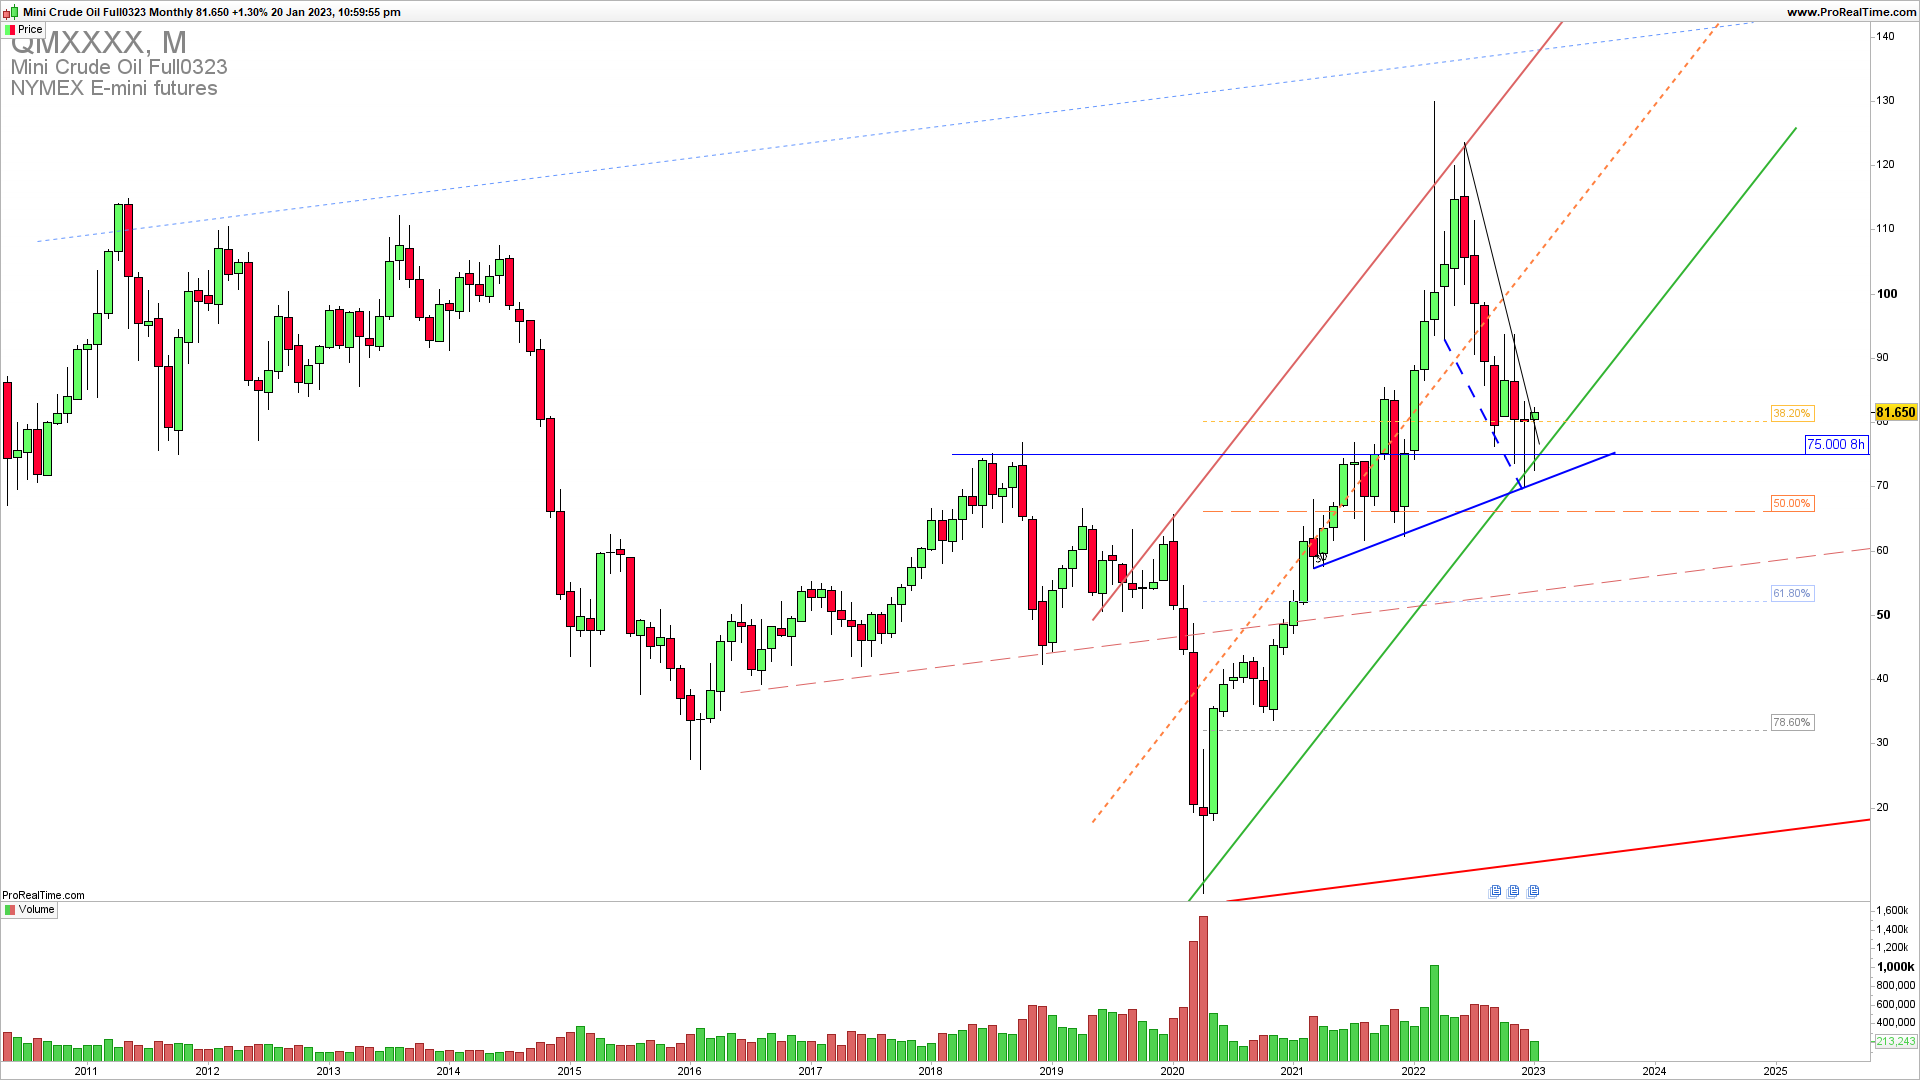
Oil is bouncing off the long-term trend channel bottom 75. Looking at the long-term monthly chart you can also see a long shadow candle form from this level and an extension higher above the falling wedge upside resistance 81.600. You can look higher from there to target the 95-100 zone on the upside. We are all aware now that 70 is the line in a send for an eventual reversal lower for this year.
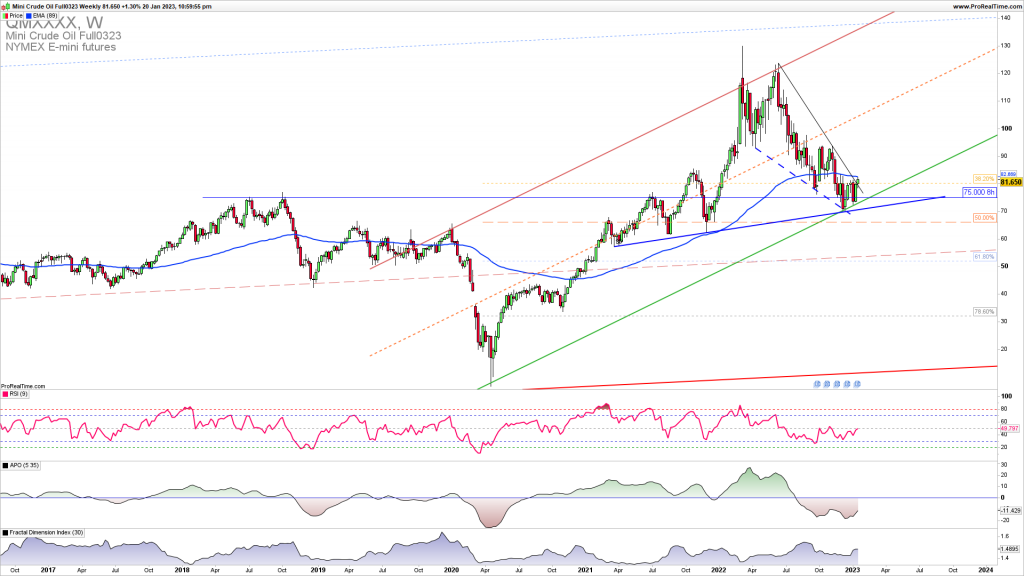
On the weekly chart, we can see this simple pure price action break above the falling wedge upside resistance. We now have important short-term resistance 82.600 test for a confirmation of the upside reversal above the rising wedge. The support of an upside extension is the 70-75 zone. A break above 82.600 is opening further upside continuation in the channel.

On the daily chart, we can see a good RR trade opportunity…
This article is so good, it's for premium members only.
Does that sound like you?
Go Premium to read full trading strategy with parameters of entry, stop loss, and exit. Why Premium?
Already a member?
TRADE FOREX, INDICES, AND COMMODITIES WITH A FUNDED TRADER ACCOUNT!
Take a break from your trading routine Copy our trades!
