

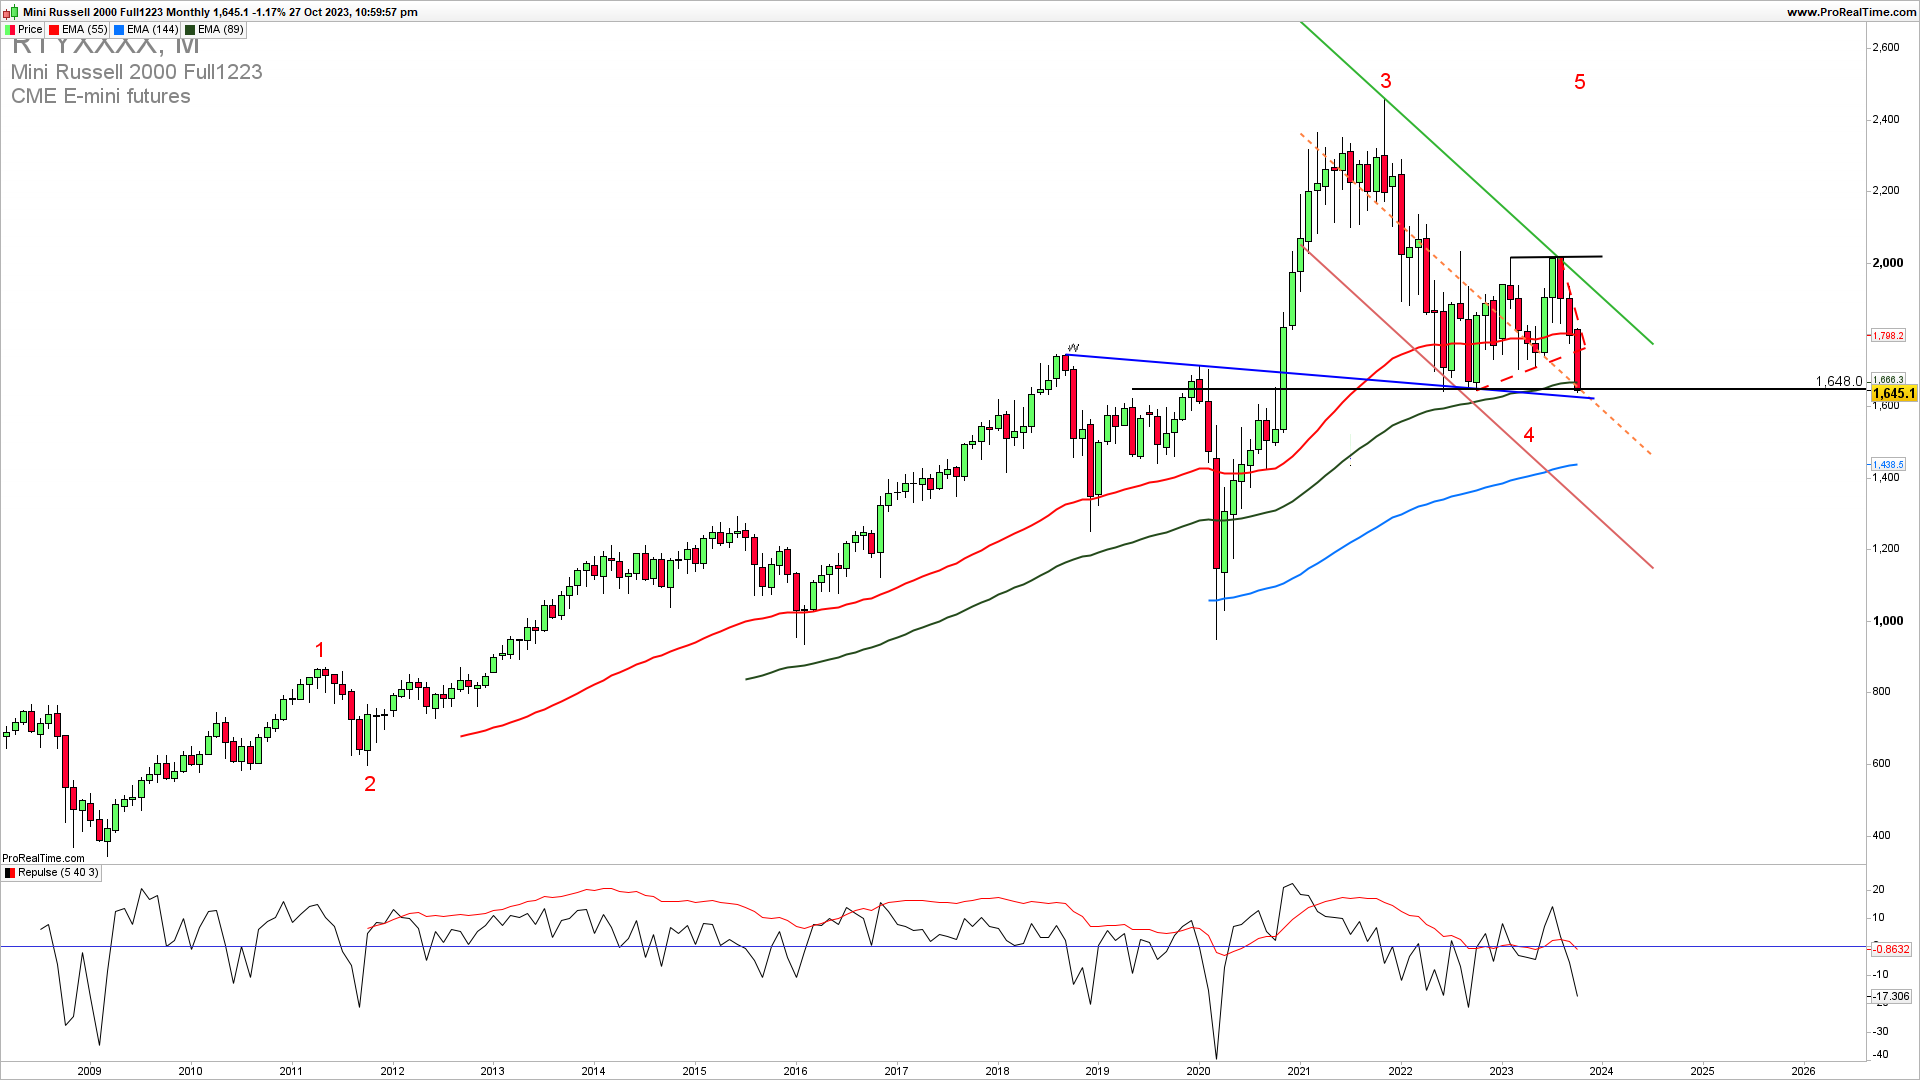
RUSSELL2000 is showing a continued upward trend long-term. The monthly chart shows that Russell2000 is testing a strong support of 1648. On the chart, you can see this month’s strong ongoing pullback from 1800 and a hold of that pullback should be strong at this swing bottom 1648 level if the uptrend should continue. A break below 1640 will tend to invalidate the upside extension in the measured fifth wave long-term.
SPECIAL AUTUMN OFFER MENTORING WITH PORTFOLIO OPTIMIZATION $300
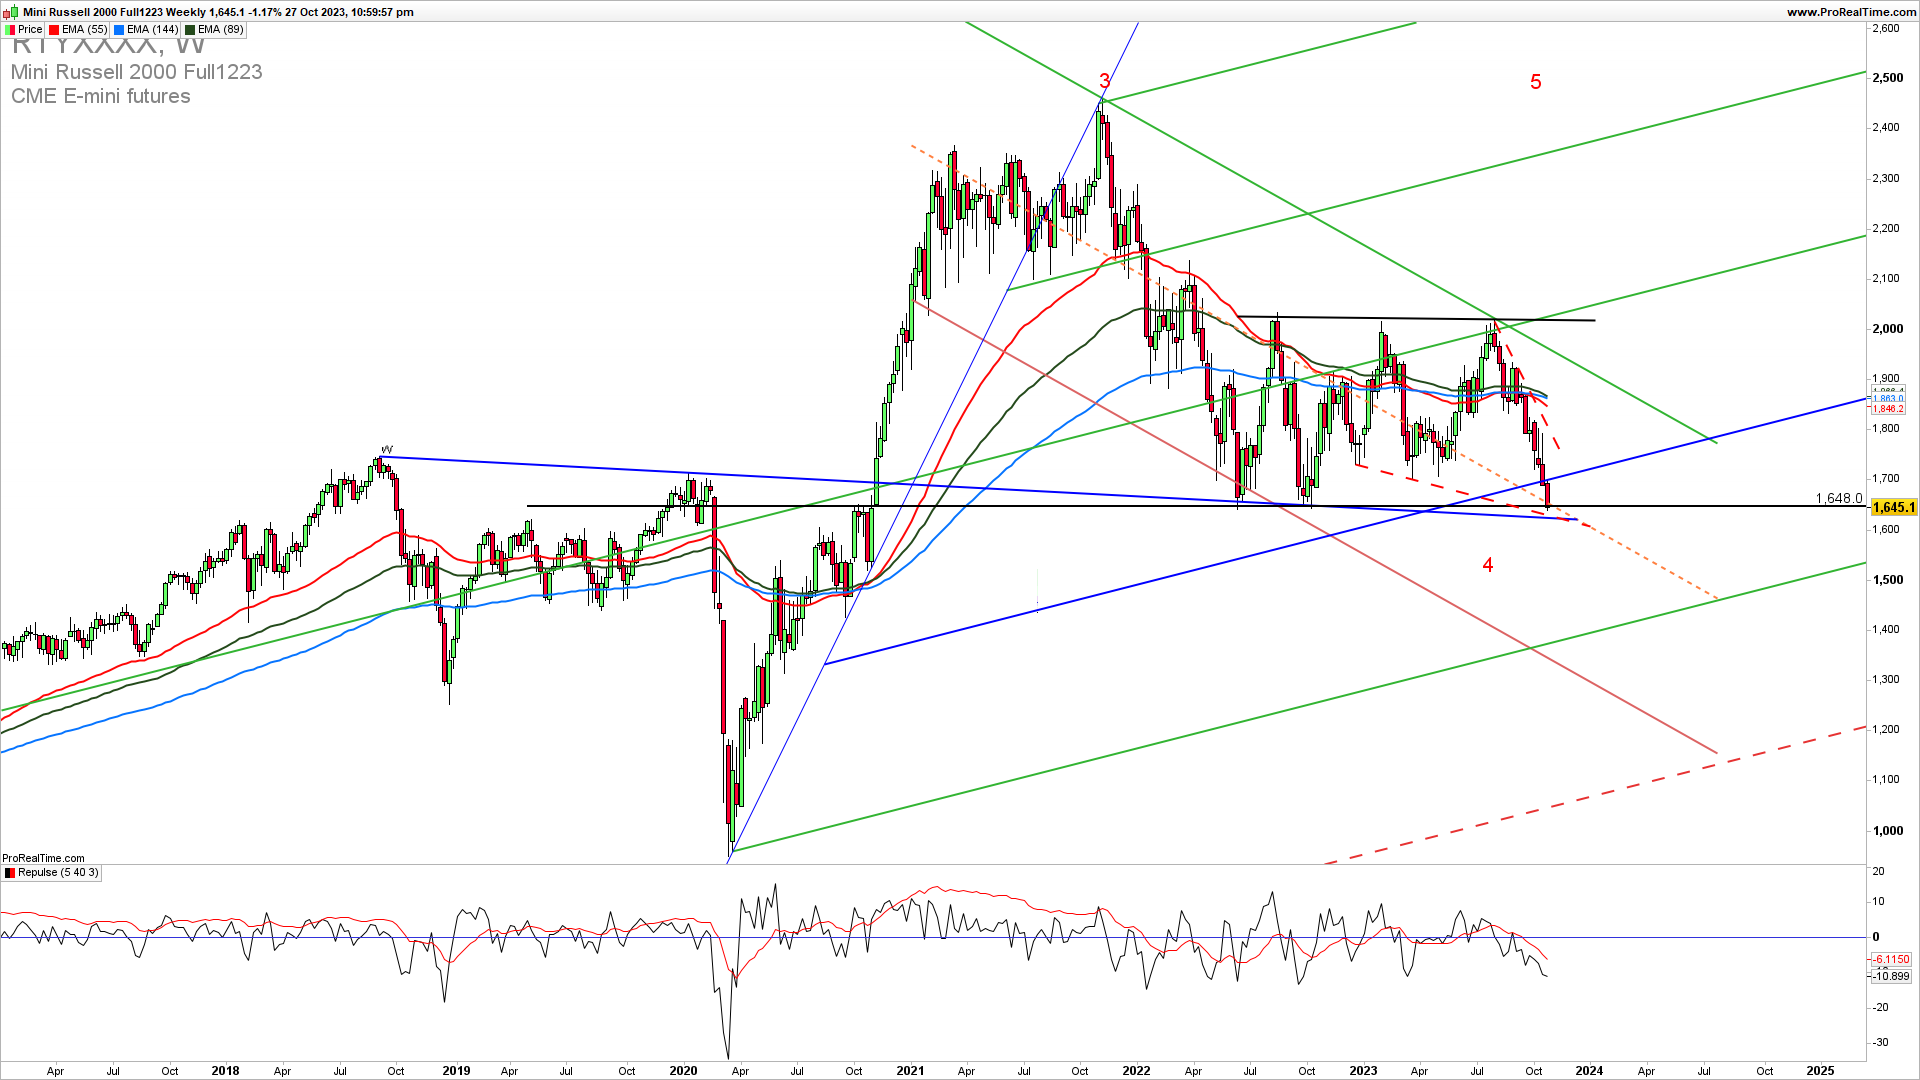
The Weekly Russell2000 chart reveals the ongoing broadening wedge and a confluence of the support at the 1640-1650 zone. A break below 1640 is required to invalidate the upside extension and deny the fifth wave continuation higher, and we are seeing a test of the broadening wedge line. It is advisable to position yourself in just one trade direction and not to try to catch every swing. We need to see a bounce off this zone to extend higher. If we get a bounce this will be a perfect long trade opportunity.
GET THE CHART OF THE DAY EVERY DAY IN YOUR INBOX
START TRADING WITH OUR RECOMMENDED BROKER ULTIMA

As the famous trader says…
“If you can’t take a small loss, sooner or later you will take the mother of all losses.”Ed Seykota
How to trade this?
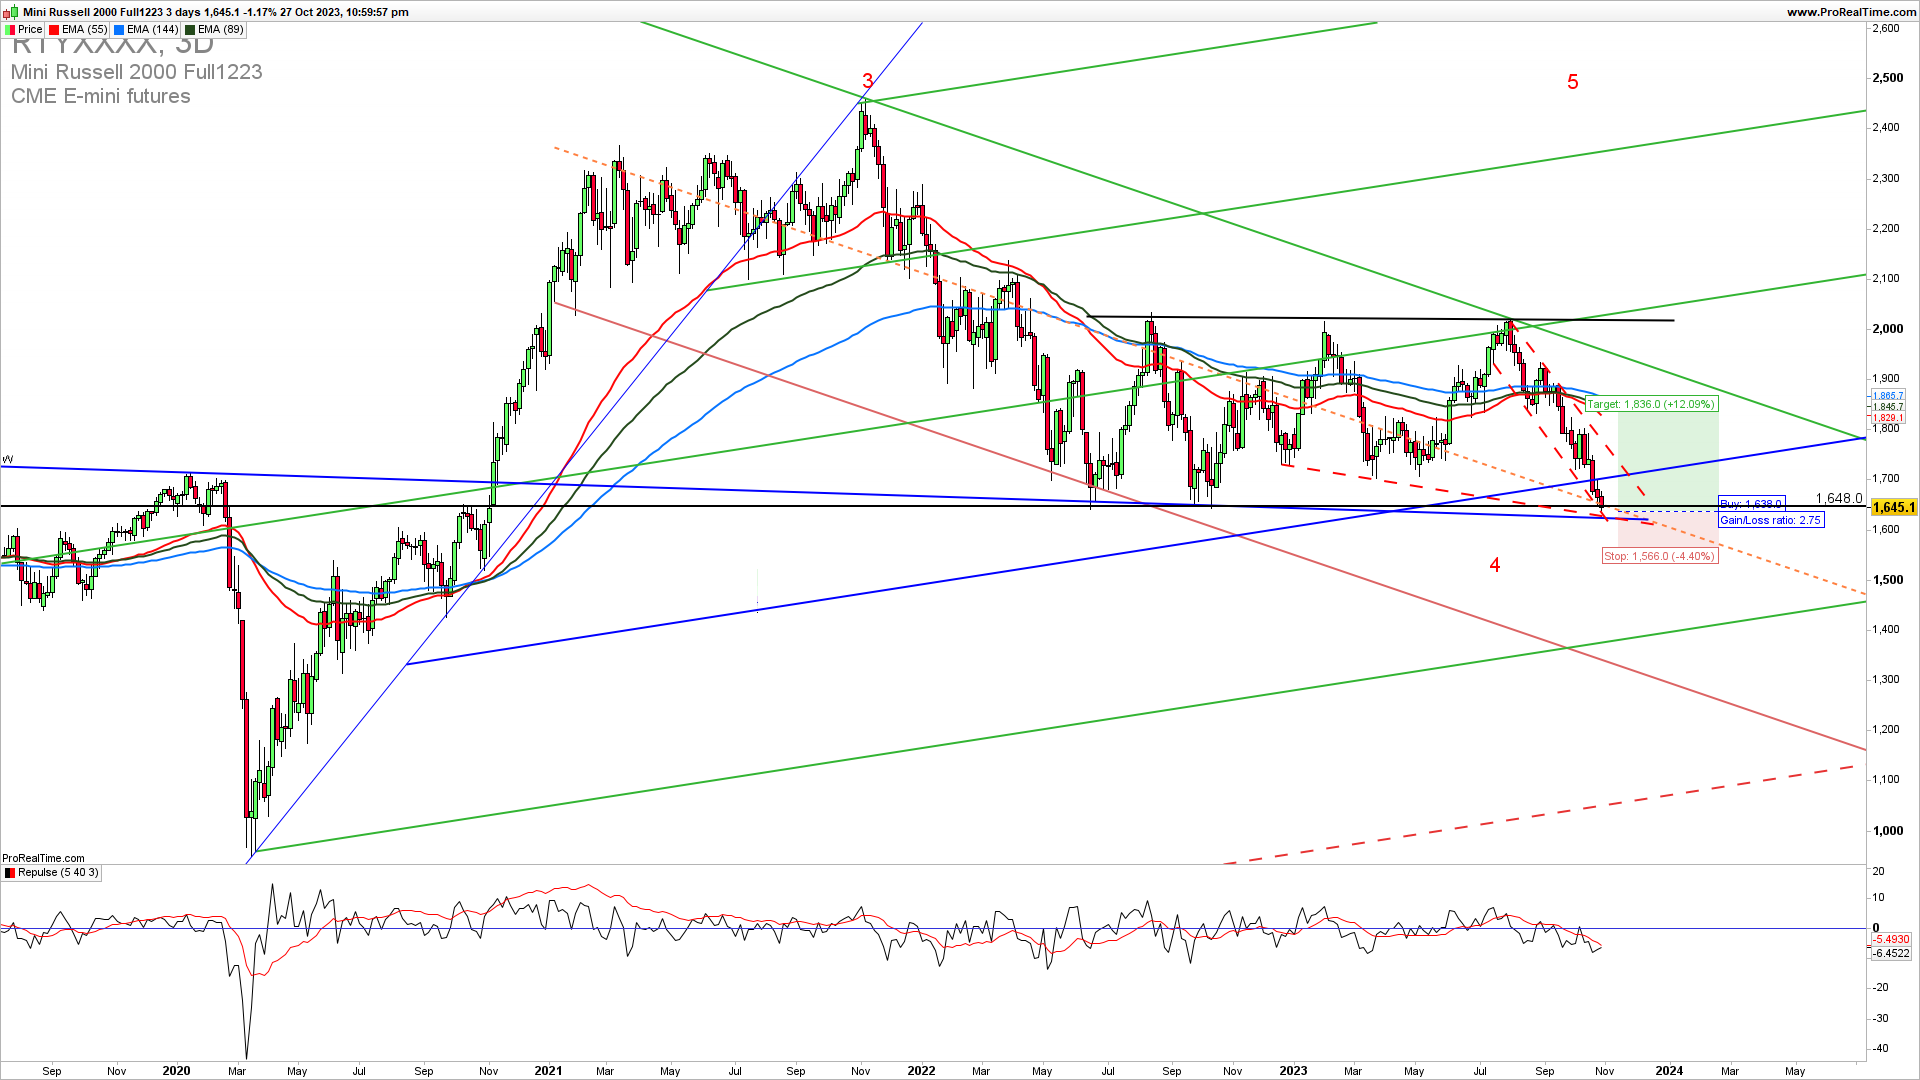
It is a fact that a strong upside support for Q4 is 1600. If we get a confirmed bounce from here and a break above the 1700 we could see an extension higher to 1800 again. Near-term, long-trade entries have a higher probability of success. We can open the long trade here with a bit of risk and stop the loss below 1640. You can trade this price action with the options as well.
TRADE AAPL WITH CHALLENGE ACCOUNT AND GET FUNDED