
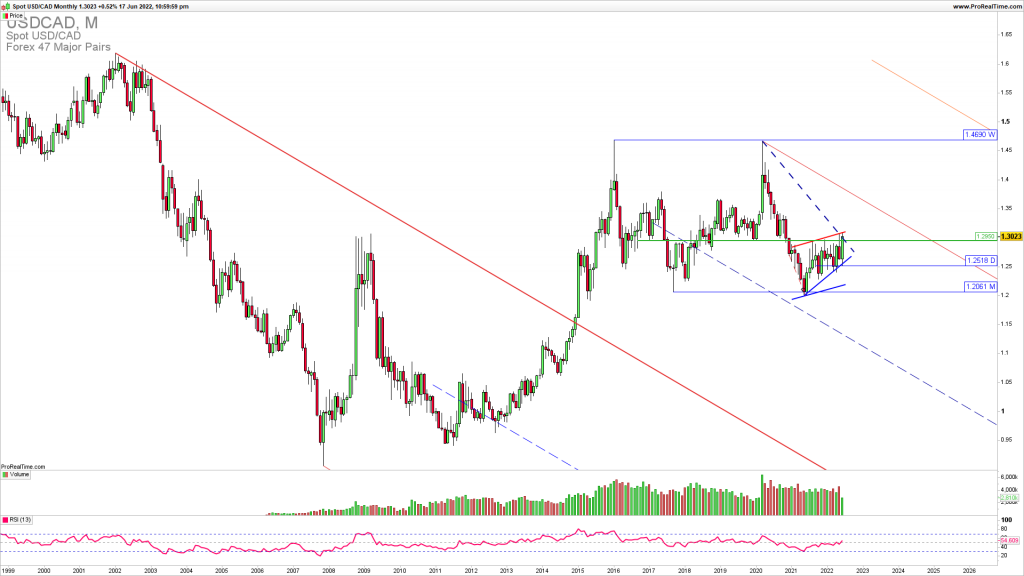
USDCAD is challenging 1.3000
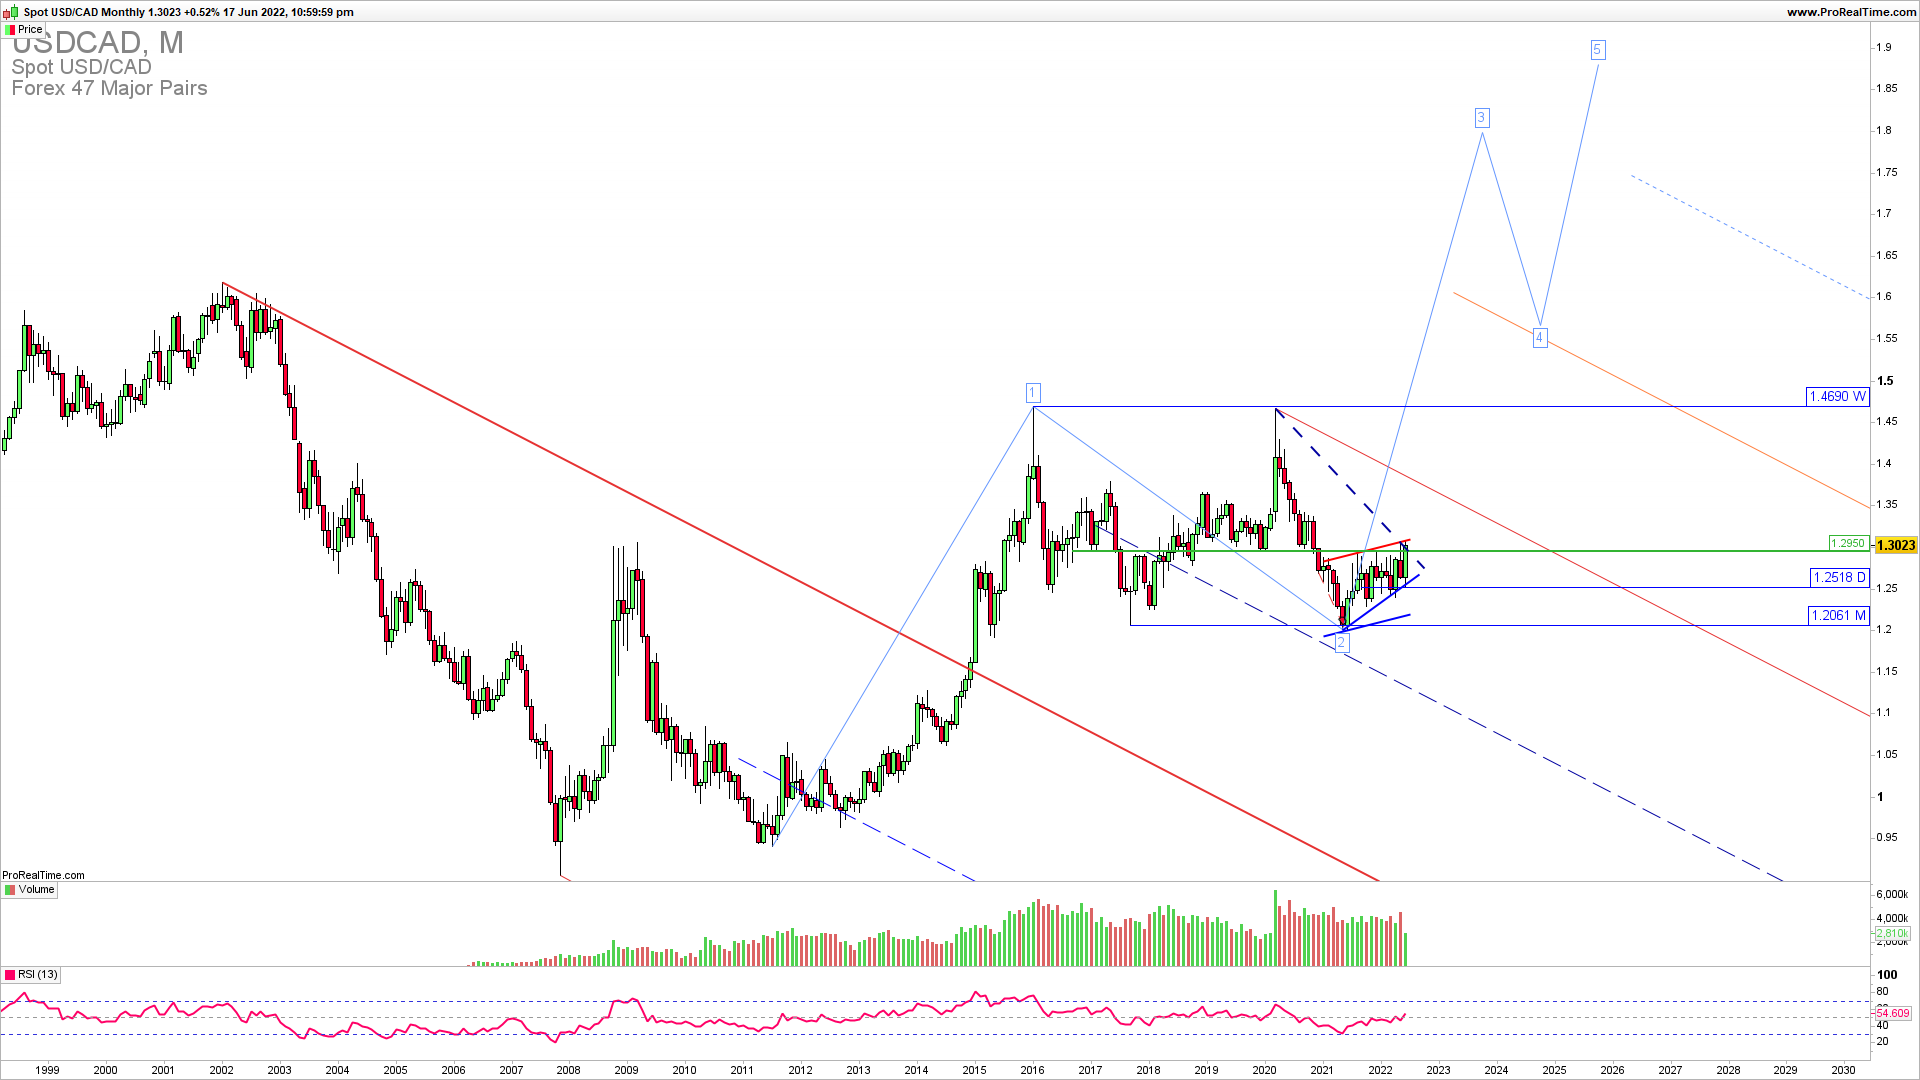
USDCAD is testing the strong upside resistance. This also represents the possible beginning of the impulsive powerful long-term third wave of the five waves higher that could lead long-term above 1.4690.
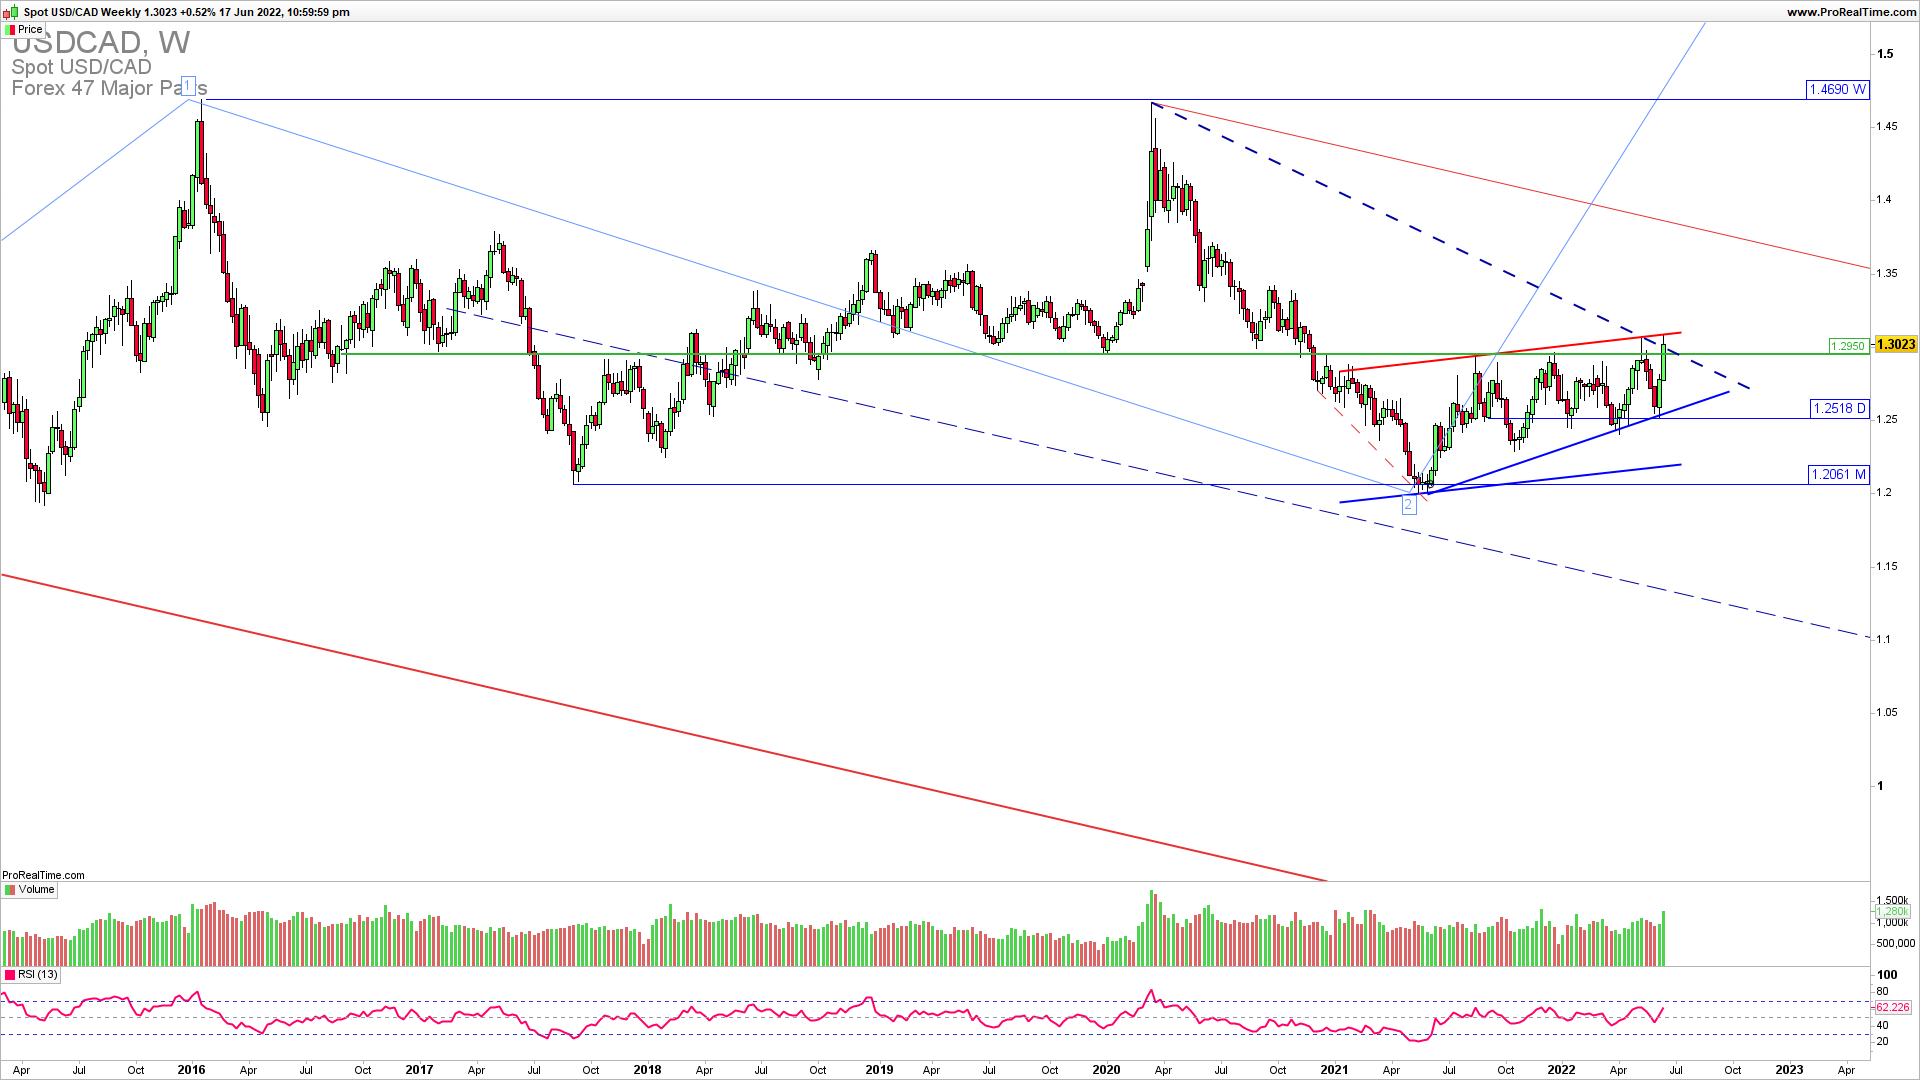
The weekly chart reveals a rising wedge and ascending triangle with the 1.3000 resistance. Break above this resistance should be confirmed for the upside continuation to accelerate and be confirmed. The support now is 1.2900-1.2950.
JOIN TRADER’S CLASSROOM TO LEARN A PERFECT ENTRY AND EXIT TIMING IN ALL ASSET CLASSES
On a daily chart, we can see a good RR trade opportunity Already a member? This article is so good, it’s for premium members only.
Does that sound like you?
Go Premium to read full trading strategy with parameters of entry, stop loss, and exit. Why Premium?
We have used the combination of the top-down trading analysis to get these critical levels explained in the charts. Also, you can see Elliott Wave and price action analysis together in action along with the Andrews Pitchfork channel tool. If you want to learn the trading strategy that will give you immediate results in your trading register for Trader’s classroom.
