
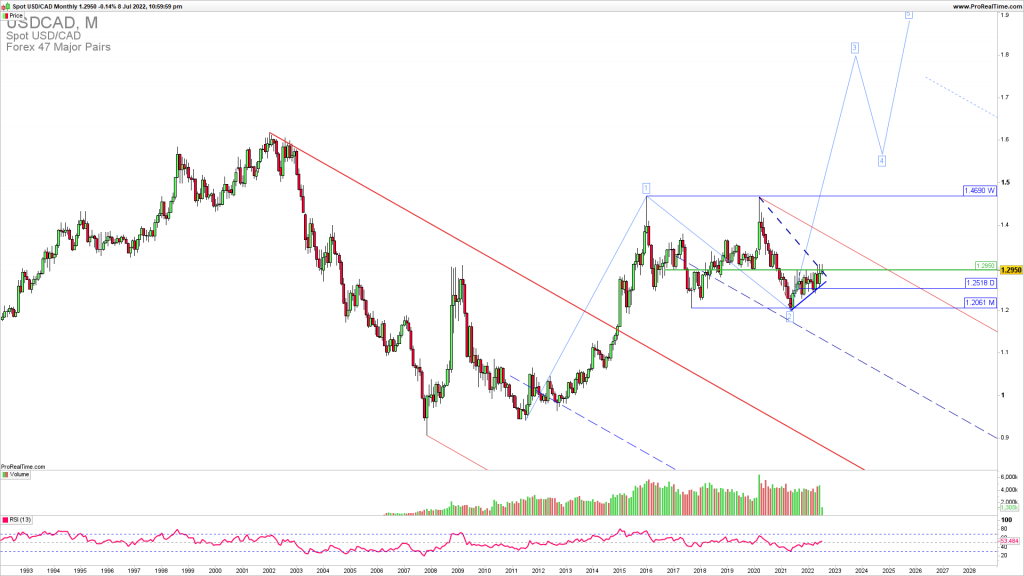
USDCAD is breaking higher
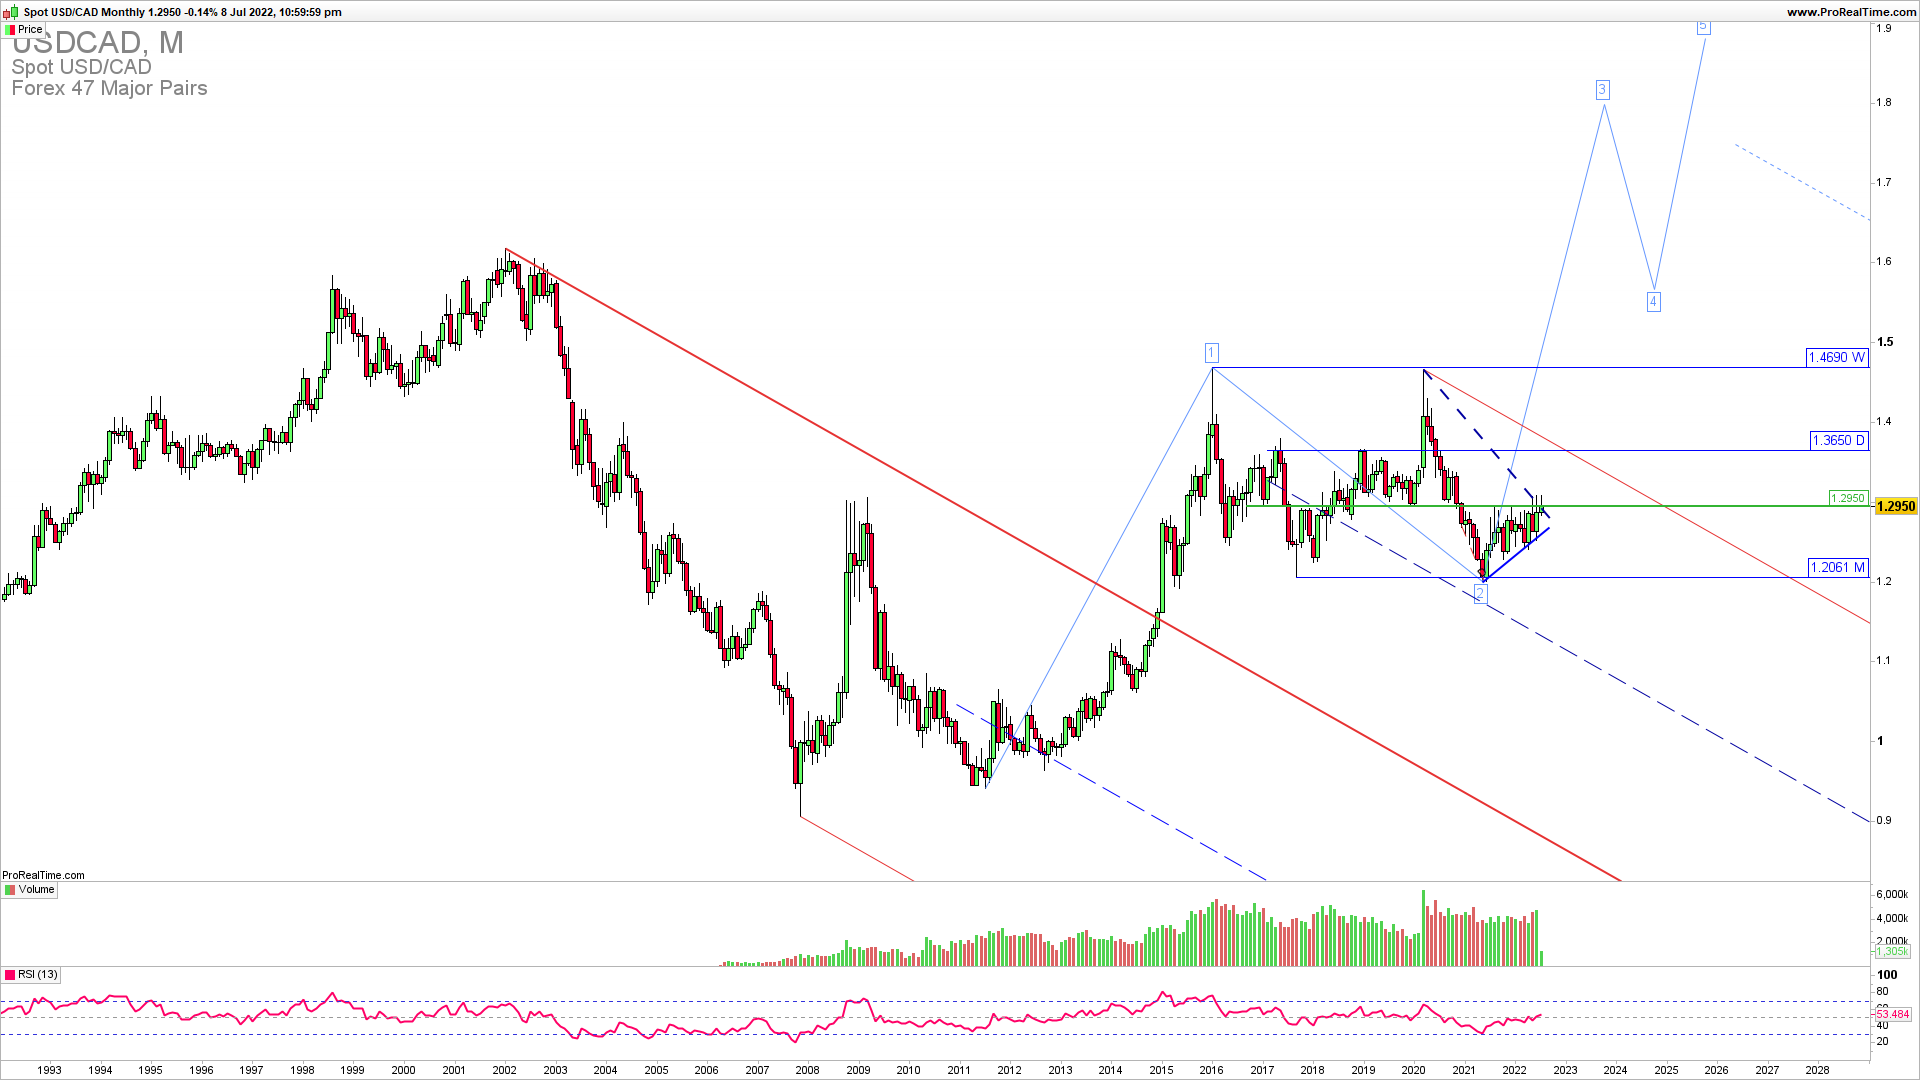
USDCAD is breaking higher from a strong ascending triangle long-term formation. 1.2950 is the long-term uptrend line resistance being tested again after the series of higher lows on the monthly chart. A break above this level could lead to an accelerated reversal higher for a 1.3650 test.
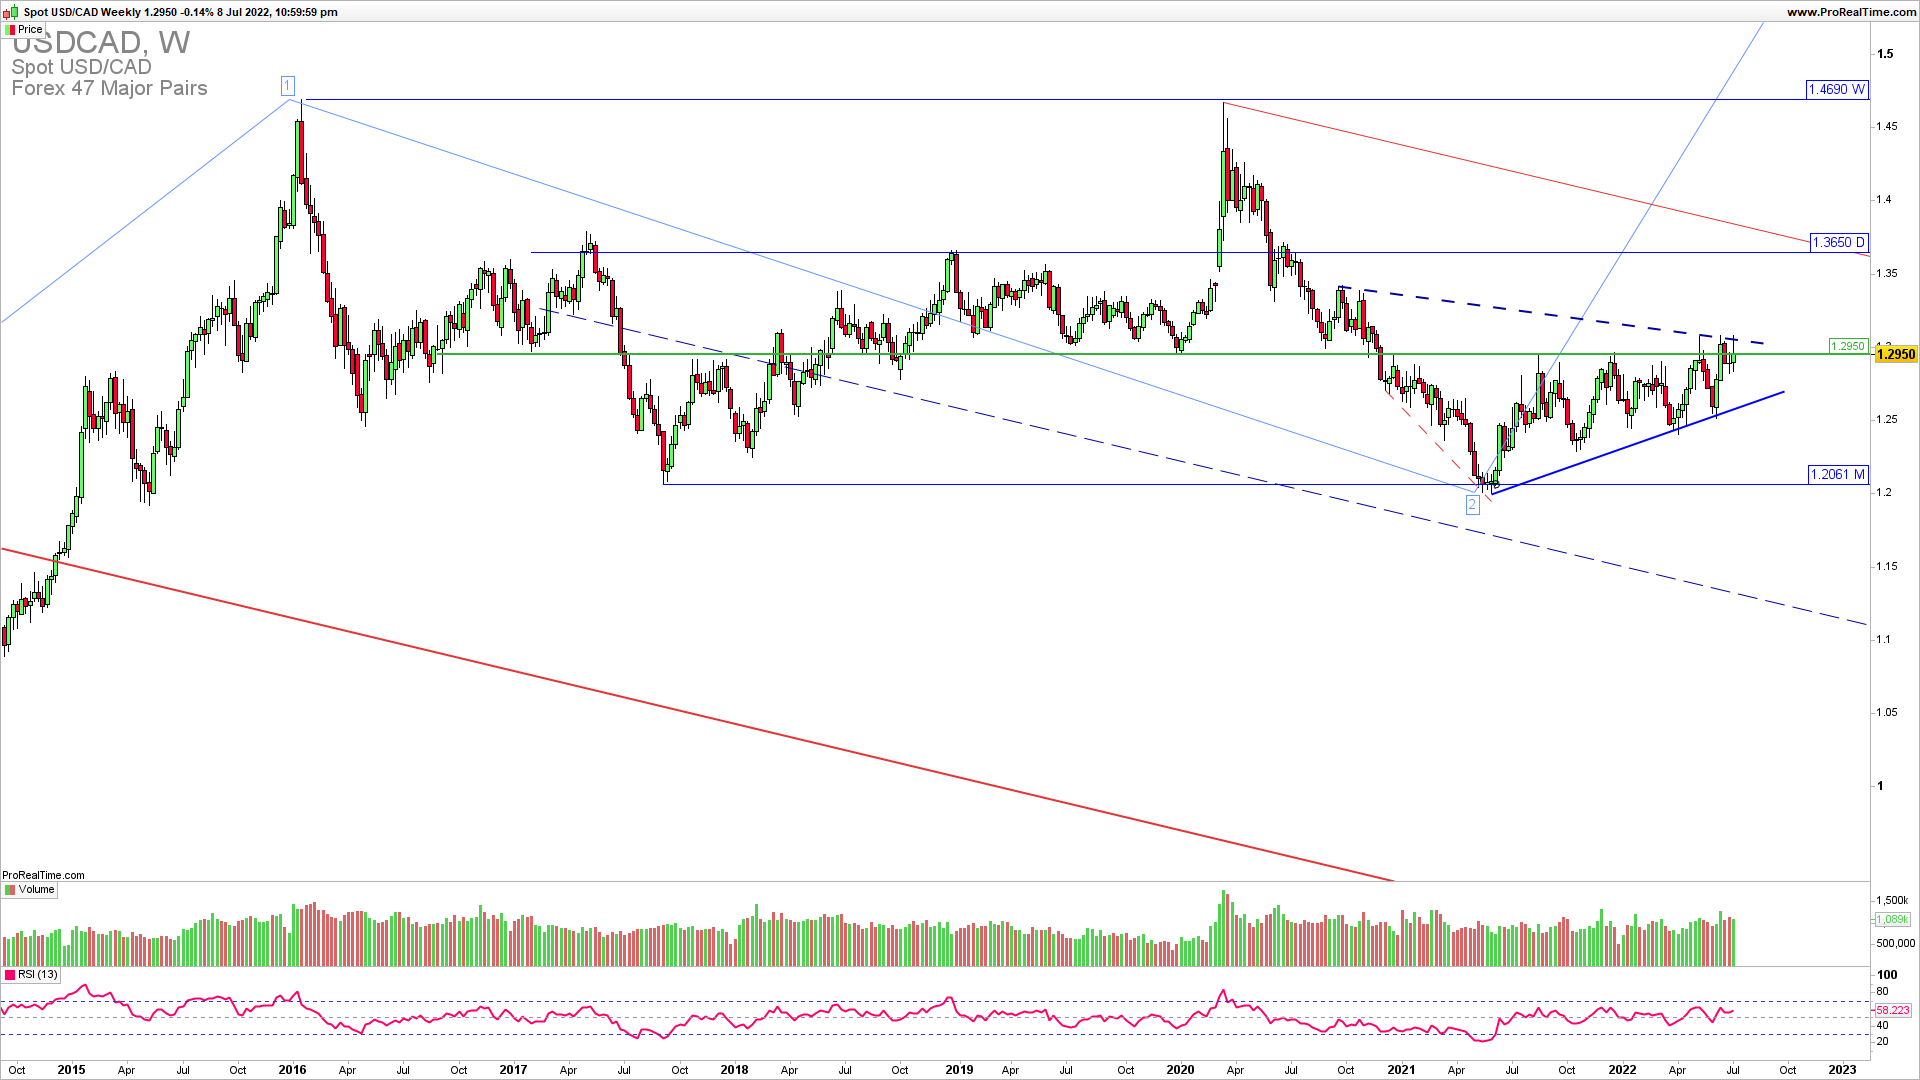
The weekly chart reveals a falling trend line being challenged, along with 1.2950 ascending triangle resistance which was previously tested at least four times. This time price action is squeezed and is looking for a big breakout higher which would take the pair higher in the third wave targeting 1.4000.
JOIN TRADER’S CLASSROOM TO LEARN A PERFECT ENTRY AND EXIT TIMING IN ALL ASSET CLASSES
On a daily chart, we can see a good RR trade opportunity Already a member? This article is so good, it’s for premium members only.
Does that sound like you?
Go Premium to read full trading strategy with parameters of entry, stop loss, and exit. Why Premium?
We have used the combination of the top-down trading analysis to get these critical levels explained in the charts. Also, you can see Elliott Wave and price action analysis together in action along with the Andrews Pitchfork channel tool. If you want to learn the trading strategy that will give you immediate results in your trading register for Trader’s classroom.
