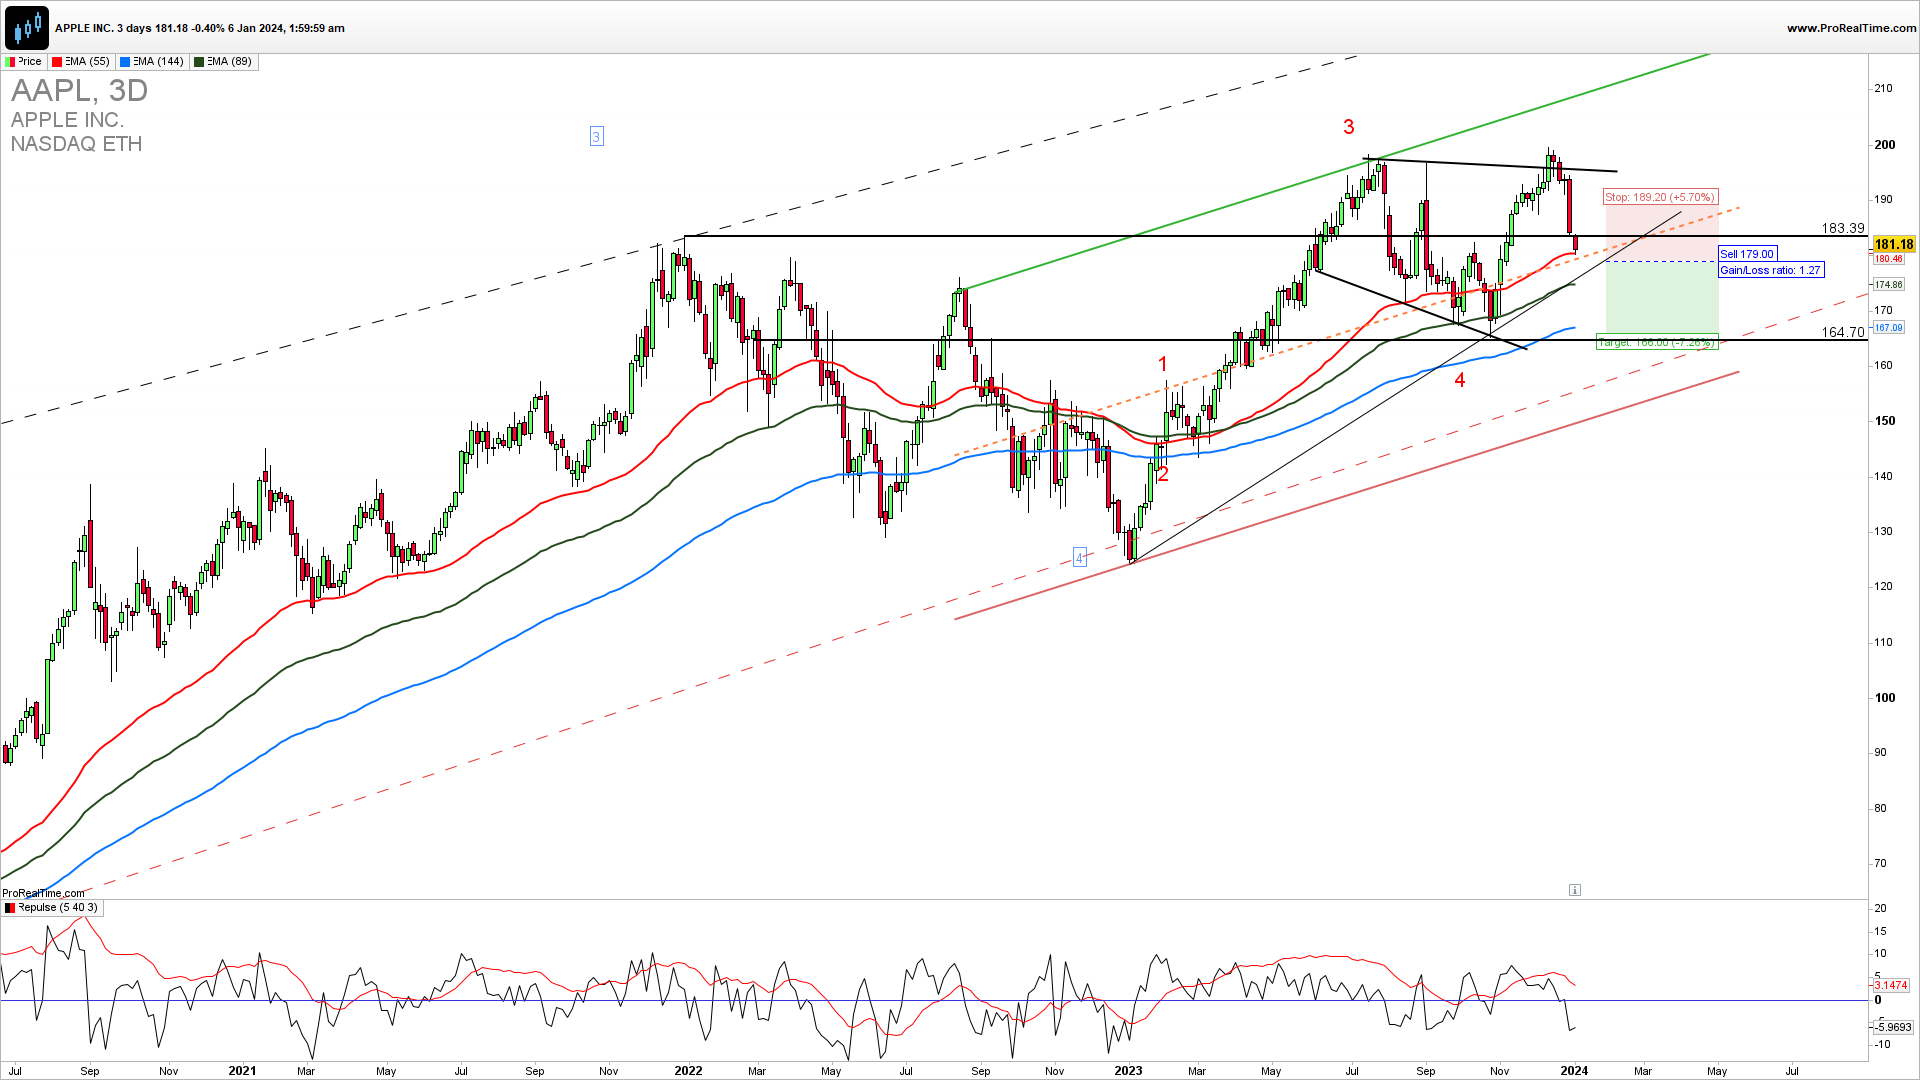
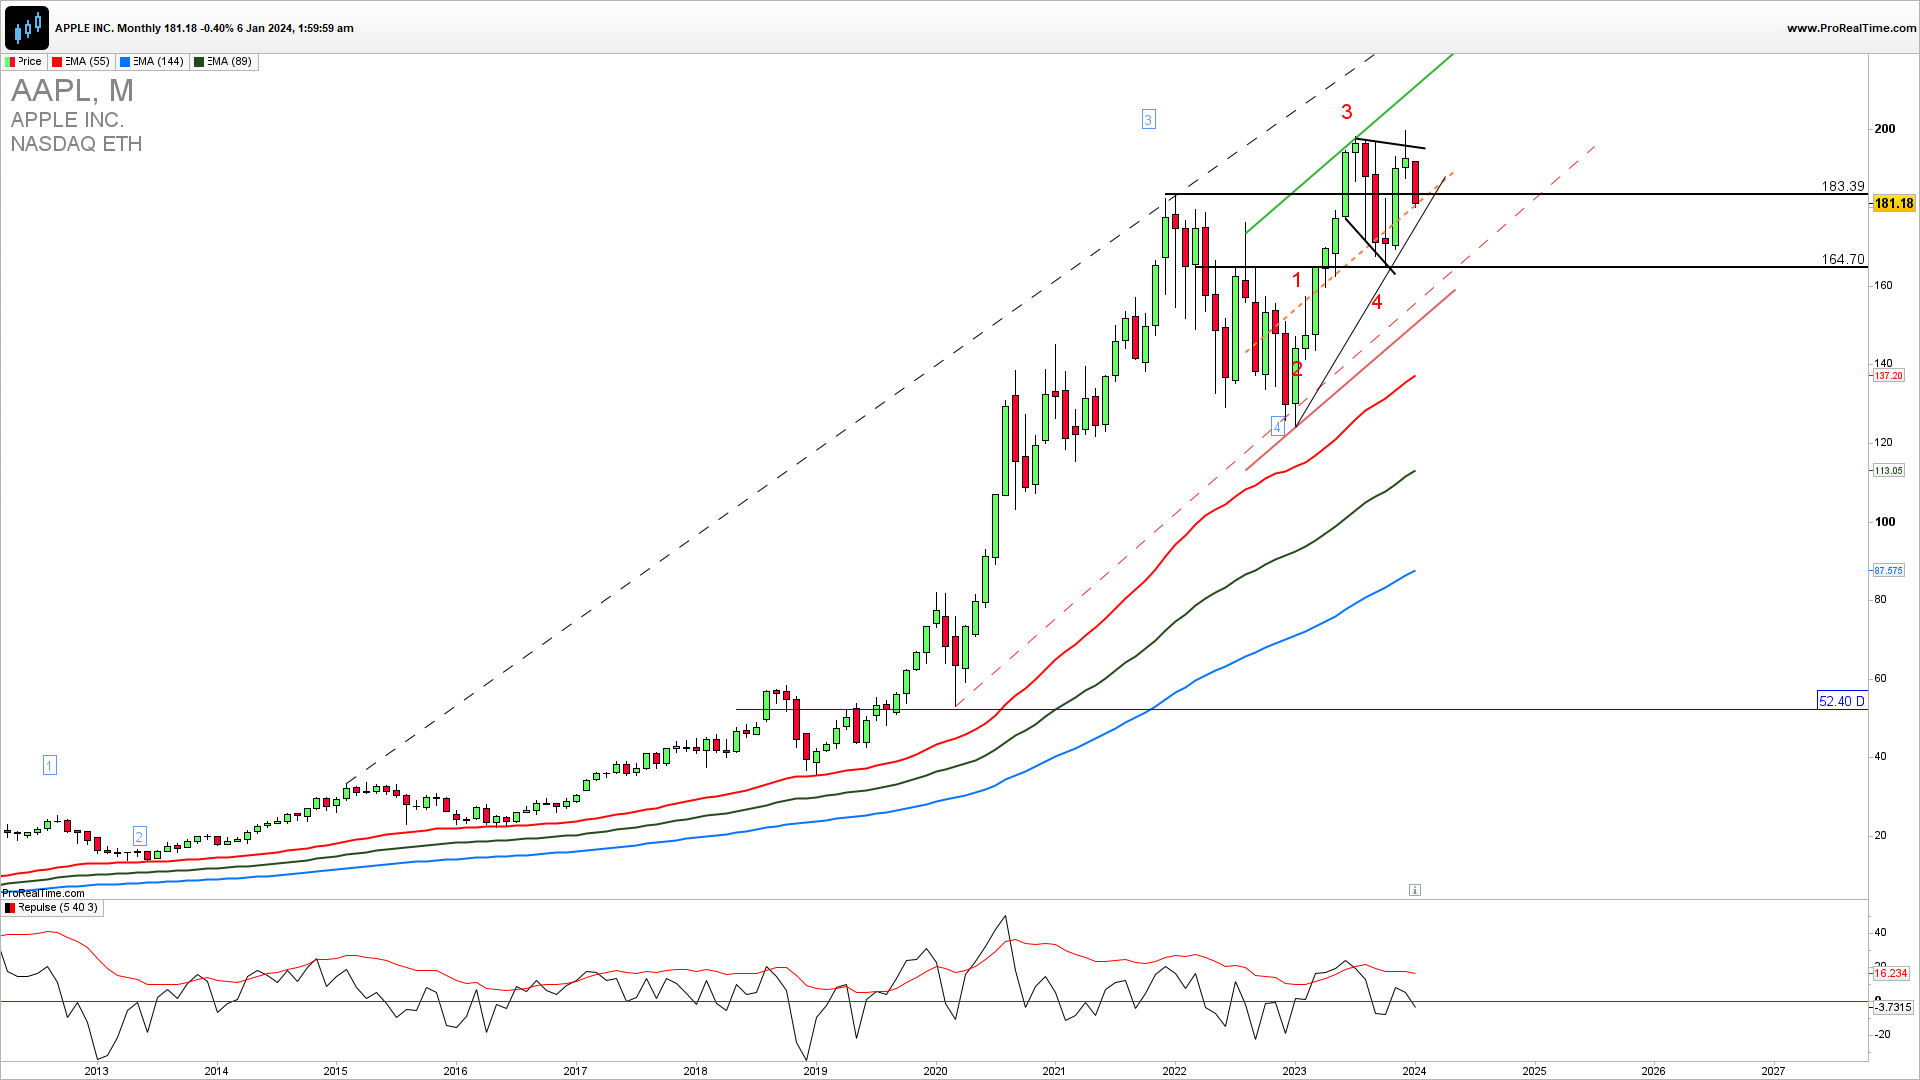
AAPL has reached a new high of 200 and is pulling back. A break above this resistance will open a new strong bullish cycle. Still, we are seeing a terminal phase of the long-term and long-term and short-term Elliott Waves in the consolidation rising wedge which is not giving us a bullish expression. A break below 185 again is calling for a bigger pullback to 165 a key support for the bullish continuation.
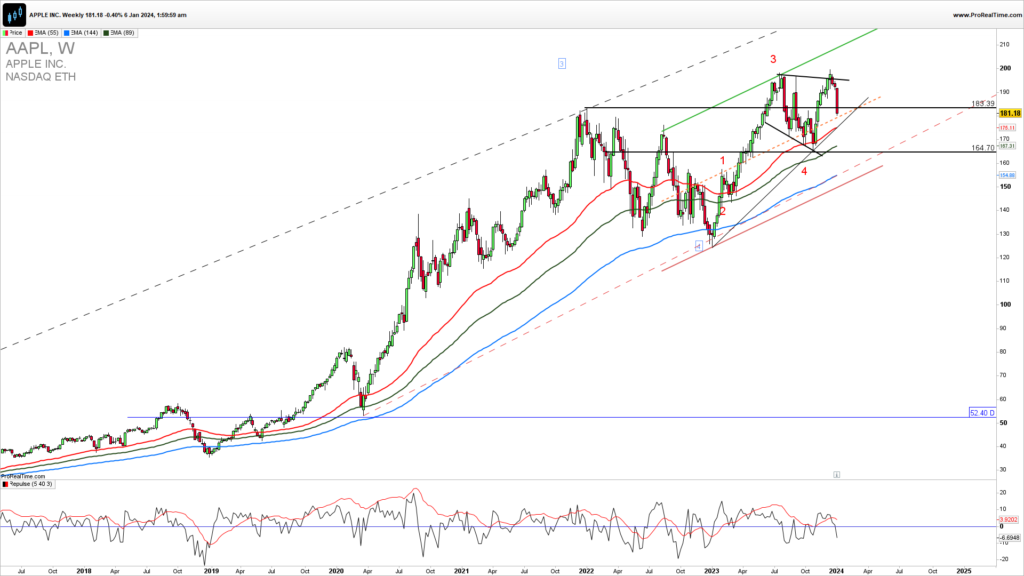
The Weekly AAPL chart reveals the rising price action wedge, a test of its upside resistance, and an already-mentioned key l85 support that was broken to the downside. A break below 175 is required to invalidate the immediate upside extension and will mark the fifth wave short-term finished especially in the case of a break below 165.
GET THE CHART OF THE DAY EVERY DAY IN YOUR INBOX
As the famous trader says…
“Limit your size in any position so that fear does not become the prevailing instinct guiding your judgment.”JOE VIDICH
How to trade this?
It is a fact that a strong upside resistance for Q1 2024 is 200. If we get a confirmed break here we could see a strong upside continuation and new highs. Near-term, short-trade entries have a higher probability of success but for the conservative traders upon a break below 165. Long trade entries are also possible but only on a price action confirmed break above 200. You can try a short trade here with a stop loss above 185. For inquiries about account management please write to [email protected].