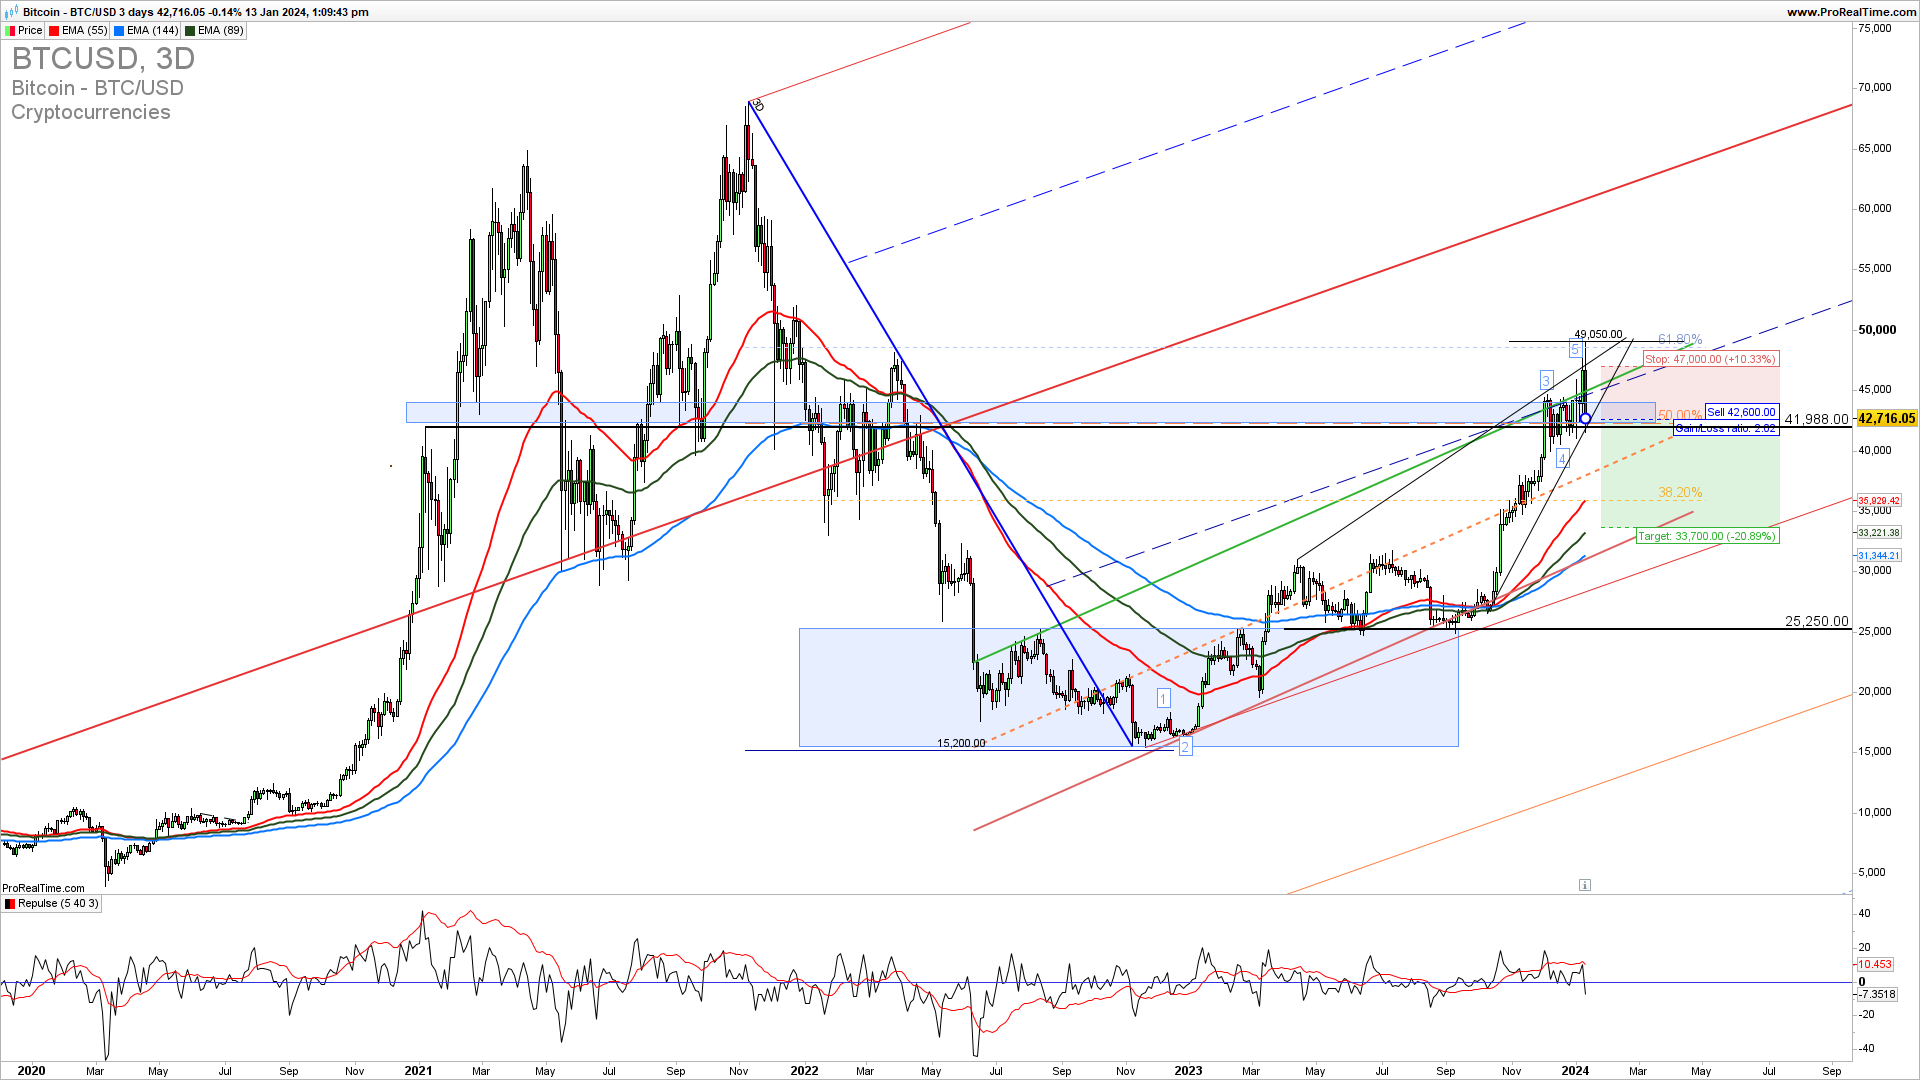
Bitcoin has reached a new high of 49000 and is pulling back. A break above this resistance will open a new strong bullish cycle. Still, we are seeing a terminal phase of the short-term five Elliott upside Waves in the consolidation rising wedge which is not giving us a bullish expression and is also confluences with a 61.8% Fibonacci retracement of the 2021-2023 swing down. A break below 41600 again calls for a bigger pullback to 35000 a key support for the bullish continuation.
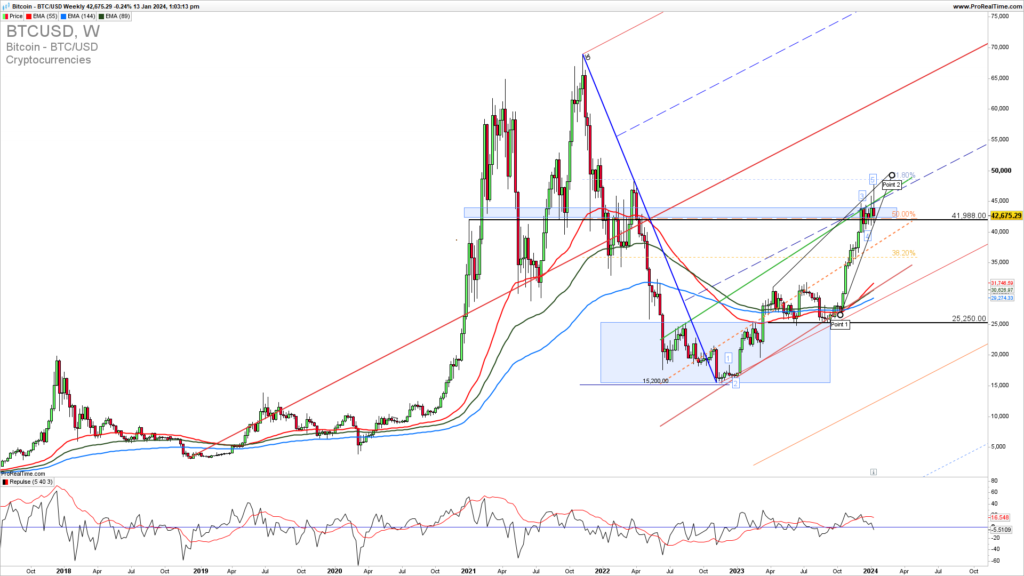
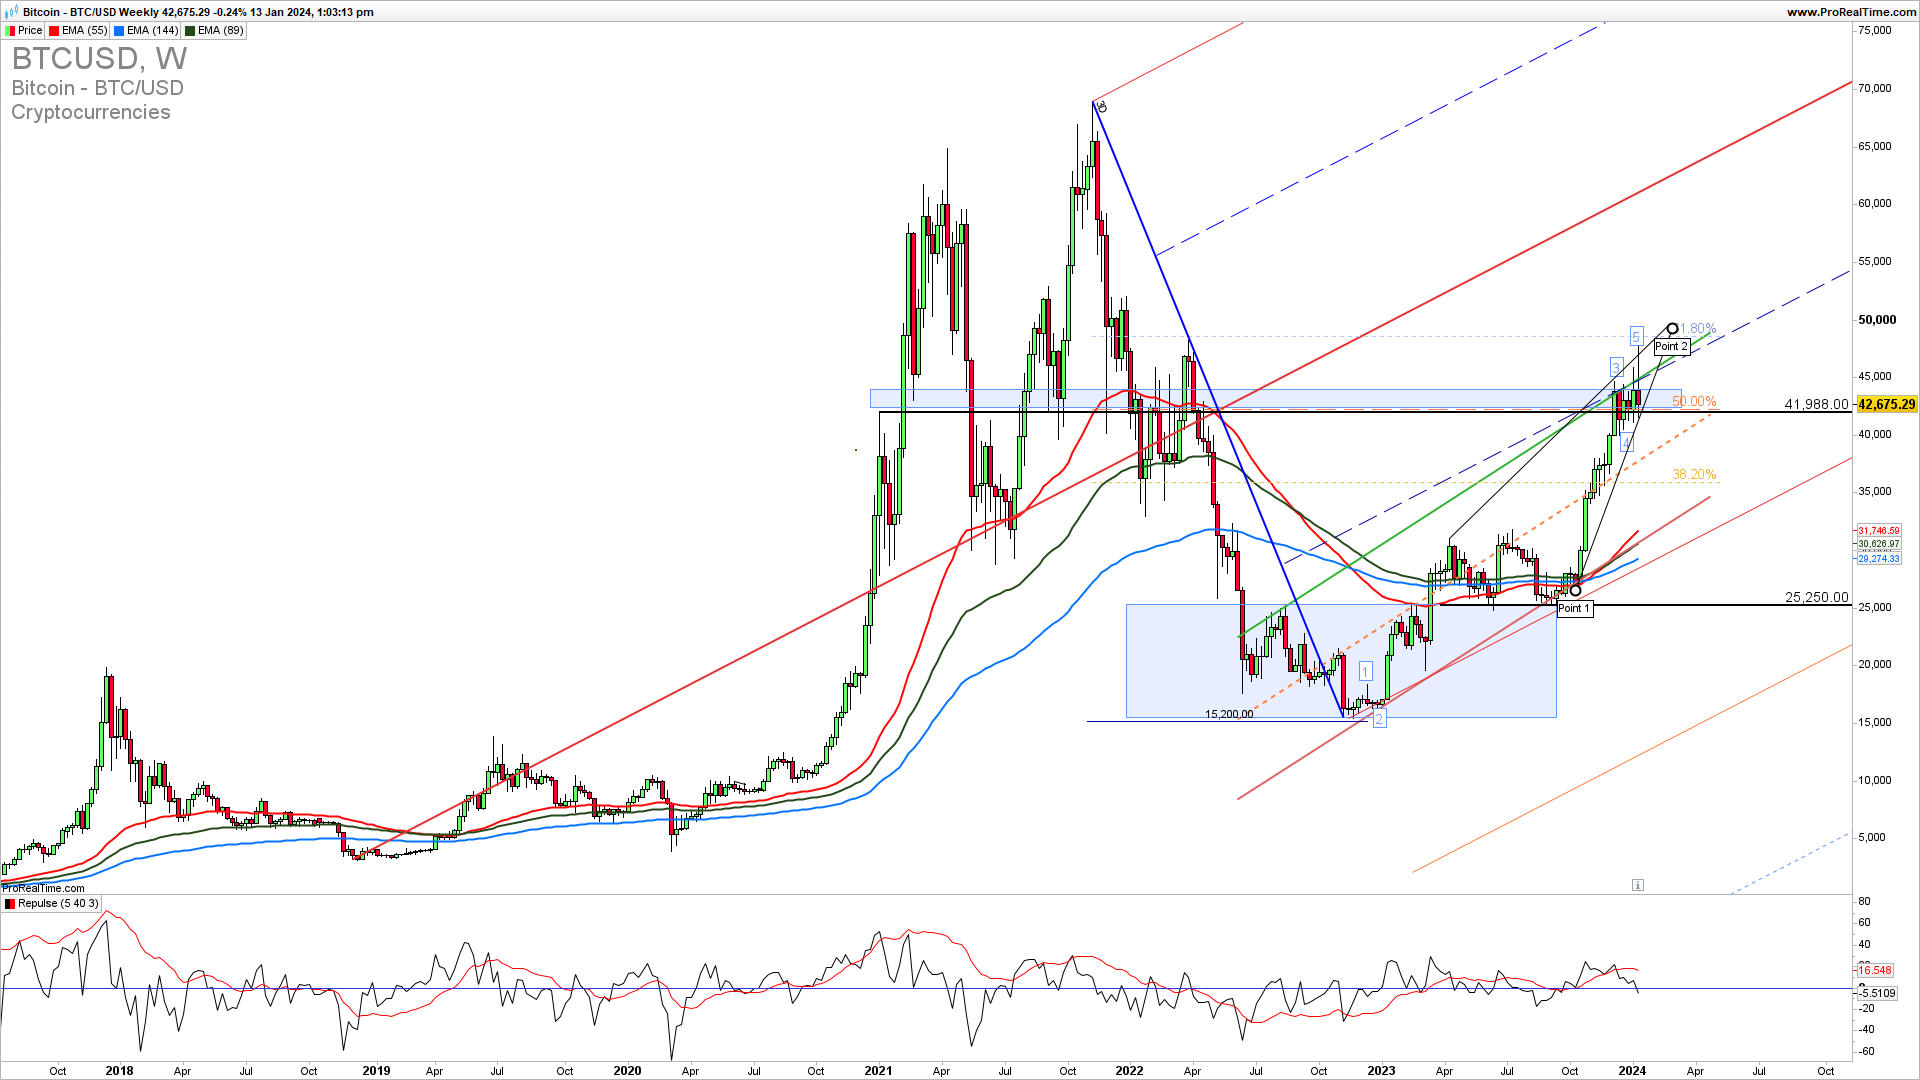
The Weekly Bitcoin chart reveals the rising price action wedge, a test of its upside resistance, and an already-mentioned key 41500 support is being tested. A break below this level is required to invalidate the immediate upside extension and will mark the fifth wave short-term finished especially in the case of a break below 40000. For an upside continuation we need to see a breakout above 48000.
GET THE CHART OF THE DAY EVERY DAY IN YOUR INBOX
As the famous trader says…
“Wide diversification is only required when investors do not understand what they are doing.”Warren Buffett
How to trade this?
It is a fact that a strong upside resistance for Q1 2024 is 49000. If we get a confirmed break here we could see a strong upside continuation and new highs. Near-term, short-trade entries have a higher probability of success but for the conservative traders upon a break below 41500. Long trade entries are also possible but only on a price action confirmed break above 49000. You can try a short trade here with a stop loss above 46000. For inquiries about account management please write to [email protected].