
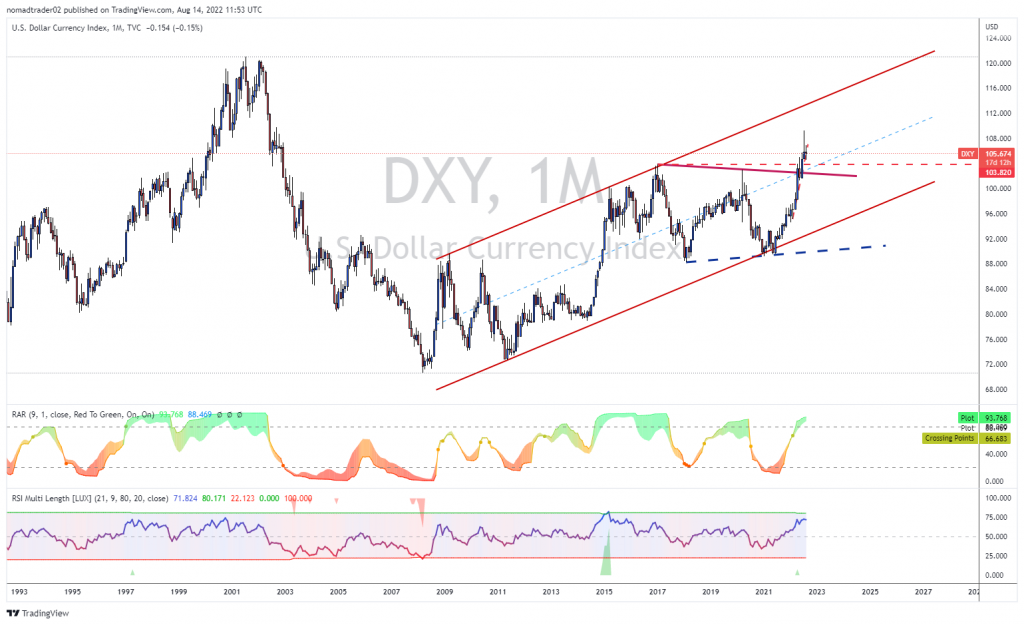
DXY uptrend support bounce
DXY is testing the strong upside confluence support 105-105.50 zone. This is coming after the strong pullback from 112. It is also near the middle of the uptrend channel and a previously broken strong resistance. A break above 106 again would lead to an upside continuation into the channel top 114-116 zone.

The weekly chart reveals an uptrend support line touch and a possible bull flag formation. End of the week bounce is giving this uptrend continuation legs. Now only a confirmed break below 104 could lead to a deeper pullback if 102 also gives up.

JOIN TRADER’S CLASSROOM TO LEARN A PERFECT ENTRY AND EXIT TIMING IN ALL ASSET CLASSES
On a daily chart, we can see a good RR trade opportunity Already a member? This article is so good, it’s for premium members only.
Does that sound like you?
Go Premium to read full trading strategy with parameters of entry, stop loss, and exit. Why Premium?
We have used the combination of the top-down trading analysis to get these critical levels explained in the charts. Also, you can see Elliott Wave and price action analysis together in action along with the Andrews Pitchfork channel tool. If you want to learn the trading strategy that will give you immediate results in your trading register for Trader’s classroom.
