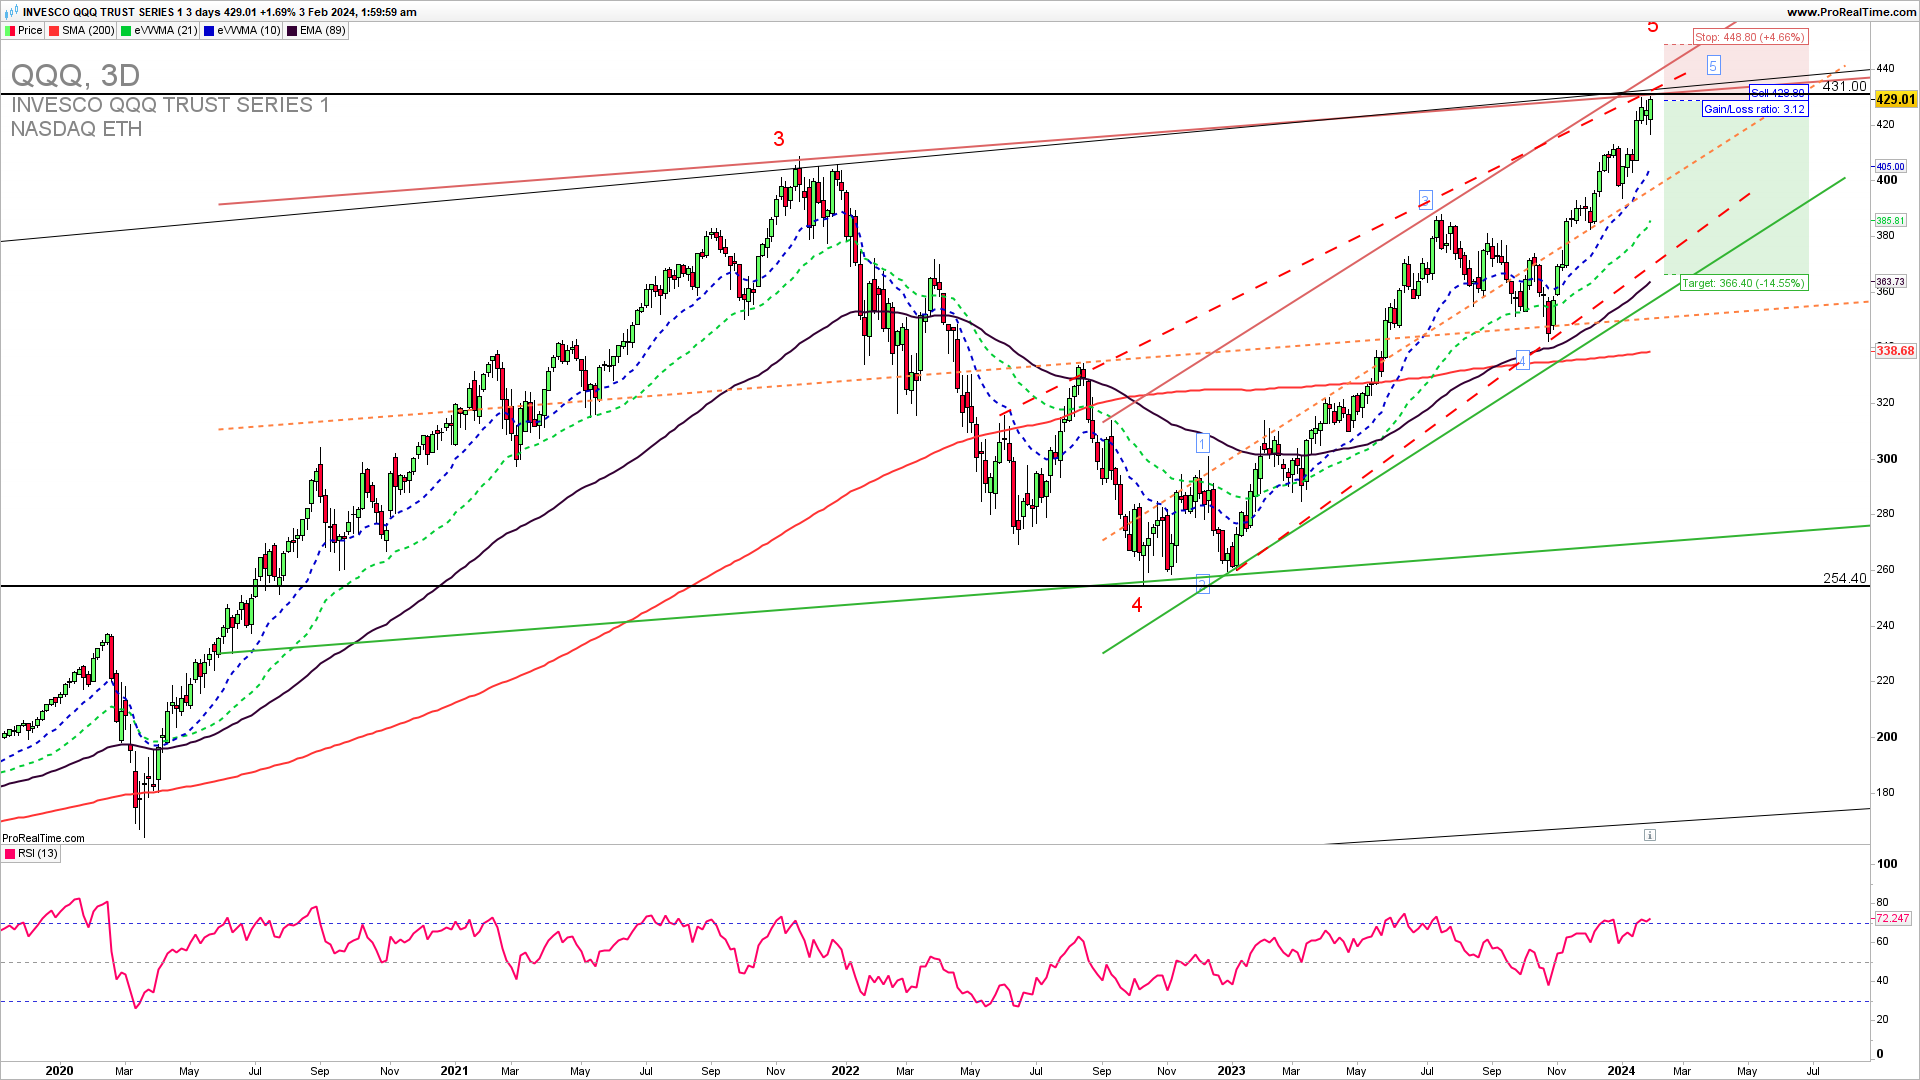
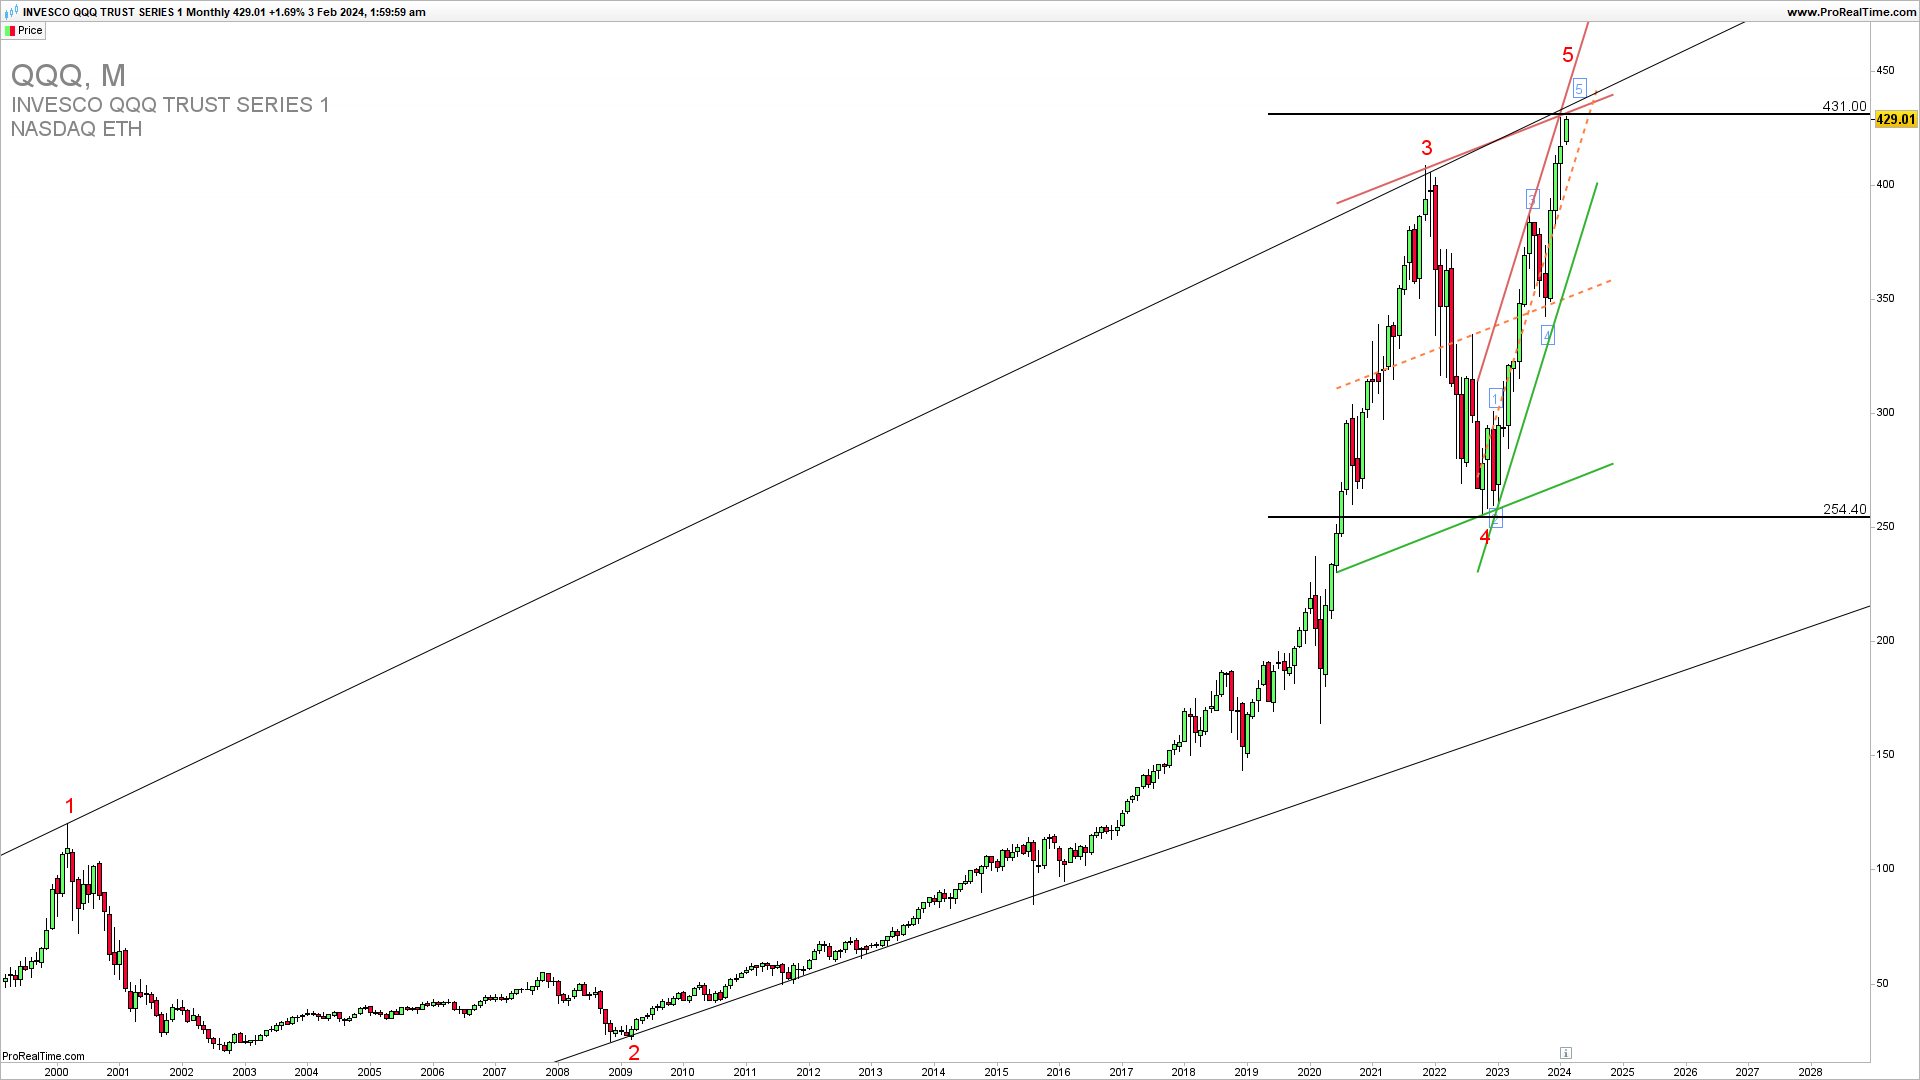
As the tech stocks market has been reaching new highs QQQ is extending higher and is testing the most important long-term resistance 430. If we get a rejection here there is no support till 380. The most significant support seen on the monthly chart is 350. Also on the monthly chart visible is a long-term broadening wedge with the five upside waves perfectly aligned and the five waves of the fifth long-term wave.
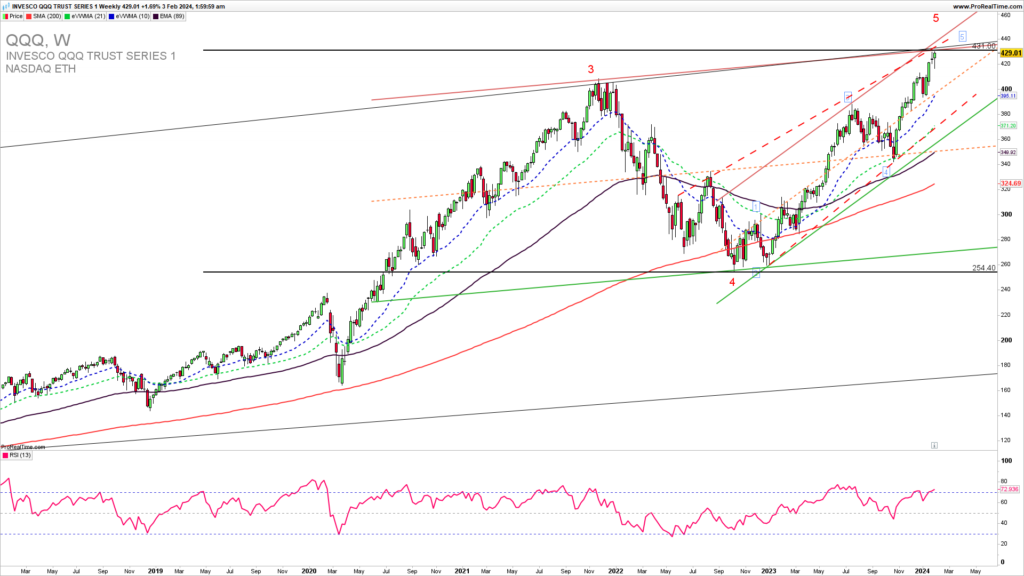
The Weekly QQQ chart reveals an addition to the previously mentioned, a rising wedge upside resistance test as well with no significant upside breakout above the high set in January. A break above the 430 is now required to invalidate the downside reversal. A break below 417 in the coming days will open the pullback to the 350-380 zone. RSI is posting a negative divergence as well.

GET THE CHART OF THE DAY EVERY DAY IN YOUR INBOX
As the famous trader says…
“When you genuinely accept the risks, you will be at peace with any outcome. ””Mark Douglas
How to trade this?
It is a fact that a strong upside resistance for Q1 2024 is 430. If we get a confirmed break here we could see a strong upside continuation and new highs. Near-term, short-trade entries have a higher probability of success. Long trade entries are also possible but only on a price action confirmed break above 430. You can try a short trade here with a stop loss above 440. Thsi trade entry has a huge Risk to reward and is better than the long trade. For inquiries about account management please write to [email protected].