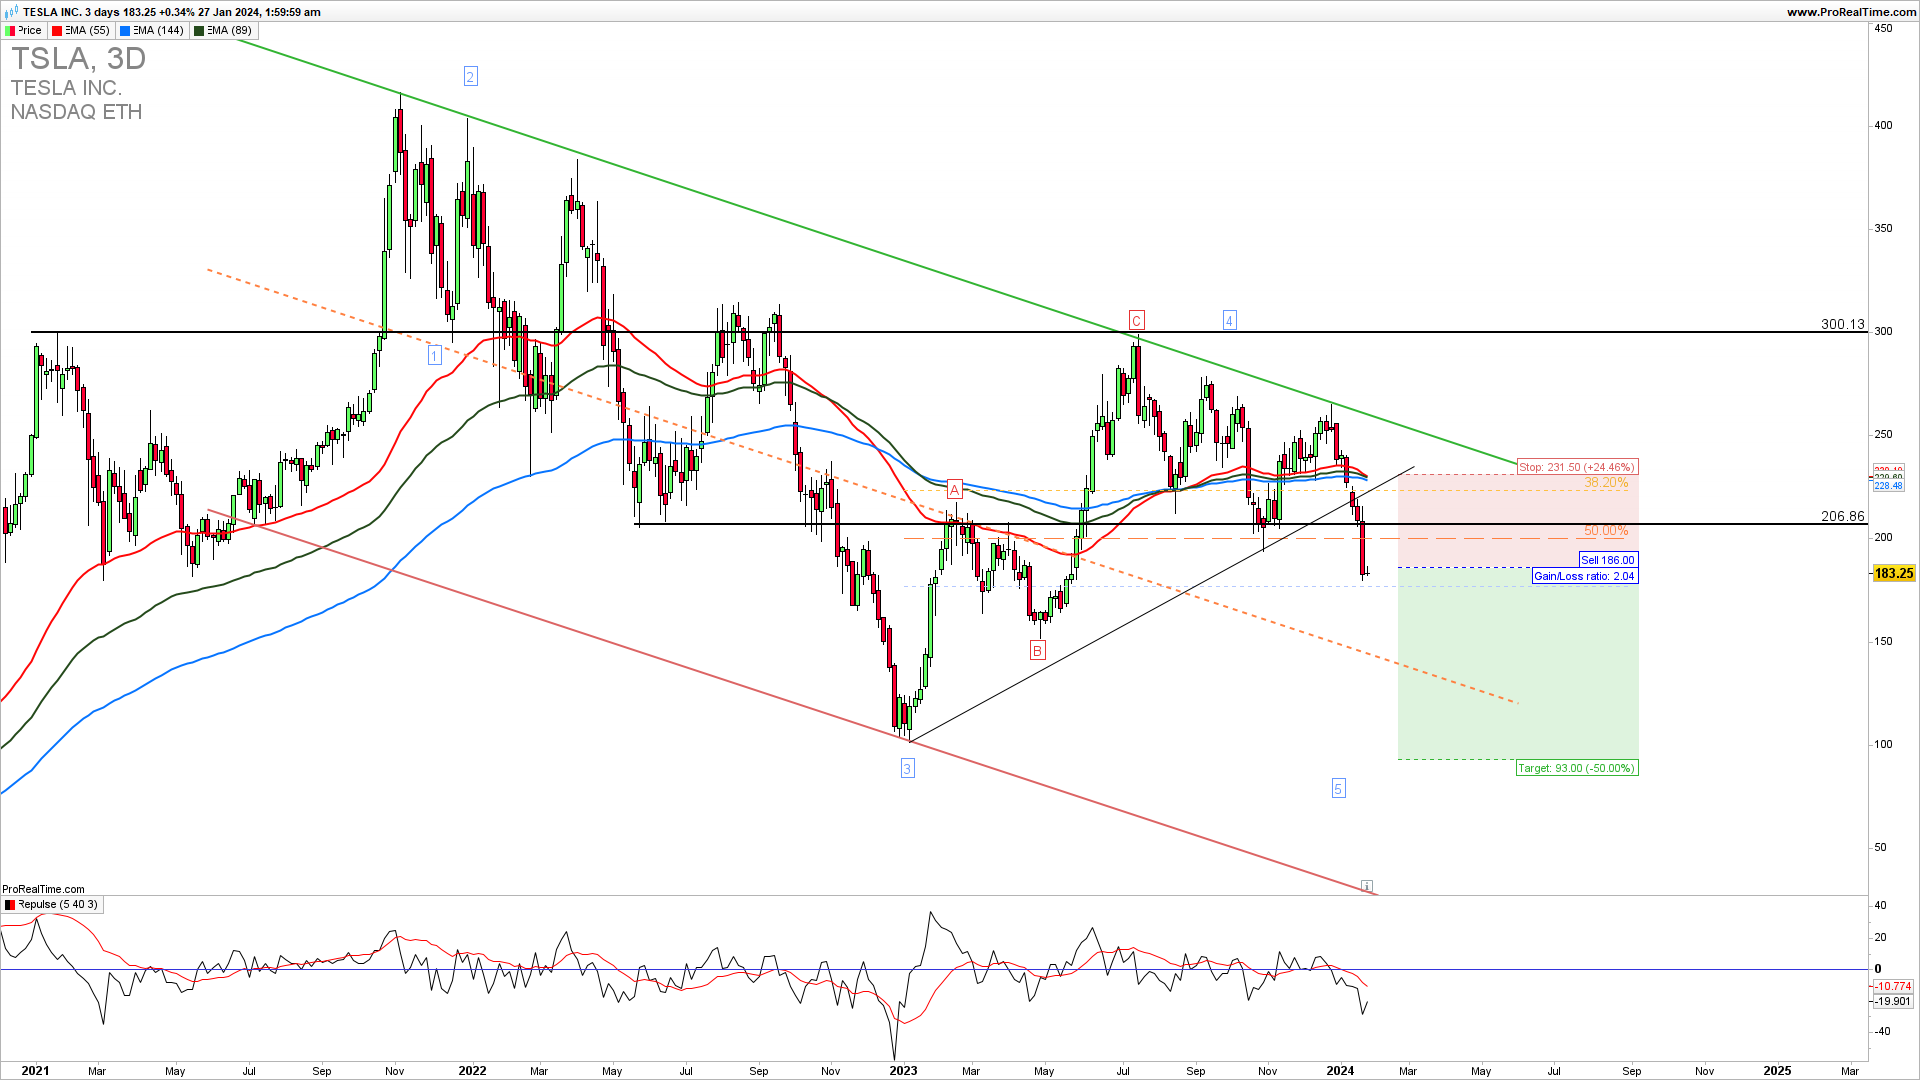
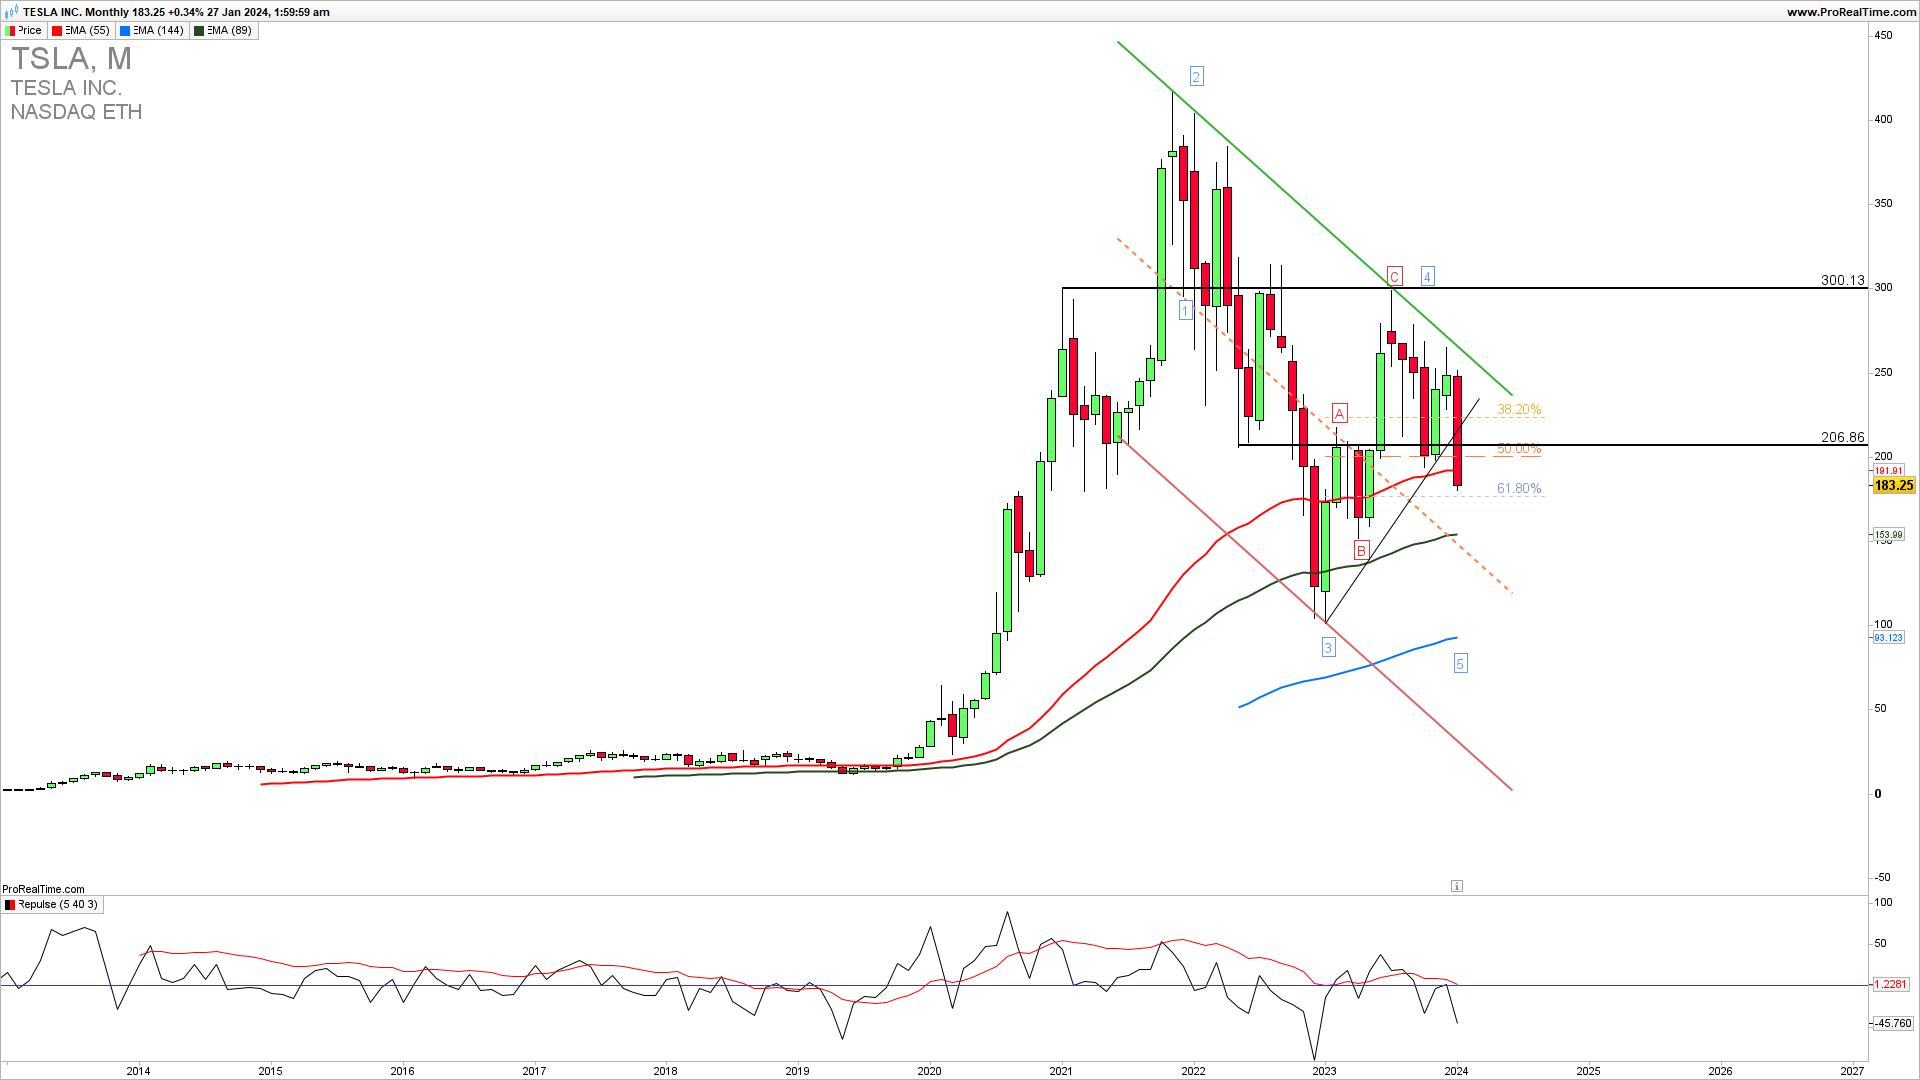
As the overall market has been reaching new highs TSLA is having a rough month. It has been rejected by the strong upside resistance 270 and is reversing the downside just to confirm that medium-term five waves down are not finished and we could see an extension lower to 100 in the coming weeks. The only stronger support left now as it can be seen on the monthly chart is 150.
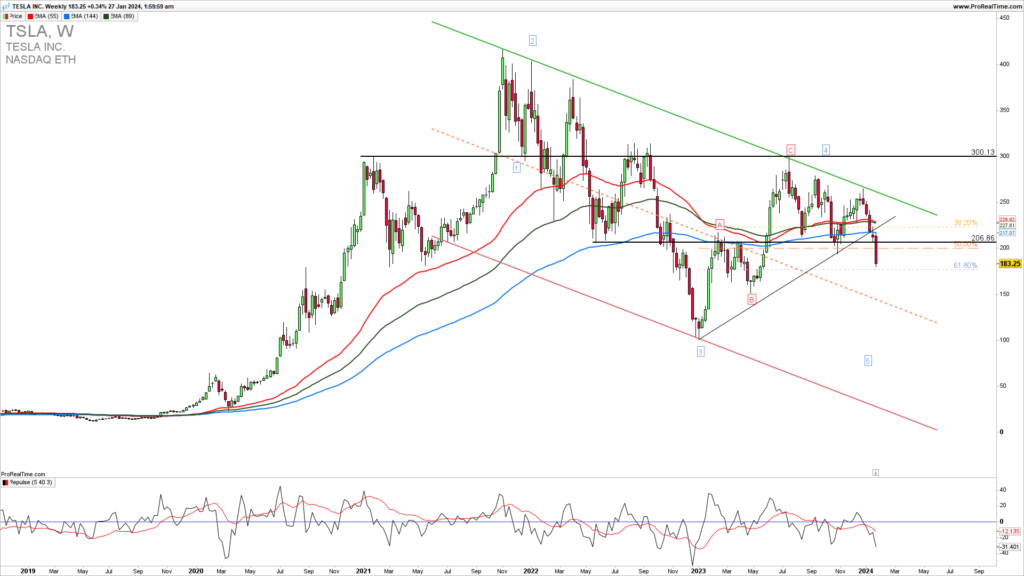
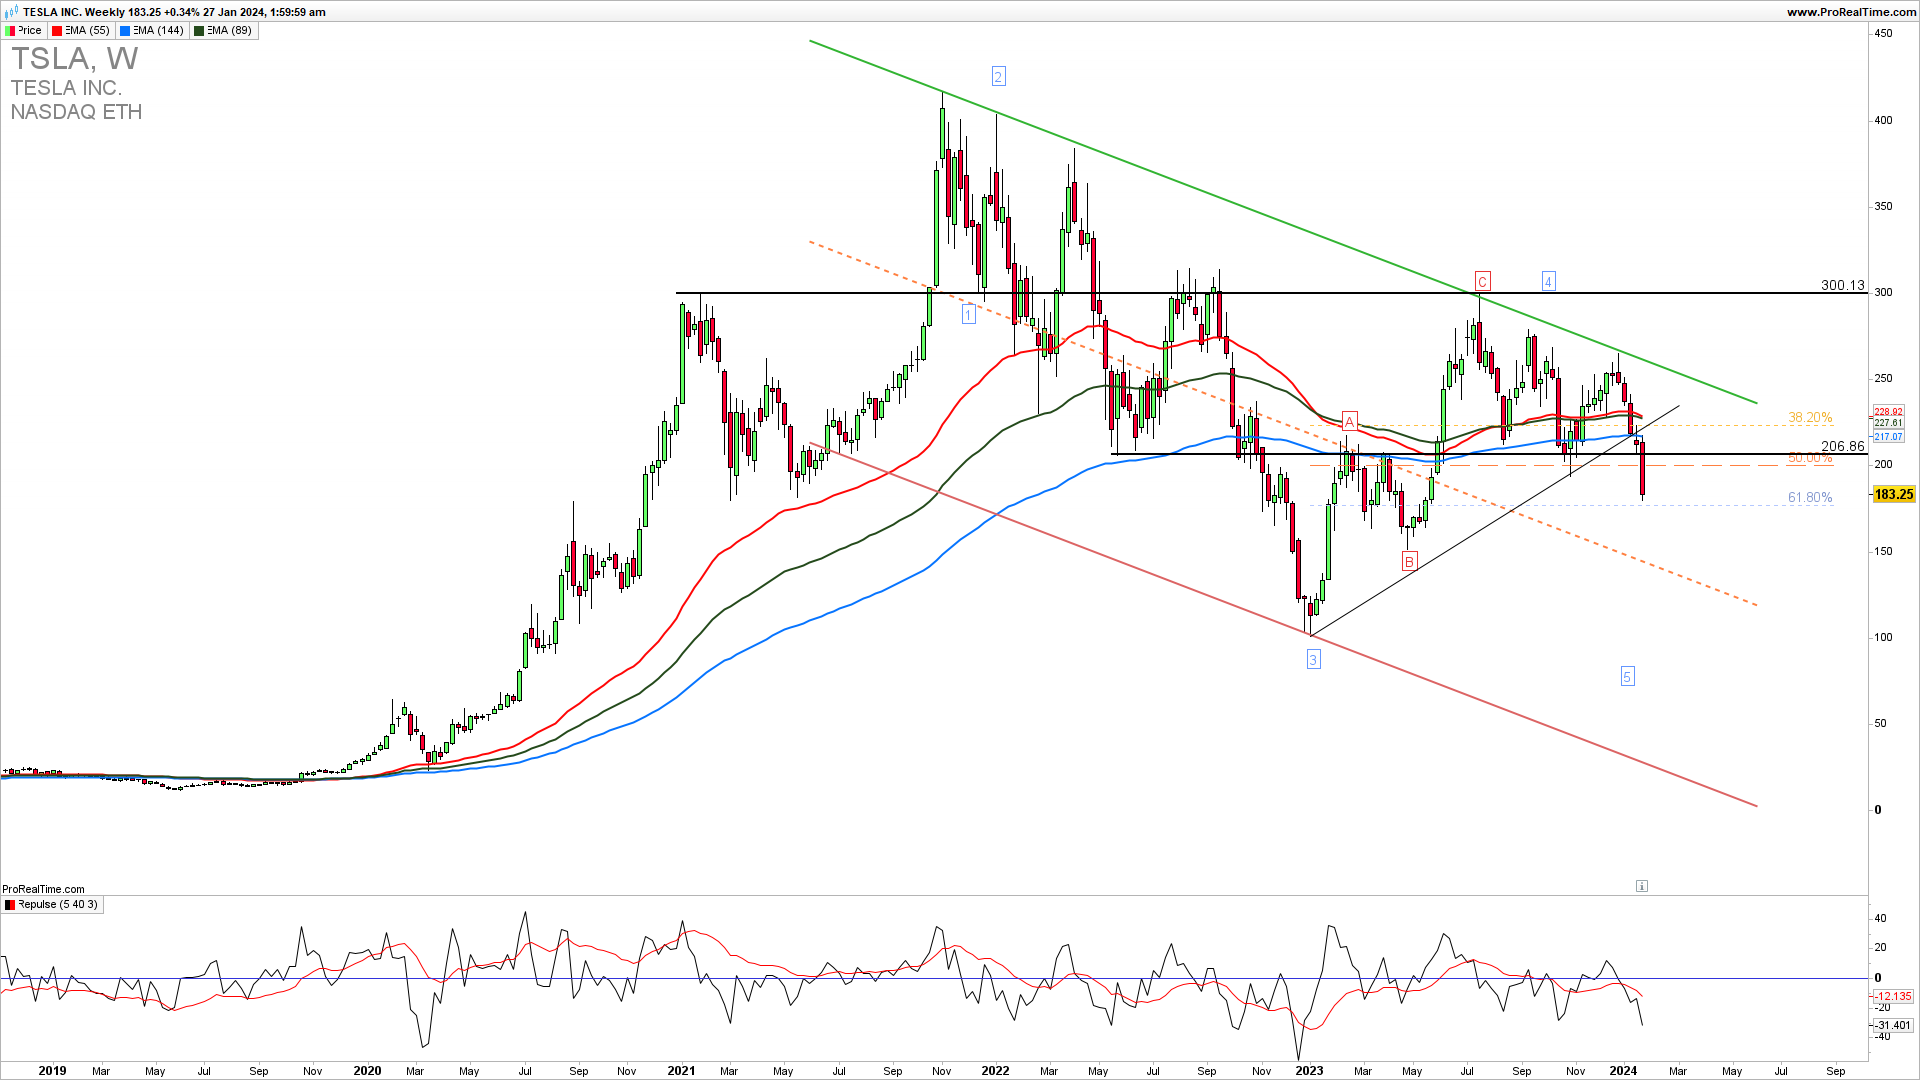
The Weekly TSLA chart reveals the breakout below the strong resistance 200, and that can lead to a test of the last upside support of 150. A break above the 240 is now required to invalidate the downside extension. A break below 150 in the coming days and weeks will confirm the fifth wave extesnion with 100 level target.
GET THE CHART OF THE DAY EVERY DAY IN YOUR INBOX
As the famous trader says…
“The game taught me the game. And it didn’t spare me the rod while teaching.””Jesse Livermore
How to trade this?
It is a fact that a strong upside resistance for Q1 2024 is 240. If we get a confirmed break here we could see a strong upside continuation and new highs. Near-term, short-trade entries have a higher probability of success. Long trade entries are also possible but only on a price action confirmed break above 240. You can try a short trade here with a stop loss above 210. For inquiries about account management please write to [email protected].