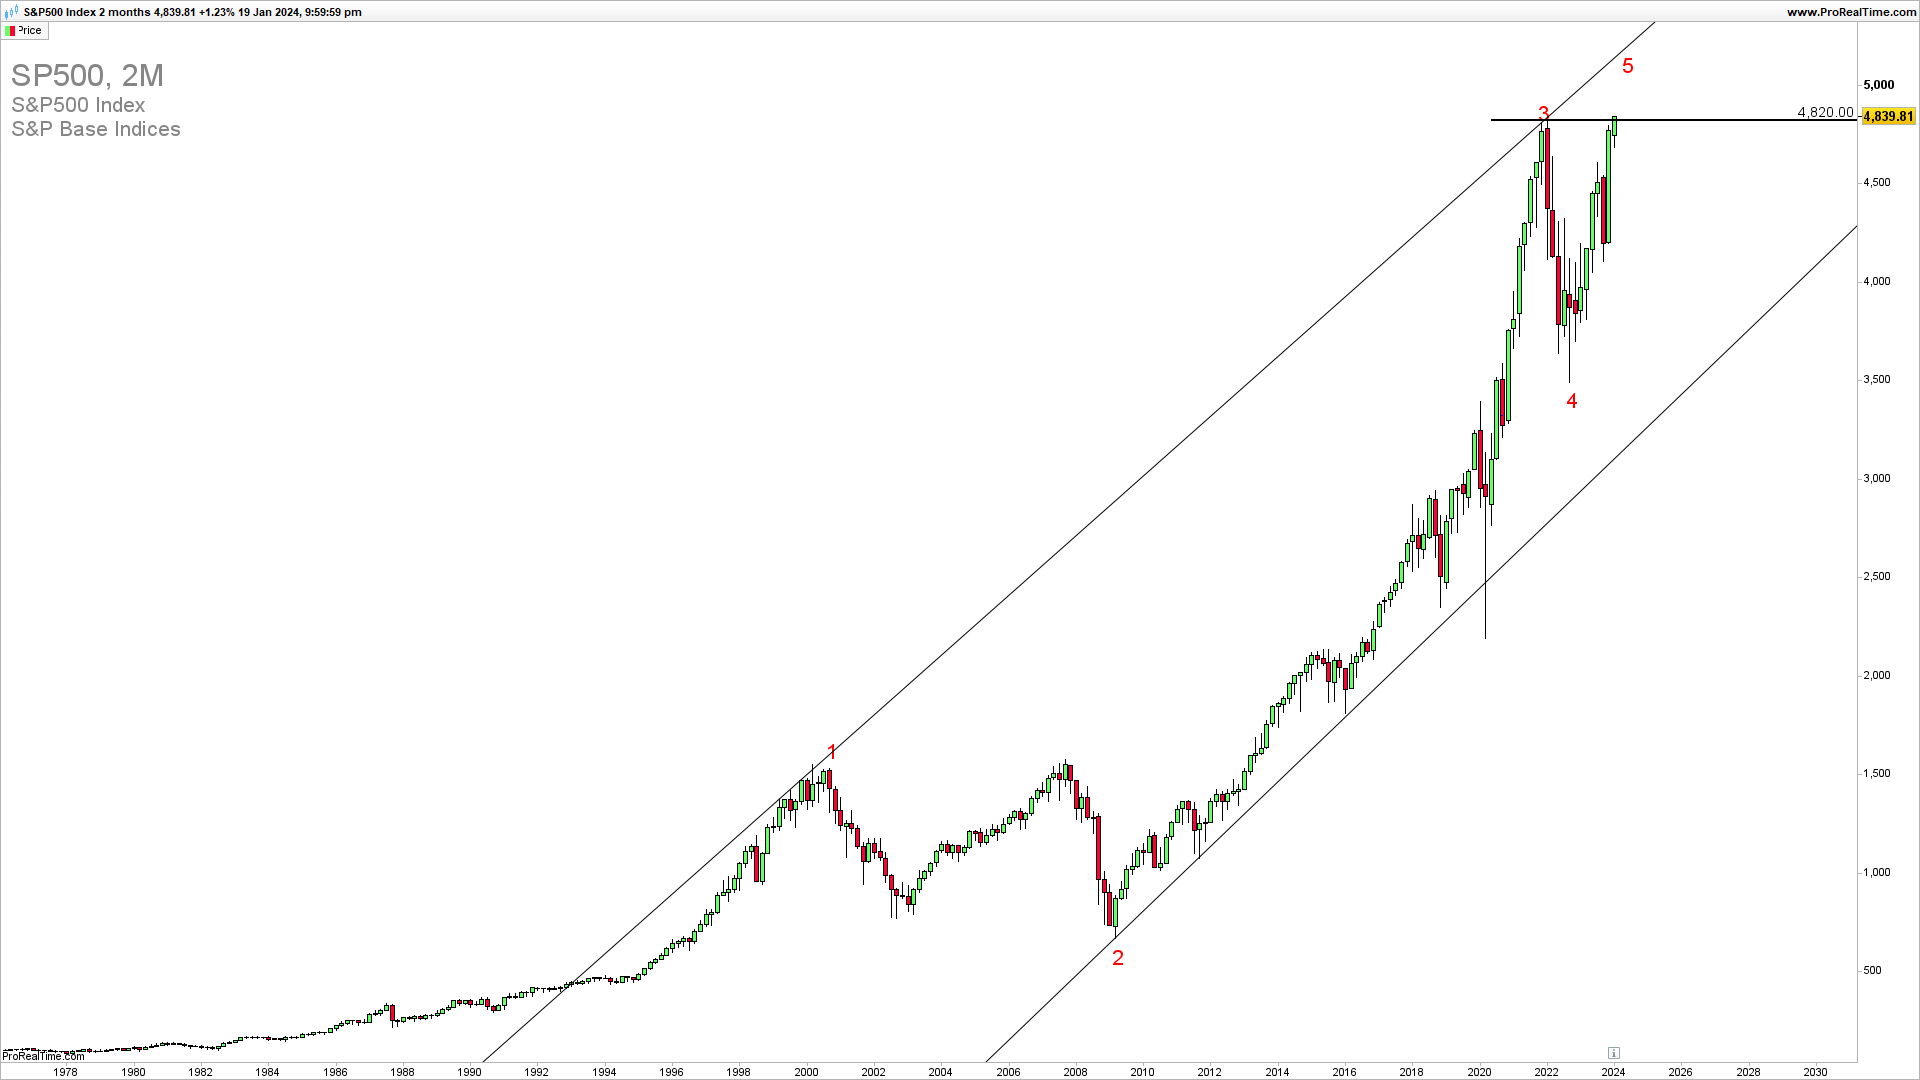
SPX has reached a new high of 4830 just a little above the previous one posted in January 2021. A confirmed break above this resistance will lead to a test of 5000. Still, this is seen as a terminal phase of the long-term five Elliott upside Waves we should be cautious about the upside extension as this fifth wave could be finished.
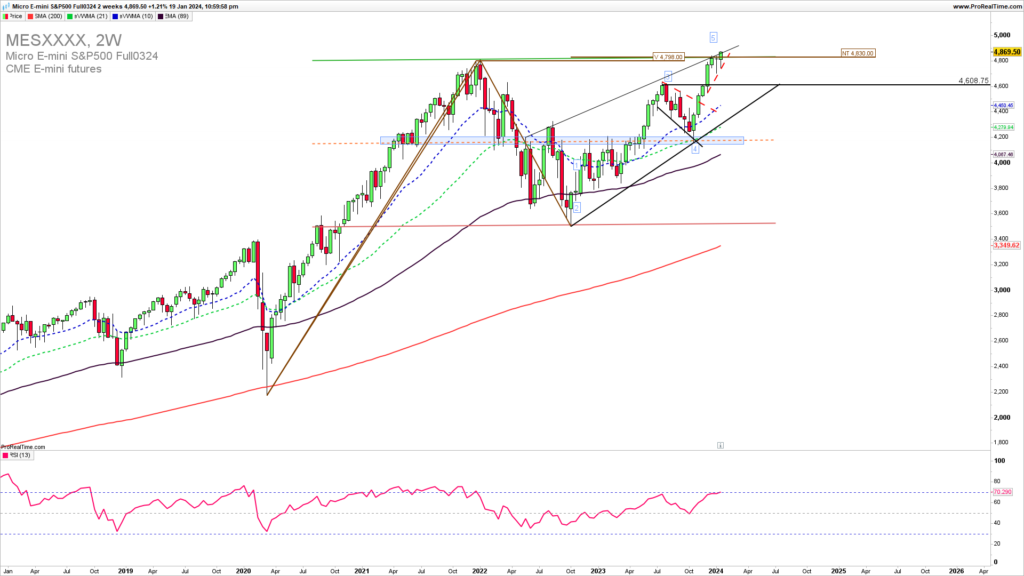
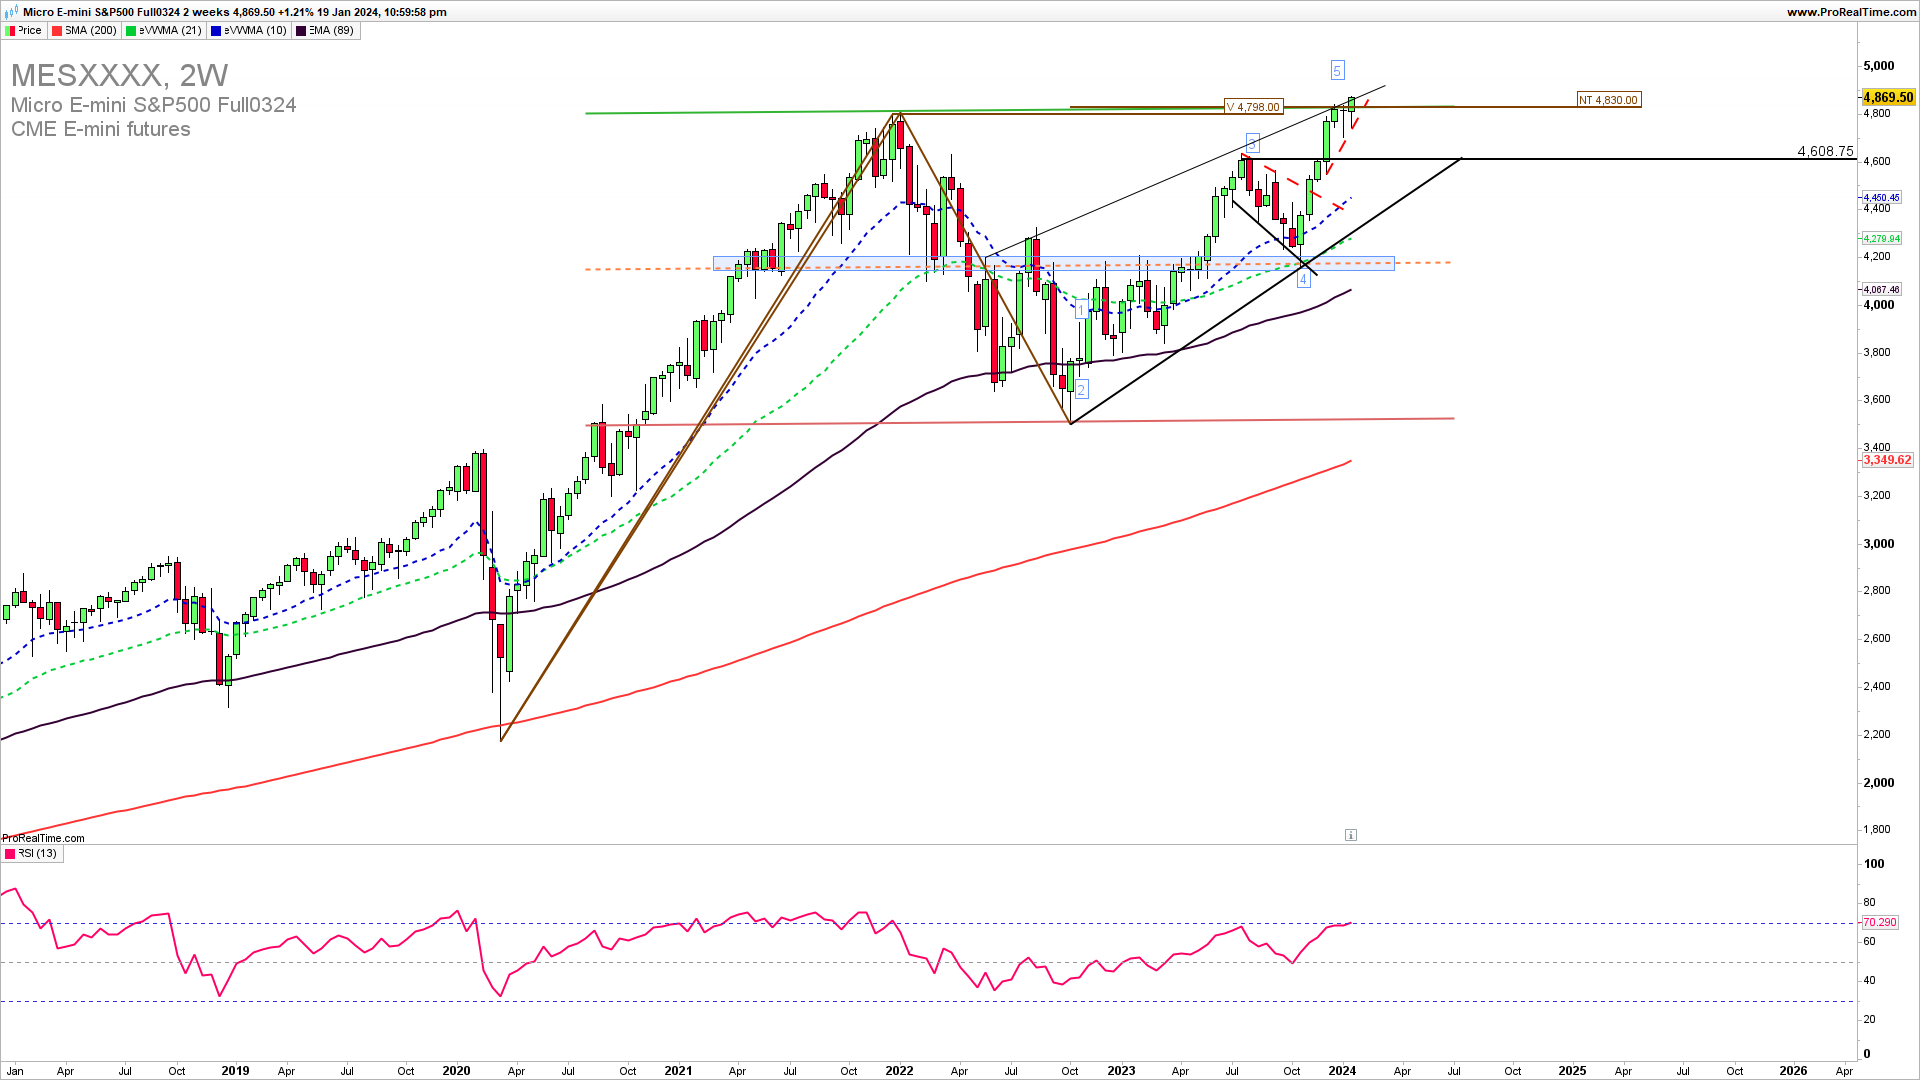
The Weekly SPX chart reveals the rising price action wedge, a test of its upside resistance, and an already-mentioned key 4830 resistance now is being tested. A rejection here and a break below 4730 is required to invalidate the immediate upside extension and will mark the fifth wave short-term finished especially in the case of a break below 4300 in the mdeium-term. For an upside continuation we need to see a breakout above 4900.
GET THE CHART OF THE DAY EVERY DAY IN YOUR INBOX
As the famous trader says…
“Trading doesn’t just reveal your character; it also builds it if you stay in the game long enough.””Yvan Byeajee
How to trade this?
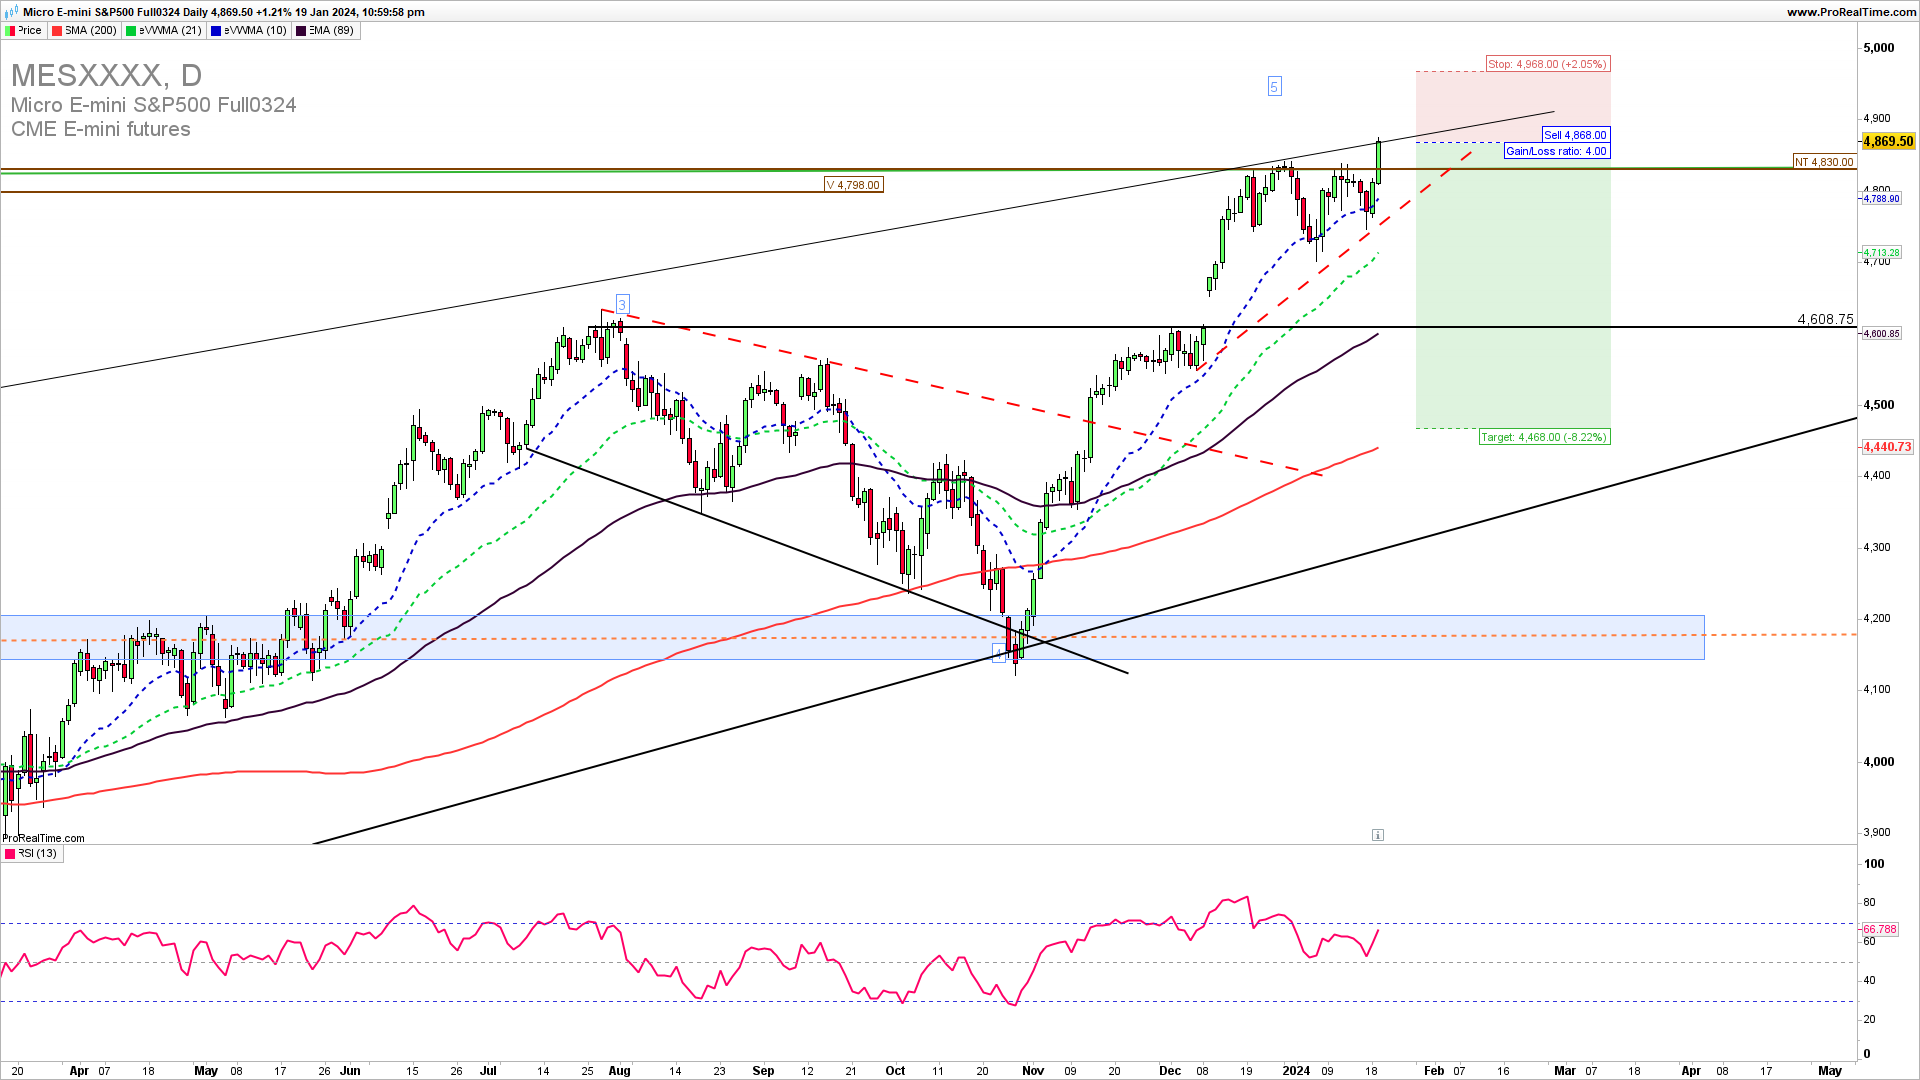
It is a fact that a strong upside resistance for Q1 2024 is 4900. If we get a confirmed break here we could see a strong upside continuation and new highs. Near-term, short-trade entries have a higher probability of success but for the conservative traders upon a break below 4730. Long trade entries are also possible but only on a price action confirmed break above 4900. You can try a short trade here with a stop loss above 46000. For inquiries about account management please write to [email protected].